JNJ trade ideas


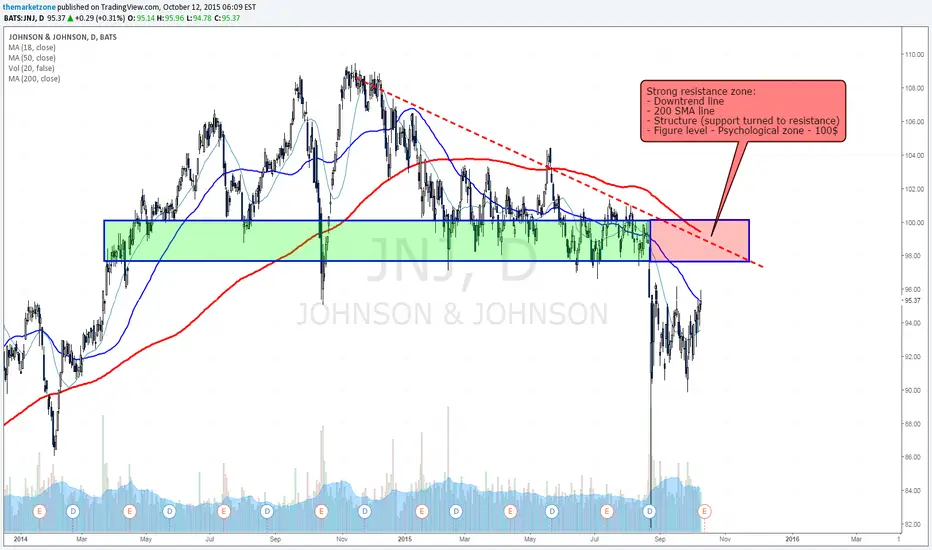
Basic analysis shows JNJ is about to face strong resistanceA very basic analysis for $JNJ shows that the stock is facing a major resistance zone before earnings.
The 98-100$ zone, a strong structure that held as support during more than a year, was broken during August and now became resistance.
Add the 200 SMA line, the downtrend line and the sellers pressure that this stock will face when it will reach the psychological number of 100$ and you'll get pretty good reasons to be concern if you are still holding a bullish position in $JNJ.
DOW JONES OVERVIEW: JNJ HOLDS LONG TERM TREND, SHORT TERM RISKJNJ micro picture currently contradicts macro one.
On long term basis, JNJ has held the test of 10-year trend by falling below and then bouncing back up above the 10-year uptrend border (marked by 1st standard deviation from 10-year mean, now at 91)
On short term basis, however, price has fallen below 1st standard deviations from quarterly (66-day) and 1-year (264-day) means, signaling continued downside probability.
The downside risk remains until the price trades back up above short term risk border, marked by lower 1st standard deviation from 1-year mean (at 97 now)

Johnson & Johnson vs USDJohnson & Johnson has seen extreme price consolidation since last November. Since they are a highly diversified healthcare company, currency translations affect their bottom line quite substantially. With the recent contraction of the US Dollar, Johnson & Johnson has broken out of a prolonged trading range. If the dollar continues to contract against other foreign currencies, Johnson & Johnson will make better on their hedges and increase the bottom line substantially, thus increasing free cash flow and overall economic opportunity.

JNJ longer term Iron CondorJNJ is going sideways. BCS is above the long terms and a strong resistance.


Watch this Level: Johnson&Johnson Weekly The next major weekly(medium term) Support level to watch for J&J. Watch for a rebound or a breakout.
Even if witness a breakout, usually short term bounces are highly probable before any sustained breakout.
Check my new website thefxchannel.com , vote and subscribe
twitter.com
My best regards,
Technician

JNJDaily presents a slightly different look than the weekly, While the SYM TRI is confirmed here, looks a bit sloppy. The NR4 is not yet confirmed.


Wolfe wave repeat from end of last year.Expect a short term bearish move.
Once that reverses, jump aboard for primary trend up into next year.

Wolfe wave repeat pattern from the end of last yearExpect a short term bearish move.
Once that reverses, jump aboard for primary trend up into next year.

$JNJfundamentals:
from the start of 2013 to the present...
price: +49.96%
revenues: +7.42%
on the other hand, free cash flow is down from 10.105B in Q3, 2010 to 7.974B for Q2, 2014
technicals:
the monthly Williams %R hasn't been below -80 since mid-late 2010.
this is indicative of positive pressure.

J&J: Heading to sideways range ceiling!-After breaking below 90.00 support area and heading sharply lower, shares managed to rebound strongly back above that broken level
-The price has recently retested that level, before bouncing confirming the level as a new support.
-Rising volume on the rebound
-price is trading within a sideways range since august
I am looking for a move towards 94.40 and 96.00 resistance levels.
twitter.com
thefxchannel.com


JNJ Bottom inWait for Monday's close to confirm bottom. Stop loss is Friday's low or the candle before the hammer highlighted (~87.70). I think the market is done pricing in "taper."
