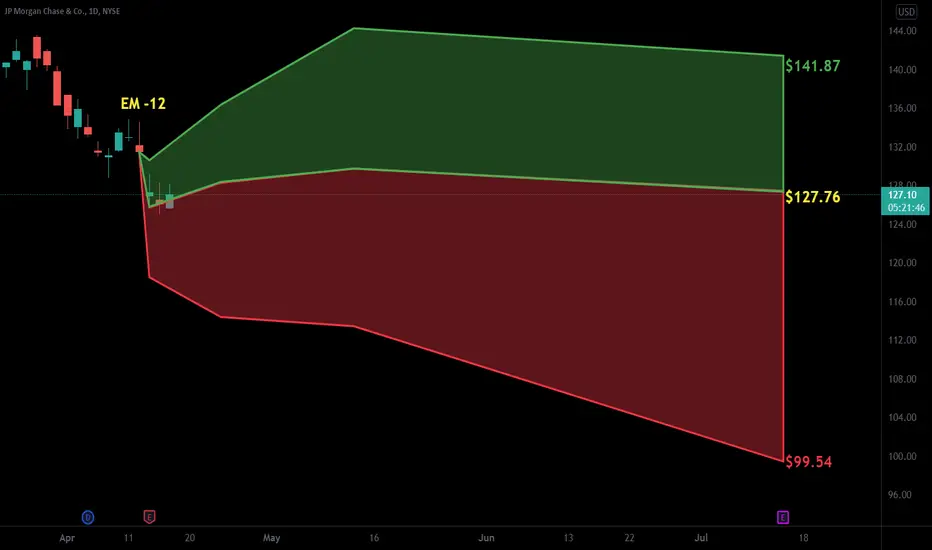
JPM - Revised LookHaving a look at JPM and comparing similar price structures leads again to a bearish result following this recent growth on the Weekly chart
Bottom point will be most likely along the horizontal green line and very like the point in the orange circle
JPM trade ideas

JPMorgan Targeting A $100 TestIn this update we review the recent price action in JPMorgan and identify the next high probability trading pattern and price objectives

Season models service(Eng subtitles)Friends, I am ready to offer you a service of seasonal models
What is included in the subscription :
Seasonality of the instrument you are requesting for the next year
The rate
of 6 requests per quarter for up to 50 instruments is $ 40
A more detailed description of the service will be in future publications
You can also clarify the details by writing to me in the Trading View chat
The first 5 clients will receive 1 month as a gift

JPM Repeating or Rhyming On the surface, crypto mortgages
function similarly to traditional
mortgages.
The only difference is that the collateral
is digital asset holdings rather than cash.
When you apply for a crypto mortgage,
the lender will first examine your crypto
holdings to determine how much you can borrow.
This is the most important consideration because crypto mortgage lenders will
not always require credit history and pay stubs.

Gap in the Rearview MirrorGreat stock and a strong stock with a very long impulse wave up.
It is often easier to draw impulse waves that are this long on weekly or monthly timeframes. It is easier for me to see the beginning of the wave as well.
Fib levels on the way down are marked as possible pull back levels. Price may stop in between two levels as well. Look for a level of support/consolidation.
There is a GAP to the left from a while back. I see consolidation under that gap.
As support levels fail, I set and alert for the next level. As of late I have done this numerous times for some stocks that I like.
My sister wants this one and thinks I am a fortune teller or something. She asked me "Do you think the market will hit bottom by next Friday?" She does not trade.
I am like "probably not. LOL" )o: When everyone is nauseated and thinks there is no hope, maybe we will hit bottom.
No recommendation
Don't forget to look in the rearview mirror.

The impact of the global recession The global recession will take effect, and the Vikov pattern will be fixed, and some suffering will be fixed for a while.

JPMorgan Testing Symmetry Swing ResistanceIn this update we review the recent price action in JPMorgen and identify the next high probability trade location and price objectives to target

JPM double bottomDouble bottom with divergence on MACD, RSI and Stochastic with 61.8% Fibonacci support from the bottom of the corona crash. Compared to the index finances are looking a lot better with JPMorgan Chase & Co. and Citigroup leading the way. Breakout of falling Wedge pattern shows a great opportunity for a Long position.

JPM Repeating Bearish PatternJPM is just above a major trend line (white)
It is forming a top pattern at the 1.272 Fibonacci line
This top pattern is very similar to what has been seen in the past, which led to a small break down of the trend line (red hammers)
This is the Monthly timeframe

JPMorgan Trading The WXY PatternI this update we review the recent price action in JPMorgan and identify the next high probability trading opportunities and price objectives to target


$JPM 4h Looking BullishVery bullish action on 4h with TTM Squeeze now positive and RSI calling for further upside. Watching closely..

JPM - Short Term Opportunity with 60% Upside?Given the tendency of banks benefitting from the periods when interest rates are rising, is JP Morgan going to provide investors an impressive 60% upside at these turbulent times?
Let's look at it in more detail.
Fundamental indicators:
Revenue and Profits - demonstrated consistent long-term earnings growth over the past 10 years
Profit margin - impressive 31% in 2021
P/E - 8.7x which is considerably lower than the current S&P500 ratio, i.e. very attractive
Liabilities - no problems with considering this is a banking sector
Technical Analysis (Elliott Waves):
Following the correction of March 2020 shares of JPM have been growing but in a very choppy manner which indicates a potential development of an Ending Diagonal pattern
Waves 1 to 3 have been already completed and we are observing the shaping of corrective wave 4. It has already entered the space of wave 1 bust just about and it's likely to correct a little deeper
Once wave 4 is completed this scenario suggests another zig-zag to the upside before global and very lengthy correction starts, that may last more than 2 years for JPM
What do you think about JP Morgan and its short term prospects?
Also let me know if you would like to see other stocks, indices, Forex or Crypto analysed using Elliott Waves.
Thanks
PS Below is the Educational post about Ending Diagonals

JPMNot financial advice.
The essence of investing & trading is the intelligent and patient preying on the greed, fear, impatience, addiction and ignorance of the majority. It's definitionally Darwinian.

Short scalp $JPMBased on its downtrend, regress off resistance and a familiar chart pattern confirmed by my technical indicators, I expect at least half a percent in profits IF $JPM breaches yesterday's low of $122.16 during today's session.

JPM - MONTLY ANALYSISFollowing the trend, I'd buy JP Morgan if breaks the latest high
Stop Loss - Below the lowest low from the previous candles
1st Target - R/R = 1,00 - 1/3 Position
2nd Target - R/R = 2,00 - 1/3 Position
3rd Target - R/R = 3,00 - 1/3 Position

JPMorgan Falls Thru Trap-Door Equivalent to Pre-COVID HighsNot much of an explanation needed here... financials have been struggling, and JPM right along with them. What's notable here is that price has fallen below the pre-COVID highs, which means that all recapture, plus growth obtained prior to COVID, has all be vanished for stockholders of the mega-bank.
Written & Annotated for the CMT Association.
Adam D. Koós, CFP®, CMT, CEPA
President / Sr. Financial Advisor / Portfolio Manager
Libertas Wealth Management Group, Inc.

JPM forming a descending channel?After ERs price made a below longterm support and it now can retest it as resistance.
I am watching price action to see if we can form a new descending channel.

JPM .50 FIB and 200 MA = BuyJP Morgan is a buy. 200 day moving average, .5 fib, while FED raising rates.

$JPM with a Bearish outlook following its earnings #Stocks The PEAD projected a Bearish outlook for $JPM after a Negative Under reaction following its earnings release placing the stock in drift D with an expected accuracy of 60%.
BUY BUY BUY JPMHello everyone, we are gonna see this hit $220 by 2023. BUY every time it hits a low a good price to buy in at is 110.65
I have a course on the best indicator set up.
Comment below to sign up. And thanks for reading.
Made thus short now go make some bread!!

$JPM weekly charthere is the current channel JPM is playing inside of. laid out some weekly levels to consider and watch for support and resistance reversals.

Bank earnings, winners & losersBank earnings are starting on Wednesday 4/13. Banks have been weak so far this year. In my opinion, Institutional investors are value trapped and hoping to make yield by selling options into earnings IV. Bank earnings guidance can be an important economic indicator for other stocks. Since bank earnings are the first to kick off the earnings season, they will reveal important economic insights that can directly or indirectly affect other stocks. Here's a 16 ticker list of the winners & losers for 2022 YTD and their earnings dates. Also, I have my Signal Blender beta (SigBlendbeta) indicator with RSI slow 40 (blue), VWMA fast 10 (white).
2022 YTD
MTB +6.17%
WFC +1.62%
SCHW -2.77%
USB -6.96%
BANC -7.25%
STT -9.4%
ALLY -10.05%
BAC -10.78%
MS -14.15%
C -15.53%
JPM -15.63%
GS -15.74%
BK -16.70%
BLK -19.67%
SYF -21.13%
FRC - 23.55%
4/13
JPM 7:05am
BLK 6:30am
FRC 7am
4/14
GS 7:30am
WFC 7am
C 8am
MS 7:30am
ALLY 7:25am
USB 6:45am
STT 7:30am
4/18
BAC 6:45am
SCHW 8:45am
BK 6:30am
SYF 6am
4/20
MTB 6:35am
4/21
BANC 6am
Do your own due diligence, your risk is 100% your responsibility. This is for educational and entertainment purposes only. You win some or you learn some. Consider being charitable with some of your profit to help humankind. Good luck and happy trading friends...
*3x lucky 7s of trading*
7pt Trading compass:
Price action, entry/exit
Volume average/direction
Trend, patterns, momentum
Newsworthy current events
Revenue
Earnings
Balance sheet
7 Common mistakes:
+5% portfolio trades, capital risk management
Beware of analyst's motives
Emotions & Opinions
FOMO : bad timing, the market is ruthless, be shrewd
Lack of planning & discipline
Forgetting restraint
Obdurate repetitive errors, no adaptation
7 Important tools:
Trading View app!, Brokerage UI
Accurate indicators & settings
Wide screen monitor/s
Trading log (pencil & graph paper)
Big, organized desk
Reading books, playing chess
Sorted watch-list
Checkout my indicators:
Fibonacci VIP - volume
Fibonacci MA7 - price
pi RSI - trend momentum
TTC - trend channel
AlertiT - notification
tickerTracker - MFI Oscillator
www.tradingview.com
