HS top formingOH OH HOT DOG
Where to?
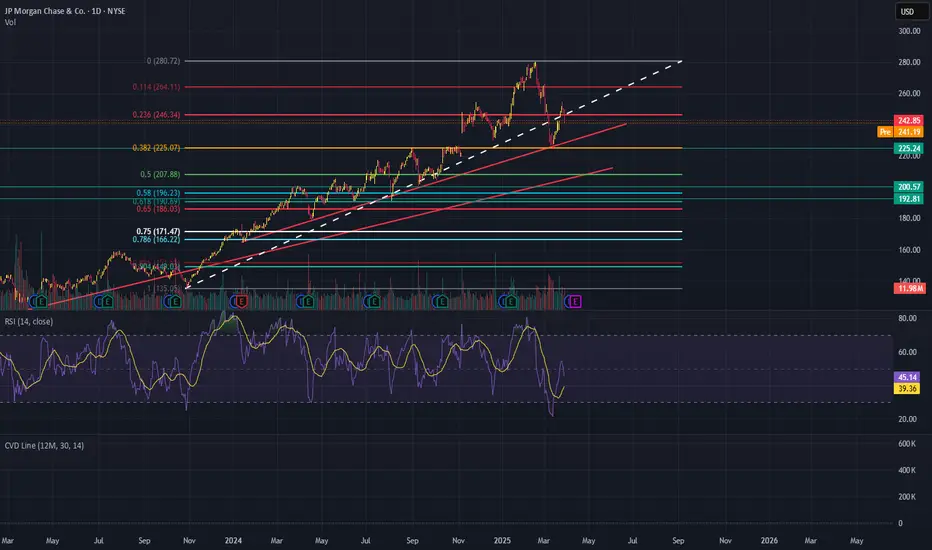
around the 170s for a homerun of the move.
we need to break below the trendline for it to work to the 0.382 and retest the trendline (or not retest)
straight for the domino stoploss hunt
For it to work we need 1. ratecuts to not arrive (less loans, too expensive)
2.sp500 to keep nuking which is acting up from the same reason as reason number 1
JPM trade ideas
$JMP - It is still early butNYSE:JPM Even JP Morgan Chase is showing a potential head and shoulders. It is still early but still...👀

Potential Bearish and Neutral ScenariosPotential Scenarios:
Bearish Scenario: If the stock breaks the neckline at $250.96. The downside target is generally calculated by measuring the distance from the head to the neckline, and projecting that distance downwards from the breakout point.
Neutral Scenario: The stock could consolidate around $250, fighting to break upward.

JP MORGAN: Perfect 1W MA50 rebound targeting $350. JP Morgan is neutral both on its 1D and 1W technical outlooks (RSI = 54.173, MACD = 7.520, ADX = 32.502), suggesting that it remains inside the best buy zone for the long term. As a matter of fact, having rebounded exactly on its 1W MA50, this is the best buy opportunity since October 23rd 2023, which was the last time it hit the 1W MA50. As shown, the long term pattern is a Channel Up and every contact with the 1W MA50 has coincided with a 1W RSI test of the S1 Zone. There is no better buy entry than the current level and we can safely aim for yet another +57.76% run (TP = $350.00).
## If you like our free content follow our profile to get more daily ideas. ##
## Comments and likes are greatly appreciated. ##

JP Morgan LongJPM is now net long the regression break.
This a fast moving pair and I am considering my optoins.

JPM: Steady Growth with a Catalyst for Strategic Gains
- Key Insights: JPMorgan Chase & Co's market activity underscores a period of
controlled growth influenced by strategic financial instruments like the JP
Morgan collar. This mechanism suggests a reduction in price volatility,
offering investors an anchor amidst fluctuating markets. The magnetic effect
of the collar helps moderate market rallies, securing a stable trajectory
for JPM's share movement.
- Price Targets: With a view toward a long position, here are the recommended
targets and stop levels for the next week:
- T1: $248.08 (2.67% above current)
- T2: $265.79 (10% above current)
- S1: $229.16 (5.16% below current)
- S2: $217.47 (10% below current)
- Recent Performance: JPM has demonstrated resilience through its strategic
market engagements, especially with the installation of the collar at the
5565 strike price. This has created a gravitational effect, mitigating
severe market moves and ensuring relatively stable growth patterns in the
midst of broader market flux.
- Expert Analysis: Market sentiment, echoed by experts, appreciates JPM's
ability to maintain equilibrium in market excitement. The structured
financial mechanisms that JPM employs act as a cautious yet optimistic
roadmap for investors seeking stable appreciation. With the exertion of
significant influence over financial indices, JPM's strategies are steering
economic monitoring towards more predictable growth forecasts.
- News Impact: While JPM maneuvers through the market, external factors like the
downgrading of Tesla's price targets illustrate broader market adjustments
to resolve risk perceptions and brand sentiments, which can subtly reflect
on JPM's positioning. Such shifts in market expectations among high-stake
companies further frame JPM's calculated approach to fostering enduring
investor confidence.

$JPM Navigating a Narrow ChannelJPM has 2 plots playing out, a rising wedge nested with a larger broadening wedge. We have negative divergence showing up on TSI & RSI showing that we might reach an early peak in current weekly cycle. Though price is above the a horizontal resistance, there is a higher probability that this is a false breakout.
A weekly swing high can be a signal for an entry with expectation we break below wedge support.

JPM rally ending soon?My overall thesis is we are in the very early stages of a multi-year decline ultimately with the S&P 500 below 3500. I have been wrong many times before so I will just take this thing in stages and see if it plays out. After this massive decline, we should be in for a great market rally of many decades. I am expecting the market to end its recent rally this week. The current rarely would be about a week in length depending when it began for individual stocks. The rally has done a few important things with its slow and prolonged upward movement, mainly prevents a wave 3 signal from occurring during the next decline.
My wave 3 indicator tends to signal wave 3s and 3 of 3s. See my scripts for the specifics of the indicator. If the market had a short wave 4 up and then a sharp or prolonged drop during wave 5, a new wave 3 signal would occur which violates the currently placed Minor wave 3 (yellow 3). Allowing separation from the current wave 3 signal enables wave 5 to drop quick or slow.
This chart applies select movement extensions based on wave 1's movement on the left and then another based on wave 3's movement on the right. I keep the values between 0%-100% on the chart for wave 2s and 4s retracements of the preceding wave's movement for reference even though the retracement values would be inverted.
Specifically for JPM, Minor wave 3 was longer than wave 1, which does not place a maximum length on wave 5. Assuming wave 4 ends on Thursday or Friday, Minor wave 5 could be a week or longer. In that time, at the very least it should drop below wave 3's bottom of 224.23. Using some basic movement extensions, it will likely go lower. The 5 wave lower pattern for this fifth wave is hypothetical, but a bottom could occur between 203 and 214. Once we bottom, we should see another rally over a few weeks. I will forecast what that could look like as Intermediate wave 1 nears its end.

JPM: Eyeing Potential Buying Opportunities Amid Market VolatilitKey Insights: With JPMorgan Chase trading at $232.44, investors should monitor the
$225 support level, approximately 3% below the current price, as a potential
buying opportunity given the current broader market volatility indicated by the
high VIX. While there are recession concerns with a projected 40% possibility
from JPM's economists, the absence of severe declines in key economic indicators
like unemployment and business profits provides a mixed economic outlook.
Responding strategically to challenges, JPM's revised code of conduct
underscores attempts to enhance its corporate image and manage client relations
amid market fluctuations.
- Price Targets: For the coming week, professional
traders suggest long positions with the following levels: Stop Level 2 (S2) at
$223, Stop Level 1 (S1) at $225, Target 1 (T1) at $238, and Target 2 (T2) at
$242.
- Recent Performance: JPMorgan Chase shows resilience despite broader
market weakness, marked by its positioning near the critical $225 support level.
The overall market sentiment remains cautious, as reflected in the 10% S&P 500
correction from all-time highs, indicating potential pressure on financial
stocks like JPM.- Expert Analysis: Experts note JPM's robust response strategies
amid a volatile market environment, albeit tempered by possible recession
implications. A mixed economic scenario, with stable employment yet underlying
market uncertainties, continues to shape investor sentiment toward financial
equities like JPM.- News Impact: Recent amendments to JPMorgan Chase's code of
conduct reflect a strategic move to mitigate reputational risks and align
corporate ethics, potentially influencing its market perception and client
engagement positively in a challenging market landscape. Investors should watch
for any further policy changes and their impact on market performance and
sentiment.
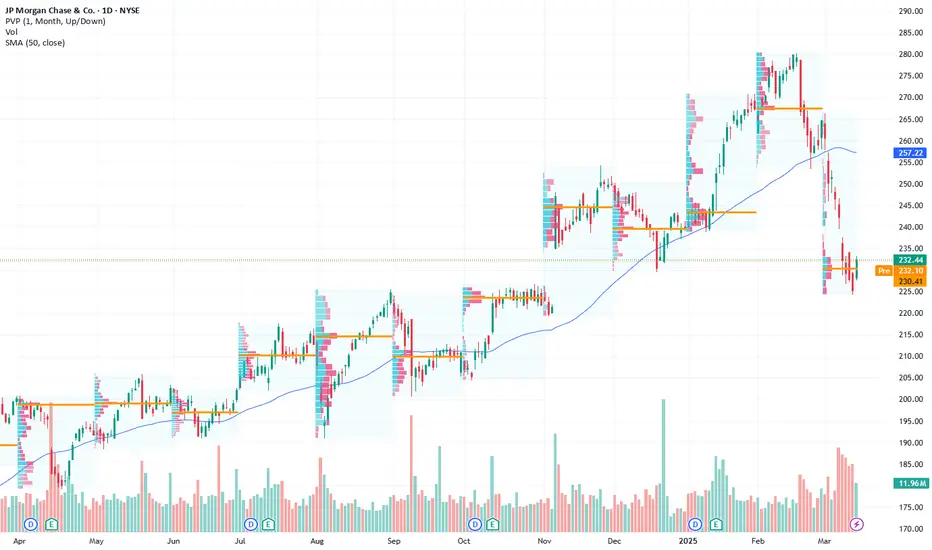
JPM VP price predictionJPM Price prediction based on Volume Profile. Be ready to short when it retraces to fill the gap. As it is financial sector is overvalued

What a level for JPM- can it bounce from here?I've been waiting for the financials to come in hard like this for a while. Will we have a recession or not is the headline question pushing the markets down. But in reality, before making new highs the markets always pullback. Until they dont, but that would be just one time. is it this time or not is not for me to decide. I just do what i was taught to do- buy pullbacks or short the rallies...

JPMWe are going to invest in JPM shares, aiming for a 12% gain before the end of April. Good luck to everyone!

$JPM Tradespoon - Long Entry $266.80Tradespoon model generated long signal for JPMorgan Chase & Co NYSE:JPM/PJ . Predicted range: $266.80–$277.94. Trend: -0.81%. NYSE:JPM/PJ

JP MORGAN: Chart where we should ALWAYS operate!!
On January 15, JP Morgan presented its income statement, recording profits of $14 billion in the fourth quarter of 2024, which represents an increase of 50% compared to the same period of the previous year, and earnings per share were $4.81, compared to $9.3 billion, or $3.04 per share, a year earlier. Its shares had not stopped rising since then until last Thursday, when it began a correction phase.
--> What does it look like technically?
As always, the first thing to analyze is the medium-long term trend in its main time frames (Weekly, Daily, H4), and as can be seen in the table, it is clearly bullish (Bull). It is the chart where we should ALWAYS operate after each price pullback phase. ( AS IS HAPPENING RIGHT NOW ).
The second thing would be the STRENGTH to know if the price is still rising or is in a phase of decline. As we can see in the table, in Weekly and Daily the STRENGTH is bullish ( Bull ), but in H4 it is bearish ( Bear ), that is, the price is in a CORRECTION PHASE.
--> How far could the price fall?
Once we are clear that its TREND is bullish ( Bull ) STABLE and that in H4 the STRENGTH is bearish ( Bear ), that is, in a correction phase, what we would have to wait for is for the STRENGTH to turn bullish ( Bull ) again to end the correction and be able to enter longs again.
Knowing how far the price can fall is impossible because NO ONE KNOWS IT, but we do know the typical retracement zones using Fibonacci and supports and resistances, and so we wait for the price to reach one of them and from there start a new bullish impulse on the way to maximums.
At the moment it has reached the first Fibonacci zone (23.6%), therefore, all that is left is for the FORCE in H4 to turn bullish (Bull), because as long as the FORCE does not turn bullish (Bull), the price could continue to fall.
Important Fibonacci levels to which the price could fall:
38.2%: 261
50%: 255
61.8%: 249
Conclusion: WAIT for the graph to show us bullish FORCE (Bull) in H4 time frame.
---------------------------------------------------
When the FORCE turns bullish (Bull), I will update the analysis with the entry SET UP.
Greetings and good trading.

JPM Short on Regression BreakJPM had terrible day of 4.4% down and broke the uptrend on the Regression Break.
Considering the possible options of EA

Breakout Pattern + 3 Step Rocket Booster StrategyOne thing is for sure if you are making money
people don't really care whether you
are introverted or extroverted
Its sad to see my brothers
being bullied for being
introverted when deep down
they have the academic skills
to propel their lives
but maybe they lack the resource skills needed
to get there.
Sometimes they may be forced into
doing something such as drinking beer
in order to look more social.
When beer drinking is really not so good for
some introverted people.
When I see this it makes me sad.
Looking at this chart is something thats
hard to believe.Because its a breakout pattern.
What Is The Breakout Pattern?
This is when the support becomes resistance
And its at this key level that you are ready to
see a change in price action for NYSE:JPM .
Also on top of that, this confirms the rocket booster
strategy.
What is The Rocket Booster Strategy?
This is when:
#1-The price is above the 50 EMA
#2-The price is above the 200 EMA
#3-The price hits New 52 week high
This strategy is the key to finding
equity stocks with the potential to give you
at best between 4- 8% per month
In the stock equity market.
Rocket boost this content
to learn more
Disclaimer: Trading is risky please learn risk
management and profit-taking strategies
also, feel free to use a simulation trading account
Before you trade with real money

The New 52 Week High And The Rocket Booster StrategyWhen you look at this price action you
can see the new high is showing up but
notice that when it first hit the new high
It crashed this was something that could have discouraged you
especially if you are trying to understand or make money
money in the stock market
If you are looking at the CCI of this stock NYSE:JPM
its in the oversold position and this could cause
the FOMO...as retail investors start
buying, this will increase the level of price
movements.
One thing for you to remember
is the 3-step rocket booster strategy:
-The price is above the 50 EMA
-The price is above the 200 EMA
-The price has to reach a new high
Always remember that trading is a game of patience
if you want to learn more rocket boost this content
Disclaimer: Trading is risky you will lose money
whether you like it or not
please learn risk management and profit
taking strategies
Also feel free to use a simulation trading account.

JPM: Exponential Scaling PHI 0.25 Progression RateJPMorgan Chase exhibits a logarithmic price progression that aligns with exponential scaling based on Phi with a 0.25 progression rate, providing a structured framework for understanding its long-term growth dynamics. Historically, price movements have respected these exponential levels, indicating that market participants react to percentage-based growth.
From 2016 onward, JPM transitioned from gradual accumulation to an acceleration phase, breaking through key Fibonacci-based price clusters and confirming a shift in valuation. The parabolic surge since 2020, particularly after surpassing $100-$120, aligns with this structured expansion, with recent price action at $275-$280 testing one of the highest grid levels. This suggests that JPM is at a critical inflection point, where price may either consolidate before pushing toward $300, $325, and $360+, or retrace toward $250 or $225, following prior Phi-based support zones. The ability of exponential scaling to accurately map support, resistance, and market reactions highlights its superiority over linear scaling, ensuring better predictive accuracy for future price action.

JPM – Bank Stock on Fire! Breakout Setup in Play 🔥Technical Analysis (TA) for JPM – JPMorgan Chase
* Trend: JPM is forming a symmetrical triangle, consolidating after a strong uptrend. A breakout is imminent.
* Price Action: The stock recently hit $278.55 before pulling back, now testing the triangle support zone.
* Support & Resistance:
* Resistance: $278.55 (recent high), followed by $282 breakout target.
* Support: $271.04 (trendline support), with major support at $269.58.
* Indicators:
* MACD: Slight bearish crossover, indicating a possible retest before continuation.
* Stochastic RSI: Overbought but still strong, suggesting high momentum.
Trade Outlook
* Bullish Scenario: A breakout above $278.55 could trigger a move toward $282+.
* Bearish Scenario: A breakdown below $271 could see a test of $269.58 support.
💡 Final Thoughts: JPM is showing signs of institutional interest and could be gearing up for a strong move. Traders should watch for volume confirmation at the breakout level.
🚨 This analysis is for educational purposes only and does not constitute financial advice. 🚨

JPM Technical Analysis and GEX Insights. Feb. 7Technical Analysis (1-hour Chart)
* Trend: JPM has been in a strong ascending channel, with higher highs and higher lows forming a wedge pattern. The price is approaching key resistance levels near $277.50–$280.
* Volume: Increased volume supports the upward movement, but overextension signals potential exhaustion.
* MACD: Momentum is positive but weakening, with the MACD histogram flattening. A crossover might occur, signaling potential reversal or consolidation.
* Stoch RSI: Overbought conditions with Stoch RSI above 97, suggesting a short-term pullback might be imminent.
Gamma Exposure (GEX) Analysis
* Key Levels:
* Call Resistance: $280 (78.51% GEX density) serves as a strong resistance zone, limiting upward potential.
* Put Support: $262.50 (3.65% GEX density) provides significant downside protection.
* Gamma Wall: $275 is acting as a near-term support and resistance level, indicating a critical inflection point.
* Options Flow: Low implied volatility rank (IVR 11.1) suggests reduced premiums. GEX favors calls (positive sentiment), but the small shift in IVX (-0.54%) indicates waning momentum.
Trading Suggestions
* Bullish Setup (Call Options):
* Entry: Above $278 (confirmed breakout of $277.50 resistance).
* Target: $280, $285 (if momentum sustains above GEX walls).
* Stop Loss: $275.
* Bearish Setup (Put Options):
* Entry: Below $275 (breakdown of key GEX wall support).
* Target: $267.50, $262.50 (approaching Put Support).
* Stop Loss: $278.
Probability Changes at Open
* GEX suggests minor upward bias, but price at $277.50–$280 could face resistance.
* Monitor real-time data and volume confirmation at open for direction.
Disclaimer
This analysis is for educational purposes only and does not constitute financial advice. Always perform your own due diligence before trading.

JP Morgan Buy Trade Idea – Targeting a 2:1 Risk–Reward RatioI’m sharing my latest trade for JP Morgan (JPM) based o my system. The setup has already hinted at the take profit level, and here’s why I took the trade:
• Indicator Reasoning:
My indicator combines several factors (VWAP, Daily Open, and momentum metrics) to confirm that current market conditions favor a buy signal. When the buy signal appears, it’s a strong confirmation from the system.
• Stop Loss Placement:
The indicator’s historical analysis gives an average loss value that I use to set my stop loss. This ensures that my risk is controlled based on how the market has previously moved against similar setups.
• Take Profit (TP) Level:
The system also provides an average take profit level derived from prior trades. This is reflected in the current trade idea, ensuring that the target is in line with the historical performance and yielding a risk–reward ratio of 2:1.
• Risk–Reward Ratio (RR 2):
With every unit of risk taken, I aim to secure twice that amount in potential profit. This ratio is central to my strategy and is supported by the average loss and average TP values that have been back-tested.
I’ll continue updating stock ideas as market conditions evolve. Stay tuned for further insights and adjustments as I refine the strategy based on real-time data.
Disclaimer: Trading involves risk. This trade idea is based on my personal analysis and indicator setup, and past performance does not guarantee future results. Please perform your own research before making any trading decisions.

JPM - Biggest bank in the US with good upside potential?Hi guys, we are taking a look into the Biggest US Bank. Recently their catch on and join forces into participating with AI gives a positive up-beat for their business additionally,
JPMorgan Chase continues to solidify its position as a global leader in financial services, showcasing exceptional financial health and a promising outlook. With a well-diversified portfolio and a consistent track record of strong performance, the company is a beacon of stability and growth in the industry.
The leadership at JPMorgan Chase has demonstrated an unwavering commitment to innovation and strategic planning. Their investments in cutting-edge technologies, such as AI-driven solutions and digital banking platforms, position the company to thrive in an increasingly digital economy. Moreover, their proactive approach to sustainable financing and environmental initiatives highlights a commitment to a forward-thinking and socially responsible future.
What stands out most about JPMorgan Chase is its ability to adapt to evolving market dynamics while maintaining robust profitability and delivering value to shareholders. This resilience, combined with their global reach and customer-focused services, ensures they remain at the forefront of the financial industry.
For investors, clients, and partners, JPMorgan Chase represents a secure and dynamic choice, offering both stability and exciting opportunities for growth. The future is undoubtedly bright for this financial powerhouse.
My entry; 238
With a positive target: 285
As always my friends happy trading!
P.S. If you have questions or inquiries about one of my existing set-ups or personal questions / 1 on 1 sessions consider joining my channel so you can follow up with me in private!

The Return Of This Powerful 3 Step Rocket Booster StrategyThe return of the rocket booster
strategy
This 3 step system is the reason
that am popular
here on tradingview.
I have not been talking about it
a lot because i have been
learning new trading strategies.
To protect myself in all types of
financial economies and markets
This strategy is so popular that
i thought it
would get its return
This time its back and its here to
sty if this is your first time
seeing this strategy....
Oh boy prepare yourself because
this strategy
is going to shock the pants
out of you!!
Its the most exciting rollercoaster
ride ever.
Lets dive into it
It has 3 steps:
#1 The price has to be above
the 50 Day Moving
#2 The price has to be above
the 200 Day Moving Average
#3 The price has to gap up
If you watch the pattern on the screen
it's a bullish candle stick pattern
if you want to learn more about
candle stick patterns
then i would encourage you to get
Steve Nisons book on candle stick patterns
Also, the if you look at the
chart NYSE:JPM the momentum
has "bounced" from the bottom
If you want to learn more
rocket boost this post.
Disclaimer: Trading is risky please
learn risk management
and profit-taking strategies.
Also feel free to use a simulation
trading account
before you trade with real money.
