NVDA at Inflection Point: Reclaim $158 or Fade to $150?NVDA at Inflection Point: Reclaim $158 or Fade to $150? Monday Setup Ready 📉📈
🧠 GEX-Based Options Sentiment:
— The $158.71 level is the highest positive GEX zone and aligns with the 2nd CALL Wall. This is the strongest gamma resistance — the level to beat.
— $157.50 is the 3rd CALL Wall (7.99% GEX) and has acted as a ceiling — NVDA is currently pinned underneath.
— Below, $152.50 to $150 forms a GEX magnet zone, where price is likely to gravitate if weakness sets in.
— The $149 HVL zone also aligns with this gamma pocket, making it a strong downside target.
— Implied Volatility Rank (IVR) is very low at 6.8, which makes options cheap — ideal for buying directional calls or puts.
— Call flow shows a moderate bullish lean (5.4%), but nothing extreme. No signs of a major squeeze — yet.
🔧 Options Setup for Monday–Wednesday:
Bullish Trade Idea:
If NVDA breaks and holds above $158, consider buying a CALL debit spread, such as 158c/165c expiring July 3 or July 5.
Target zones would be $160 and $165 based on GEX7 and GEX6.
Stop-loss would be a move back under $157, especially on rising volume.
Bearish Trade Idea:
If NVDA fails to reclaim $157 and breaks below $155, consider a PUT or a PUT debit spread. 155p to 150p (Jul 3 expiry) would be the play.
First target is $152.50, followed by $149.
Stop if price recovers $157.50 with strong bid.
📉 Intraday Technical Breakdown (1H Chart):
The structure shows clear signs of weakening strength.
— NVDA had a confirmed BOS, but now it’s printing a CHoCH just under the trendline and inside a supply zone.
— Price rejected multiple times near $158.
— Volume spiked into the Friday close but did not confirm breakout — more likely to be profit-taking or gamma hedging.
— The short-term trendline has been broken, and bulls are defending the structure weakly.
📌 Key Intraday Levels to Watch:
— $158.71: Gamma ceiling and major supply zone. Break above this can lead to a squeeze.
— $157.00: Local resistance from Friday.
— $155.02: BOS level and key decision point.
— $152.50–150.00: Gamma magnet and thin volume shelf — likely destination if price breaks.
— $149.00: HVL zone and major demand.
✅ Thoughts and Game Plan:
NVDA looks vulnerable to a fade if bulls fail to reclaim $158 early in the session. It has rallied sharply the past week and is now stalling beneath gamma resistance. The CHoCH under trendline shows supply defending. If Monday opens flat or slightly weak and price stays under $157.50, I expect bears to press it toward $152.50 quickly, maybe even $149 by midweek.
But if buyers step up and push a reclaim above $158.71, the next gamma wall is at $160–$165 — that’s where a breakout can accelerate. In that case, the IV being cheap favors buying calls.
Be patient and don’t front-run Monday open. Let price confirm. The best edge here comes from reacting to the key levels — not guessing them.
Disclaimer:
This analysis is for educational purposes only and is not financial advice. Always do your own research, trade your plan, and manage risk accordingly.
NVDA trade ideas

How will NVDA react to the meeting between Canada and USA?Possible Upsides for NVIDIA
Pricing Power & Revenue Buffer
-If Canadian-sourced semiconductors face tariffs, NVIDIA could raise prices across its product line to cover margin impacts—shifting cost to customers.
Accelerated Supply Chain Shifts
-The threat (or reality) of disruptions can drive companies to prioritize U.S. or Taiwan-based supplies, where NVIDIA is deeply integrated, potentially shortening delivery cycles.
Competitive Advantage
-Rivals relying on affected Canadian inputs might see delays or cost increases—NVIDIA could gain market share in both AI datacenter and auto/industrial segments.
Risks & Downsides
Higher Costs for Hardware Buyers
-If tariffs increase the cost of critical components like chips or memory, end-users might delay purchases, potentially reducing NVDA’s sales volume.
Spillover Sentiment Hit on Tech Stocks
-Trade wars often cause broad tech stock sell-offs. As a high-growth leader, NVDA could see increased volatility, even if its business remains strong.
-Disclaimer: This analysis is for informational and educational purposes only and does not constitute financial advice, investment recommendation, or an offer to buy or sell any securities. Stock prices, valuations, and performance metrics are subject to change and may be outdated. Always conduct your own due diligence and consult with a licensed financial advisor before making investment decisions. The information presented may contain inaccuracies and should not be solely relied upon for financial decisions. I am not personally liable for your own losses, this is not financial advise.

NVIDIA"It’s clear that this stock is currently in a strong upward wave and could advance toward wave 5 of 3, targeting the $1,090–$1,350 range. After reaching this zone, it may enter a corrective phase as wave 4, which could bring a pullback to the $150–$250 range. Following that, the stock is expected to resume its main wave 5 rally, with targets between $5,000 and $7,200."

NVIDIA(NVDA) Jackpot – Thief Trading Blueprint for Fast Profits!🚀 NVDA Stock Heist: The Ultimate AI Gold Rush (Scalping/Day Trade Plan)
🌟 Hey there, Market Pirates! 🏴☠️💰
Thieves, Traders, and Money Makers—gather around! Based on the 🔥Thief Trading Style🔥, here’s our master blueprint to loot NVIDIA’s AI-fueled rally. Follow the strategy on the chart—long entry is LIVE! Our escape? Near the high-risk Resistance Zone. Overbought? Consolidation? Reversal trap? Bears are lurking, but we’re stealing profits first! 🎯💸
🎯 Entry (The Vault is Open!)
"Swipe the AI gold at any price—the heist is ON!"
Pro Tip: Use buy limits within 15-30min near swing lows/highs for pullback entries.
🛑 Stop Loss (Thief’s Escape Route)
SL at recent swing low (4H timeframe)—adjust based on your risk & lot size.
Scalpers/Day Traders: Tighten SL if stacking multiple orders.
🏆 Target 🎯: 165.00 (The AI Jackpot!)
📈 Why NVDA?
Bullish momentum from AI dominance, earnings hype, and institutional FOMO.
Tech sector strength + chip demand = THIEF’S PARADISE.
📰 Fundamental Heist Intel
Need macro trends, sentiment, and intermarket analysis? 🔗 Check our bioo for the full robbery toolkit.
⚠️ Trading Alert: News & Position Control
Avoid new trades during earnings/news—volatility kills heists!
Trailing SLs = Locked profits. Don’t get greedy!
💥 Boost This Heist!
👊 Hit "Like" & "Boost" to fuel our next raid. Every click = More stolen profits! 🚀💰
🤑 Stay tuned—more heists coming! NVIDIA today… what’s next? 🤫🐱👤

NVIDIA NVIDIA has tapped the target we setup few weeks ago, now we are waiting for the pullback.
Disclosure: We are part of Trade Nation's Influencer program and receive a monthly fee for using their TradingView charts in our analysis.

$NVDA ONCE IN A LIFETIME RARE Fibonacci HARMONICSNASDAQ:NVDA ONCE IN A LIFETIME RARE Fibonacci HARMONICS
NVDA is the NEW Fibonacci King the completion of the CYPHER was at 88 were I went long!
My Target is now 174 🎯up 200 grand on my account
I will ALERT here on the NEXT PLAY LOW RISK setup (NO CHARGE)
All I ask is DROP A 👍

Long Probably!Hello All. because of No Pre-Cluster, market will reverse on the Node on versa Cluster. be happy(wink)

Triple top pattern failedTemporary postponement of repeat of the 1997 Eastern financial crisis by breaking the previous ceiling
Triple top pattern failed

NVIDA still bouncing in the channel but could 158 be....Let's analyze NVIDIA (NVDA) stock with a focus on your specified parallel channel from November 2023 lows to April 2025, and its current position relative to the channel's middle line.
As of Friday, June 27, 2025, at 10:18:37 PM PDT, here's a breakdown of NVDA:
**Current Price & Performance:**
* **Last Price:** $157.75 (as of 4:00 PM ET on June 27, 2025)
* **Today's Change:** Up $2.66 (1.71%)
* **Previous Close:** $155.09
* **Today's Range:** $155.255 - $158.71 (intraday)
* **52-Week Range:** $86.63 - $158.71 (Today's high is the 52-week high, indicating a strong recent upward push and reaching new all-time highs.)
---
### **Parallel Channel Analysis (Nov 2023 Lows to April 2025)**
A parallel channel is formed by two parallel trendlines that encompass the majority of price action.
* **Uptrend Channel:** Both lines slope upwards.
* **Middle Line:** Often drawn equidistant between the two channel lines, serving as a dynamic support/resistance level.
**Constructing the Channel (Conceptual):**
* **Bottom Line:** Drawn from a significant low in November 2023 (NVDA's 52-week low is $86.63, likely from around that timeframe or slightly later in 2024). This line would connect subsequent higher lows.
* **Top Line:** Drawn parallel to the bottom line, touching the significant highs experienced during the uptrend, extending through April 2025.
**NVIDIA's Trajectory in the Channel:**
NVIDIA has been in a **parabolic uptrend** since late 2023, driven by massive demand for its AI chips. This kind of explosive growth is highly conducive to parallel channel formations, where the price continually moves higher within defined boundaries.
* **From Nov 2023 Lows to April 2025:** NVIDIA experienced a massive rally during this period. The price would have largely stayed contained within a relatively wide, upward-sloping parallel channel.
* It would have likely bounced off the bottom trendline (support) and moved towards the top trendline (resistance) multiple times.
* The middle line would have acted as a pivot point, with the price oscillating above and below it.
**Current Position: "Price is now above the middle line."**
* **Interpretation:** The fact that the price ($157.75) is currently *above* the middle line of this parallel channel (which spanned from Nov 2023 to April 2025) is a **bullish sign**.
* When the price is in the upper half of an upward-sloping parallel channel, it indicates **stronger bullish momentum** within the established trend.
* It suggests that buyers are in control and the stock is likely heading towards the **upper trendline of the channel**, or even attempting a breakout above it, especially given its recent push to new all-time highs.
* The middle line, having been crossed to the upside, now acts as a **dynamic support level**.
---
### **Implied Trend and Next Steps (based on the channel):**
* **Continued Upside:** Being above the middle line suggests a continuation of the upward trajectory within the channel.
* **Targeting Upper Band:** The next logical target for NVDA, within the context of this channel, would be its **upper trendline**. Given NVDA's history of consistently pushing boundaries, it might even test or break above this upper trendline, potentially signaling an acceleration of the trend or a "blow-off top" (though this is not guaranteed).
* **Support:** The middle line of the channel now becomes a key support to watch on any pullbacks. A move back below it would suggest a weakening of immediate momentum or a move back to the lower half of the channel.
---
### **Overall Outlook for NVDA:**
NVIDIA is trading at **all-time highs**, which itself is a testament to its strong bullish trend. The parallel channel analysis reinforces this:
* The fact that the price is **above the middle line** of a multi-month parallel channel (Nov 2023 to April 2025) indicates **significant bullish strength and control by buyers**.
* This suggests **continued upside potential** within the channel, with the upper trendline acting as the next likely resistance/target.
* NVIDIA's fundamentals (AI dominance, strong earnings, innovation) continue to fuel this technical strength.
**Important Note:** While parallel channels are powerful tools, extreme parabolic moves can sometimes lead to channel breaks or sharp corrections. Always combine technical analysis with fundamental understanding, risk management, and your own due diligence. Given NVDA's recent surge, it's also important to consider if the stock is becoming overextended in the short term, even within a strong uptrend.

NVDA LongJust checked this stock which seems very good trade for now. With a flow of good news for the past week about the trade war between China and USA, there is a good possibility for a long trade in here. Also technically, a downtrend line has been broken, and liquidity got swept, so i cant see anything in the way of a long trade in here.
See this marked blue line, thats a down trend that got broken. Now i would be looking for this small gap to be filled and the price testing the downtrend.
Confirm on lower tf if the price would hold this trendline and wont go below it, then make an entry.

NVIDIA AnalysisNASDAQ:NVDA
NVIDIA (NVDA) – Elliott Wave + Fib Confluence Forecast | 2025/26 Outlook
After a textbook falling wedge breakout and bullish retest, NVIDIA is now completing a potential (A)-(B)-(C) correction wave structure. Here's the detailed outlook:
🧠 Technical Structure & Price Zones
The (A) wave may have topped near 159.59, with strong Fib confluence zones (2.618–4.236) and a visible rejection.
A sharp (A) down leg is projected to test the Fib 0.618–0.786 support between 114–102 USD, aligning with a historical demand zone and key structural low.
A corrective (B) bounce could reach up to ~142 USD, which is the 0.618 retracement of the projected fall.
The final (C) wave may target the 1.618 extension around 187–190 USD, suggesting a potential year-end rally if the wave structure unfolds as expected.
These may again align with wave turning points, particularly around July and September 2025.
📊 Fibonacci Clusters
Numerous Fib confluences were detected using the full wave stack (retracements, extensions, projections).
Watch the 121.92 and 142.82 horizontal zones — both are strong Fib overlaps and historical pivot levels.
Blue vertical lines indicate potential turning windows.
📌 Conclusion: A high-probability ABC correction pattern seems to be forming. Once Wave (B) completes, a final impulsive push toward ~190 USD could occur before a larger correction sets in. Monitor macro headlines and price behavior near Fib zones.
💬 Let me know your thoughts below — bullish, bearish, or neutral? Always happy to discuss wave setups!


NVDA is still the leader making new ATHNASDAQ:NVDA is making new highs. When will it stop? A sign of weakness would be a break of my LIS at 142. It’s that simple, if you are long don’t panic sell early. Wait for a sign looking at my levels.

My buy view for NVDAMy buy view for NVDA.
Nvidia has made a significant push up after the meltdown following the new US tariff news.
The push-up is likely cooling off for this baby.
If the current consolidation continues to be sustained by the support zone (TL) in this zone, we are likely to see NVDA rally to $149 and $152 as TP1 and TP2, respectively.
My SL will be around $128.9 zone for both.
RR of 1:4 and 1:4.8
Trade with care

NVIDIA Has more room to raise furtherIs it V-Shape pattern ? If Yes, it's definitely ready to go up and possible to hit 199-200

Nvidia (NVDA) Share Price Soars to Record HighNvidia (NVDA) Share Price Soars to Record High
Yesterday, Nvidia’s (NVDA) share price surged by over 4%, with the following key developments:
→ It broke through the psychological $150 per share level;
→ It reached a new all-time high;
→ It also contributed to the Nasdaq 100 index hitting a record peak, as we reported earlier this morning.
As a result, Nvidia has reclaimed its status as the world’s most valuable company. Demand for its shares is being fuelled by the CEO’s optimism.
“We have many growth opportunities across our company, with AI and robotics the two largest, representing a multitrillion-dollar growth opportunity,” said Jensen Huang at Nvidia’s annual investor conference.
Technical Analysis of the NVDA Chart
The last three candlesticks reflect strong demand, as:
→ There are bullish gaps between the candles;
→ Lower wicks are either absent or minimal;
→ Candles are closing near their highs with progressively widening spreads.
This suggests strong momentum as the price confidently breaks through the key $150 resistance level. It is reasonable to assume that the current imbalance in favour of buyers around the $146–150 area (highlighted in purple) may form a support zone in the event of a pullback — for instance, within the existing upward channel (shown in blue).
This article represents the opinion of the Companies operating under the FXOpen brand only. It is not to be construed as an offer, solicitation, or recommendation with respect to products and services provided by the Companies operating under the FXOpen brand, nor is it to be considered financial advice.

NVDA Breakout Mode! 📈🔥
🚀 Price flying above resistance zone 🟢
🎯 Target: $157.69 | 🔻 Stop: $155.87
⚡ Riding the AI wave with strength! 💡
📊 Chart powered by #ProfittoPath 📈
#NVDA #NVIDIA #AIStocks #BreakoutTrade #TradingView

$NVDA | Fib Expansion Points to $212.81 → Is the AI Supercycle JWaverVanir International LLC | Weekly Fibonacci Roadmap
📅 June 25, 2025 | +7.27% Day | Post-Stock Split Momentum
NVIDIA ( NASDAQ:NVDA ) continues to dominate the AI-driven tech rally. After reclaiming the 1.618 Fibonacci level ($128.35), price has broken above the 0.886 retracement ($146.72) and is now pressing higher with bullish volume.
🧠 Fibonacci Insights:
🔺 1.786 Fib Extension: $207.76
🎯 Primary Target: $212.81 (Golden Projection)
🚀 Long-term Fib targets extend into $250–290+ zone (2.618–3.0 extensions)
🔻 Red trendline below signals well-respected diagonal support since early 2023
📊 Price Outlook:
Current Price: $154.31
Short-term Path: Bullish breakout → $168.21 → $178.43
Next Major Resistance: $212.81
Support to Hold: $139.93 / $128.35 (previous Fib clusters)
🧩 Catalysts Ahead:
Q2 Earnings (Late August 2025) – Focus on AI/data center revenue acceleration.
NVIDIA Blackwell GPU shipments – Institutional uptake will confirm pipeline robustness.
AI Sovereign Demand – U.S., UAE, Singapore and Saudi Arabia investing in GPU infrastructure.
AI Arms Race – Competitive moat widening vs. AMD, Intel.
AI App Ecosystem Expansion – Surge in demand for inferencing chips (L4, L40, GB200).
Post-Stock Split Rotation – Retail inflow and fresh institutional allocations.
📌 Summary:
NVIDIA is not just a chipmaker — it’s the core of the modern AI stack. With clear Fibonacci structure and geopolitical tailwinds, the next target is $212.81. Watch dips into $140s for potential reload zones.
🔖 Hashtags:
#NVDA #NVIDIA #AIstocks #WaverVanir #FibExtension #FibonacciTrading #AIboom #BlackwellGPU #GPUpower #PostSplit #TechLeadership #TradingView #SMC #AIarmsrace

NVDA DECISION TO MAKE watching NVDA on breakdown or failure of breakdown Harmonic. increased volume at double bottom and D PRZ suggests to me this will not breakdown, but i dont think it wont chop away my confidence either. ill just wait for the direction.

Great outlook on NVIA reverse HSNVIDIA (NVDA) showing a reverse head and shoulders (H&S) pattern can be a very bullish technical signal — often implying a trend reversal from bearish to bullish.

Nvidia & Nasdaq History - What you need to know!Record-high share price: NVDA hit a new all-time high as U.S. stock markets rallied and Wall Street analysts forecast continued upside
Nvidia is pushing towards the first ever $4 Trillion market cap.
Today it surpassed MSFT as the largest company in the world closing up over 4% on the session.
Micron earnings are adding extra fuel to the fire for semi conductors.
Short term picture for semis - they're very extended and need some consolidation.
Micron earnings: Revenue: $8.05 billion, up ~38% YoY, beating the ~$7.89 billion consensus
Data‑center revenue: Tripled YoY, powered by surging demand for high‑bandwidth memory (HBM)
HBM sales: Exceeded $1 billion, growing over 50% sequentially
Strong margin and revenue beat; robust cash flow (~$857 million free cash flow) with a solid balance sheet ($9.6 billion in liquidity)


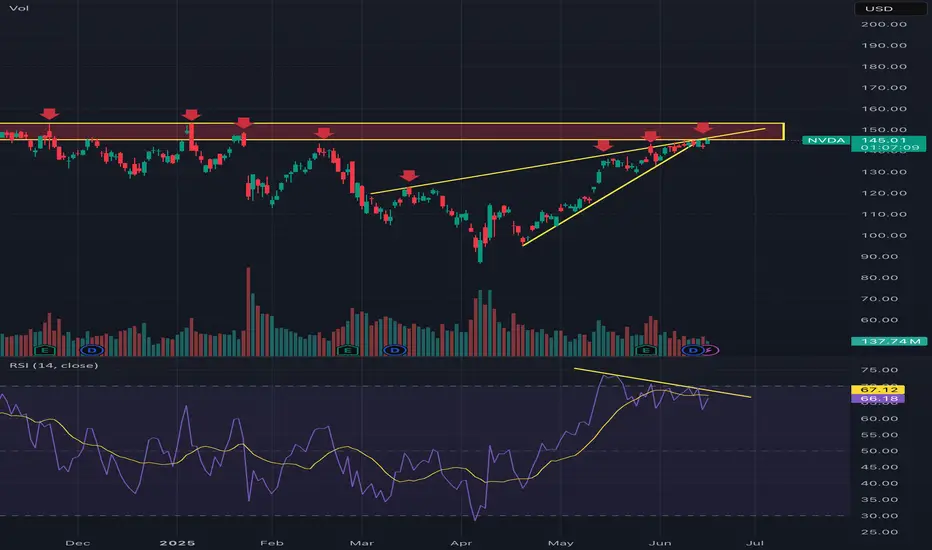
Nvidia into MAJOR resistance This will not be a popular opinion and that’s okay. The charts don’t lie and you can see it is into major resistance, highlighted by all the red arrows when it got rejected. It’s now broken down from a rising wedge which also lines up with said major resistance. I’ve also highlighted bearish RSI divergence, too many factors here for NVDA to keep going up. Could it break through? Of course it could but you have to look at all these factors I’ve highlighted and ask yourself what are the probabilities that it goes down here? High, very high and you want to take trades that put the probabilities in your favor.