UBER Potential for bullish rise | 21th July 2022On the H4, with prices moving above the ichimoku indicator and breaking out of the descending trendline, we have a bullish bias that price would rise from our buy entry at 23.59 where the pullback support is to the take profit at 26.64 in line with swing high resistance. Alternatively, prices could break entry structure and drop to stop loss at 20.16 in line with swing low support, 78.6% fibonacci projection and -27.2% fibonacci expansion.
Any opinions, news, research, analyses, prices, other information, or links to third-party sites contained on this website are provided on an "as-is" basis, as general market commentary, and do not constitute investment advice. The market commentary has not been prepared in accordance with legal requirements designed to promote the independence of investment research, and it is therefore not subject to any prohibition on dealing ahead of dissemination. Although this commentary is not produced by an independent source, FXCM takes all sufficient steps to eliminate or prevent any conflicts of interest arising out of the production and dissemination of this communication. The employees of FXCM commit to acting in the clients' best interests and represent their views without misleading, deceiving, or otherwise impairing the clients' ability to make informed investment decisions. For more information about the FXCM's internal organizational and administrative arrangements for the prevention of conflicts, please refer to the Firms' Managing Conflicts Policy. Please ensure that you read and understand our Full Disclaimer and Liability provision concerning the foregoing Information, which can be accessed on the website.
UBER trade ideas

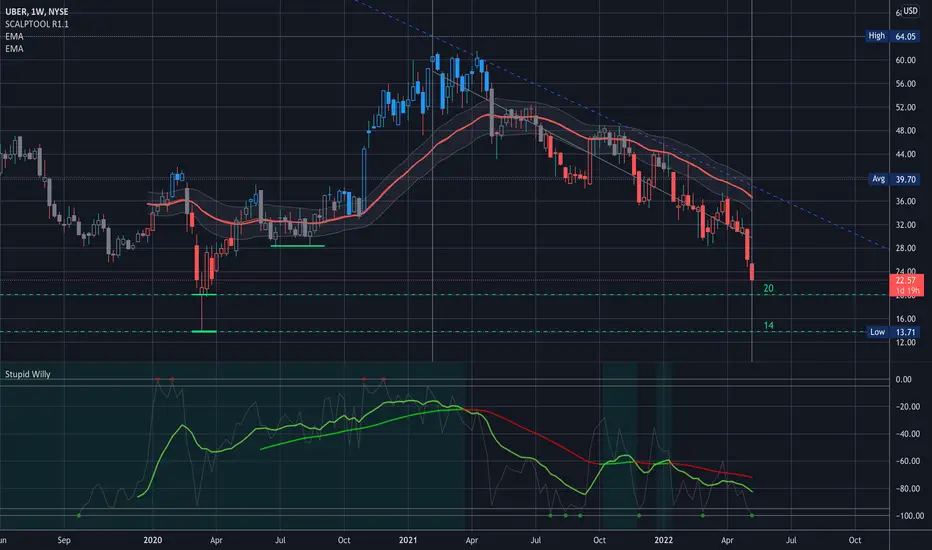
Uber toward hellEverything is going as planned... even the most recent scandal;
Never been this much close to bankruptcy;
Opens at around 12 dollars right after the next E report;
Short as much as you can => you are gonna become rich ;)

The "UBER Files" The Uber Files, first leaked to The Guardian, consists of over 124,000 internal documents that show how UBER attempted to secretly gain support from politicians in Europe, including French president Emmanuel Macron when he was serving as the country’s economy minister, chancellor George Osborne and other ministers, for its aggressive global expansion.
The documents date between 2013 and 2017.
Despite the efforts, UBER is not a profitable company, yet its market cap is 43.868Bil.
If you haven`t shorted UBER here:
On this falling wedge bearish chart pattern i expect to see it go lower, to $13.80, before a technical rebound.
Looking forward to read your opinion about it.

Solid setup for a bear market rally In this video I've shown how UBER is setting up for a handsome bear market rally. Downside risk VS upside reward is very attractive. Also, something I didn't mention in the video is that UBER is a quality company with improving fundamentals so should not be put in the same category as other loss making tech names.
Appreciate your constructive criticism !

$UBER ~ Where's the bottom...As shown in previous update, correction continues and expect lower prices as shown. Possible opportunity soon but not yet. Will be interesting soon and will continue to track closely.

Uber - Downgraded to WreckedUser Select isn't hooking so much these days.
Must be the propensity for Base.
Base Jumping at present seems to provide Uber
with an endless Downtrend.
Lyft.. ugh.
When both cut bonuses to Drivers, it was over.
__________________________________________
Uber Eats, death by 1000 drive-thrus.
All good, Robo Taxis are the primary focus of every
Auto Manu on the Planet.
Even Apple, which remains a software-only iCar Cult
conveyance.
___________________________________________
Giga Texas / Berlin Dumpster Fires continue to rage
unimpeded.
Even Eron admits - BK is the stark reality.
Buy the Transpo Dip?
No.

Uber to bankruptcy ...!!!The news is not still officialized but it soon will be announced.
Entering is not recommended at all. Perfect for shorting however!!!

UBERLONG-TERM: Bullish Bat, Classic Bullish Divergence, Falling Wedge, Bullish Engulfing Candle. (not financial advice)

UBER to $75 per share Hoping for price to dip to $10-$13 per share - long term upside targets of $50, $75, then $100-$120


$UBER - Could see $28Uber has been in down trend channel. In recent couple of trading session it has been unable to break above $24 and stay above it. I believe it is about to break above $24 and head towards $28.
$28 is the resistance area where upper trend channel meets the prior support level.
Target 1 - $28
Target 2 - $37
Not an investment advice.

Uber: A Robust Platform Ripe For Future AcquisitionIntroduction and Thesis
Uber (NYSE: UBER) is a large cap, ride-share company that operates in over 63 countries serving over 110 million users. The company is most commonly known for its ride-share and food delivery services. UBER’s on-demand technology platform could eventually be used for the commercialization of autonomous vehicles. Their tech system includes the ability to track a driver in real time as well as an integrated payments experience (10+ payment options). With UBER’s well-known name, extensive worldwide reach, leading technology, and growth potential the company can serve as an attractive acquisition for leading tech companies
Platform Potential
UBER has attempted to develop its own autonomous vehicle. The company, however faced various obstacles in R & D and sold its research division to Aurora (an autonomous vehicle tech company). UBER’s impressive platform could serve as an invaluable asset to the top autonomous vehicle players. Although Alphabet Inc. (NYSE: GOOG) has abandoned it’s autonomous vehicle production, it has already invested $250 million into Uber and a total of 1.1 billion in the promotion of self-driving vehicles. GOOG’s acquisition history includes approximately 232 companies. The company is a strong supporter of autonomous vehicles and an acquisition of UBER is a strong possibility.
The first generation of autonomous vehicles will undoubtedly need close monitoring and testing when first released. All trips will not be autonomous capable and a ride-share platform will be needed in order to fulfill rides that will need a driver. Uber announced they will provide up to 50,000 fully electric Tesla vehicles available for drivers to rent by 2023. Conversion of inventory to electric power combined with their 110 million user base creates an attractive buying opportunity for leading tech company Tesla Inc. (NYSE: TESLA).
JOBY Aviation (NYSE: JOBY) has already purchased UBER’s air taxi service Uber Elevate. Leading autonomous vehicle companies will need a platform in promotion of products and expansion. In the past, Uber has leveraged its platform assets (drivers and consumer users) to find new sources of value for its platform and the stakeholders who are part of it. Eventually, I believe it’s platform will be of unmatched value and leading tech companies will consider acquiring the company as a whole.
Buy Out Benefits and Risks
There are benefits to shareholders when a company is bought out. When the company is bought, it can cause an increase in the share price. The acquiring company can offer a premium price to entice the target company to sell. Once the announcement is made, there can be an increase of traders to purchase at the offered price which can increase the stock's value. You may also keep in mind the price of the stock may fluctuate based on rumors regarding the progress of the buyout or any difficulties within the deal process. This encourages volatility and higher risk. Acquiring companies also have the option to rescind their offer, shareholders may not support the deal, or securities regulators may not allow the deal. In general, during a buy out the stock price of the target company tends to spike and shareholders can benefit from this transaction.
Growth and Future Outlook
UBER faced a decline in sales during the pandemic shelter-in-place orders. Mobility was reduced resulting in plummeting sales for rideshare companies. UBER has however, made a healthy recovery and has maintained steady growth. Sales have been gradually recovering since April 2020. The company’s revenue for the quarter ending December 31, 2021 was 5.778B, a 82.56% increase YoY. Adjusted EBITDA for Q4 2021 was $74.7 million. In Q1 2022 revenue grew 136% YoY to $6.9 billion. Q1 2022 Adjusted EBITDA was $168 million, a $527 million increase YoY. Despite pandemic restraints, they have managed to grow to over 10,000 cities in roughly 72 countries by the end of 2021. The company has also expanded its business model by including delivery services (Uber Eats), and matching carriers to shippers (Uber Freight). They have also diversified their mobility business by expanding into car rentals, incorporating healthcare related travel and adding other modes of transport like taxis, tuk rentals, and motorcycles. Their platform, technology, and large consumer base provide strong future growth potential.
Valuation
The company is currently not profitable with an EPS of -0.28. Although the company is losing revenue it is still valued at over 50 billion dollars. Losses were attributed to a 5.6 billion headwind related to the company's equity investments. These included losses related to Uber's sell off to Grab, Aurora, and Didi. Despite these losses UBER has managed to almost double revenue YoY. Revenue growth was driven by their delivery service, freight service, and expansion of ride sharing services. Share price is currently considered undervalued.
Risks
The company has been facing driver shortages which can affect revenue and company efficiency. Drivers are a key part of UBER’s business model and reported high gas prices has made it difficult for drivers to maintain a living. This however, illuminates the autonomous vehicle potential in increasing growth and efficiency for ride-sharing companies.
UBER has strong competition, Lyft being one of its main competitors. Lyft does carry the potential to out-innovate UBER. However, I believe UBER’s established reputation along with extensive worldwide reach cannot compare to Lyft. UBER operates worldwide while Lyft only operates in the US and Canada. If Lyft were to outrank UBER, it may take a very long time.
Summary
Uber's diversification, operational efficiencies, and expanded business model has allowed for significant growth and increased revenue. Although currently not profitable I believe UBER has high growth potential in the coming years. Tech companies will need platforms in order to successfully integrate autonomous vehicles and rideshare company acquisitions could be a very strong possibility. For these reasons I rate UBER a buy.
Disclosure: I/we have no stock, option or similar derivative position in any of the companies mentioned, and no plans to initiate any such positions within the next 72 hours. I wrote this article myself, and it expresses my own opinions. I have no business relationship with any company whose stock is mentioned in this article. I am not a financial advisor and this is for educational purposes only.

UBER To Test Pandemic LowsIn this update we review the recent price action in UBER and identify the next high probability trading opportunities and price objectives to target


Candle Dropped below trendlineWe had a candle body break below a five-month trendline today. I'll be looking for a continuation tomorrow. Could see a drop-down to $19.70

$UBER Analysis, Key Levels, & Targets… $UBER Analysis, Key Levels, & Targets…
I’m not going to lie… this is NOT the most beautiful chart in the world… but I’m interested in buying UBER at these levels…
Uber has taken over an entire industry and keeps expanding into new opportunities to generate revenue… This is on my list for no matter what happens…. I feel like this is a company that will be around in 50 years… I sold 21 puts for this week...
I want to hear your ideas and, also, what stocks are you guys seeing that are at interesting levels…. I’m really starting to get bullish on a lot of things. Yes… lots of companies will and are going under, but what do you think will stay??
Best of luck and have fun, y’all…
Risky stock in dynamic supportAfter a bloody downtrend, Uber is now oversold and have reached a dynamic support.

$UBER with a Bullish outlook following its earnings #Stocks The PEAD projected a Bullish outlook for $UBER after a Negative Under reaction following its earnings release placing the stock in drift D.

UBER Selloff leads towards 20$ Uber selloff leadus towards 20$.SellOff accelerate after support line broken and it may take us towards 15$.

UBER Might See More Downsides UBER has provided us with a nice curved trend line (in white) with the last touch going to be aligned with 2.618 which is comparable to a previous drop in 2020
Interesting daily chart

UBER Strong Support AreaIf you haven`t sold UBER on this bearish call:
Then you should know that even if they released an extremely bullish guidance for Q2, higher than the estimates, it could face the same problems as LYFT, spend more on driver incentives, and they won`t deliver the expected results.
My price target is the $26.50 support.
Looking forward to read your opinion about it.

UBER looks vulnerable after LYFT last night. Big UBER support level needs to hold. LYFT got hammered so is the bad news now priced in? Anything positive should see a bounce for LYFT. I have just bought some LYFT for a quick bounce but remain bearish longer term. $UBER $LYFT

$UBER on 15min Potential CUP and Handle Pattern in extended$UBER on 15min Potential CUP and Handle Pattern in extended
Please note: Earnings May 4th
What are your thoughts?
Thanks,
Kelly
