UBER trade ideas

Uber on his way to change the trend in daily to became bullishUber has a good configuration to change the bearish trend, but we need to wait next week to see :
Prices : As we can see the first tentative to cross the cloud by the price was failed, and now we wait for the second one: resistance at 45.60.
The chinkou is bullish but we need to wait until he cross the cloud (it s possible because the cloud is titled)
Tenken has crossed the kijun (which is a good signal) , the confirmation can happened when he break the resistance at 45.6
The last candle is a good reversal signal

Uber : Wait for a moment to buyIn daily the trend is still bearish but there are goods signs to change this trend.but for me it is not yet a moment to buy and I suggest to wait for the breaking by the price the SSB (46,26) and the chinkou cross the cloud

Uber AnalysisUber looks to have broken out of it falling wedge that had been developing on the weekly chart. The MACD has made a cross signaling a possible upward trend getting ready to take place. RSI made a complete retracement but did not completely reach the oversold boundary before beginning its way back up. Uber is signaling that it may be making a new trend to previous highs or break higher.

UBER - LongBuying UBER calls tomorrow - Nov 7 if conditions still right. Ideally will be looking for an entry on 5M timeframe.

Ascending wedge... *Not financial advice, just an idea.
Ascending wedge, breakout expected, 1,2,3 is the lucky charm

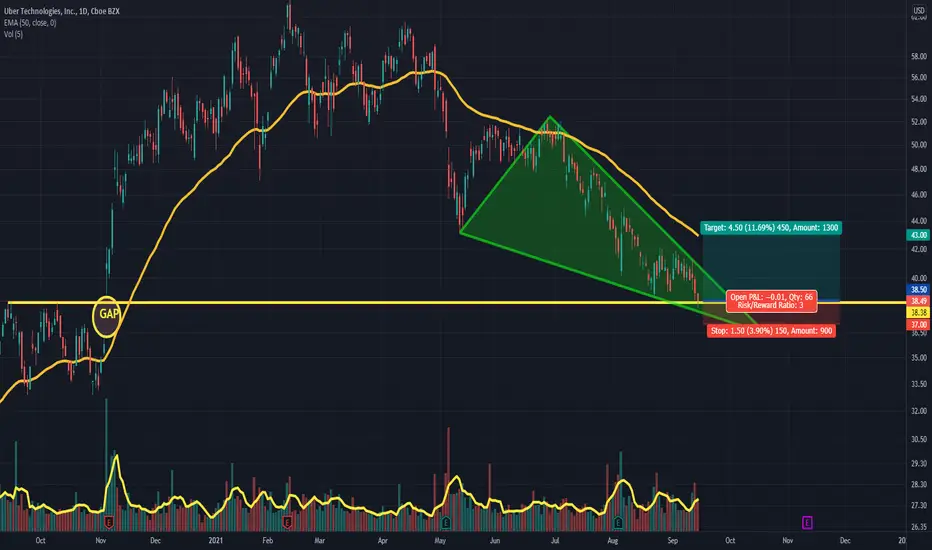
Gap Fill IncomingBecoming overbought in the daily and weekly.
I'll hang back for a retest of the resent low.
This is my opinion.

UBER ON GOOD RALLYGood Volume number on D1
Price respect trendline on D1
Current touched trendline
break and retest

UBER breaking outUBER looks strong at this point
Made a bullish flag on the daily chart, hold well through red overall market
Weekly chart: breaking out from the wedge
MACD, RSI - positive
Volume is slightly above average
Target: 60
Stop loss: 43.70

UBER generational opportunityUber is today at the same price level prior to the crash of March 2020. Incentives to drivers pressures last quarterly results, but in September unemployment benefitis will end. Along with this, the sustained growth of Uber Eats, make this a unique opportunity. Just picking up this year's highs is 45% upside, with short-term risks but strong support so far.

strategy for UBER Wednesday 09/29/2021(UBER buy price 47.60)
(UBER sell price 45.60)
strategy: uber with reversal pattern we only enter to buy when it touches the buy price, not to anticipate the entry above the closing price. with wide movement up to mv 200 daily shart.
bearish entry: in this case if the open is below the sell price, uber will be within a divergence 5mn bearish 15mn bullish anyway we have to wait for it to retest towards mv 9 or 10 period on the 5mn chart.

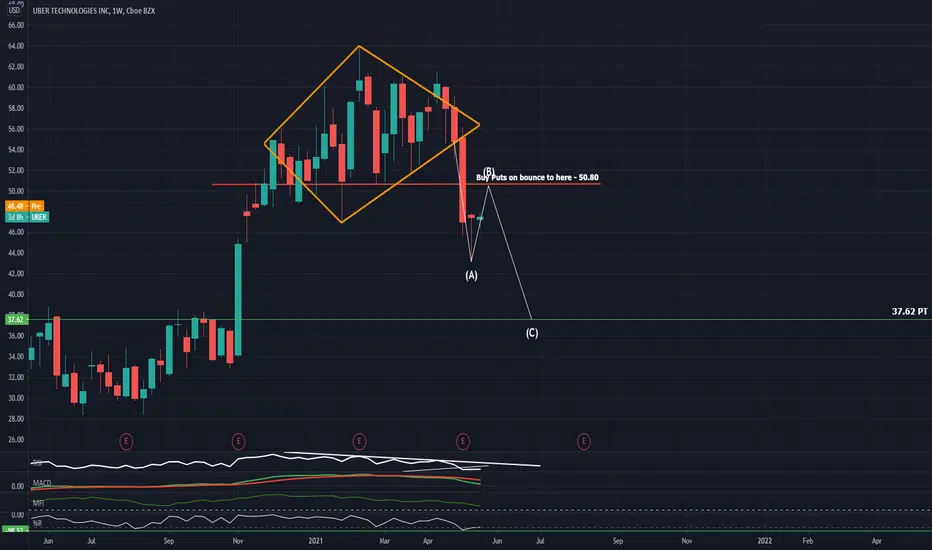
UBER Bearish ABCD Currently watchin UBER, I am aware that an ABCD pattern could not play out but its my educated guess.
I did two scenarios even though we could have others, fist scenario would be:
.5 fib to 2 fib levels which is label in orange
the next scenario
.618 fib to 1.618 fib levels which are label in white
Could be a long play and just waiting confirmation

UBER - Accumulation and wedge breakoutAccumulation and wedge breakouts:
Solid value zone around $40 but be sure to take profits into the VPOC. This could become a monthly bull flag, no harm in holding some for the longer term oriented.
Follow for AVD intraday analysis!

UBER Can Ride To On Bullish Reversal (M Patterns Formed)Traders,
Uber has been falling down and has not completed an M pattern. There is an extended version of the M pattern available below where we have better FCP Buy Zone. If the upper FCP (Fibonacci Confluence Zone) gives a breakout we can initiate a position and if and when it comes down to the lower FCP zone we can add the position.
Targets are market in white horizontal lines.
Rules:
1. Never trade too much
2. Never trade without a confirmation
3. Never rely on signals, do your own analysis and research too
✅ If you found this idea useful, hit the like button, subscribe and share it in other trading forums.
✅ Follow me for future ideas, trade set ups and the updates of this analysis
✅ Don't hesitate to share your ideas, comments, opinions and questions.
Take care and trade well
-Vik
____________________________________________________
📌 DISCLAIMER
The content on this analysis is subject to change at any time without notice, and is provided for the sole purpose of education only.
Not a financial advice or signal. Please make your own independent investment decisions.
____________________________________________________

UBER [LONG] A lot of great indicators firing for UBER on the daily and weekly.
Looks a great LONG entry, with divergences, support and heavily oversold levels.
As always prepared for further downside if it comes.
** NOT Financial or Investing advice **

Analyzing My Part Time Employer - UBERNYSE:UBER
Is a great way to make money part time, especially if you can do it to invest that money in to the market.
Why do I do Uber?
That's simple... I do not trade with money I cannot afford to lose. I love investing but I also love paying my debts. Unlike China... ok that was pretty weak.
Anyway... This demonstrates buying the wrong break out and what can happen if you are caught in that zone. The strength looks good with a massive upside especially in an economy where work culture is beginning to shift dramatically and the gig economy is becoming more of a household choice rather than a regular side job.
I am long on $UBER as long as regulations stay in favor of the gig economy, but is imperative that we break above our upper wedge resistance for a more sustained breakout move.

Does Uber waiting for us at the support level?reversal pattern in 5-minute chart:
Market Cap: 72b
Shares Outstanding: 1.8B
Average Trading Volume (10 days):21M
Shares Short: 79.5M
Short Interest(%): 5%
Days to cover: 3.8
Change in Short Interest:+5%
Ownership Breakdown:
Institutions:
General Public:
Hedge Funds:
Individual insiders:
Sum:
Option profile:
Total OI: 2.2M
Put Call Ratio:0.34
Put OI:
Call OI:
Highest Put:50
Highest Call:45
Max Pain: 43
Open Int (30-Day): 2.2M
DISCLAIMER
I’m not a certified financial planner/advisor nor a certified financial analyst nor an economist nor a CPA nor an accountant nor a lawyer. I’m not a finance professional through formal education. The contents on this site are for informational purposes only and do not constitute financial, accounting, or legal advice. I can’t promise that the information shared on my posts is appropriate for you or anyone else. By using this site, you agree to hold me harmless from any ramifications, financial or otherwise, that occur to you as a result of acting on information found on this site.
Uber: Pre-market running. Gap fill or trend up?Uber resisted recent market sentiment and stayed green at the end of the day. Now, it's up with a 5% lead after some good news.
Now, as a day trade, I'm looking for a gap fill down to buy the bottom or a slow trend up.
The yellow lines are s/r from weekly lines. These can be key supports and predictably the first line it will test if we see a downwards motion on open.

UBER be ready to buy Uber at four hours
As part of the formation of the falling wedge pattern, which is a positive model
We note that the high trading volumes at the bottoms (there is a buyer at the bottoms only)
We also note the "positive deviation of prices with the MACD
The closing is above the (decreasing) resistance 40.00 buy for a target 44.93

A good level for buying UBERThe price of UBER is now at the level of the former resistance, which now acts as support (mirror level).
In addition, the price is also at the 1.618 expansion level from the first wave of the downward movement.
The short takeaway, which was formed in the local accumulation, also acts in favor of the purchase.
You can buy with a small stop at 38 (-5%) and a target at 48 ($19.8)

UBER Daily TimeframeSNIPER STRATEGY
This magical strategy works like a clock on almost any charts
Although I have to say it can’t predict pullbacks, so I do not suggest this strategy for leverage trading.
It will not give you the whole wave like any other strategy out there but it will give you huge part of the wave.
The best timeframe for this strategy is Daily, Weekly and Monthly however it can work any timeframe above three minutes.
Start believing in this strategy because it will reward believers with huge profit.
There is a lot more about this strategy.
It can predict and also it can give you almost exact buy or sell time on the spot.
I am developing it even more so stay tuned and start to follow me for more signals and forecasts.

$UBER Bears looking for a ride Lower 👇
Hopefully you find the chart helpful in terms of Supports & Resistance etc.
we refrain from adding commentary on the chart as that is reserved for our members and we are very conscious of not giving financial or trading advice.
Thank you for taking time to consult our chart and we would really appreciate a like, follow or comment.
