AMAT trade ideas
AMAT may stage a minor reboundWith positive divergence seen on its MACD and RSI, the stock may see a bounce next.

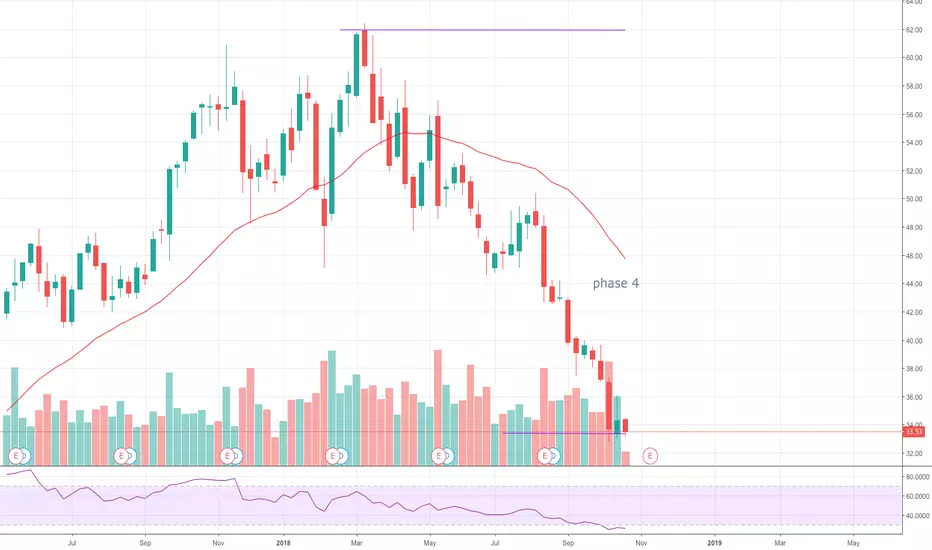
[AMAT] phase 4: Don't buy!Phase 4 in NASDAQ:AMAT . El price is so low in comparison to the MM30. The RSI is low too.


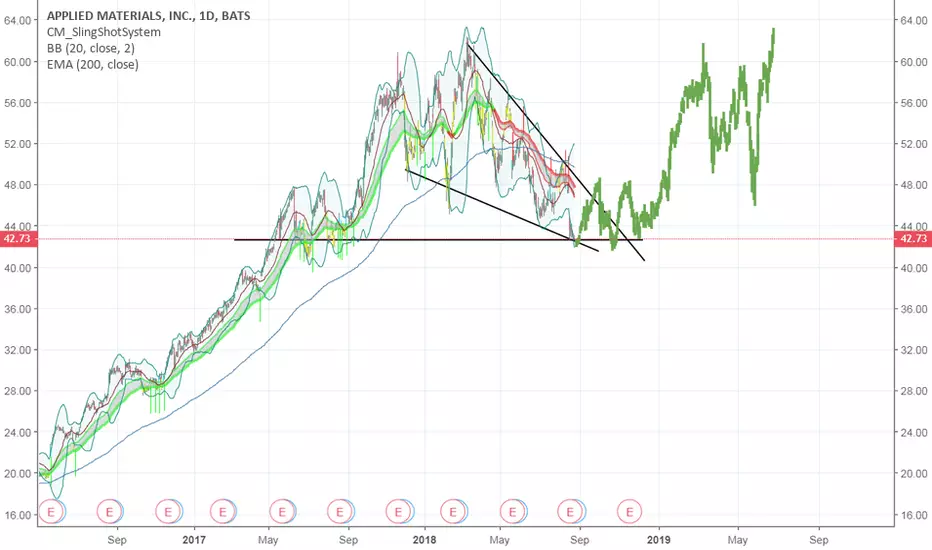
I took a shot on $AMAT ... See why!SO i like the morning star reversal candlestick pattern forming at previous support dating back to 04/13/17, and the recent crossover on the stoch. Tight Stop in place. #GLTA


New Strategy. Looking for Good dividend paying stocks on top of my oversold stocks that have been performing well this year but have pulled back to the 200day ema. If you look at the weekly charts instead of the daily, it is possible that this stock could fall into the 30$ range. Up potential of 40% with dividends to collect.
AMAT: Bull Flag?AMAT is currently setting up in a Bull Flag on the weekly chart time frame.
The Flag pole here is about $50 in length and so any Flag breakout could be expected to extend by that order of magnitude.
Watch the weekly chart Flaf trend lines for any new breakout.


Could We See A Pull Back In AMAT Before Retracement?Looking at the weekly chart, it appears we are hitting resistance at the 23.6% retracement level. RSI is flat and MACD isn't showing strong momentum, so for now, I am waiting for the pull back.
If this fails to break, we will look to retest support around $45 before this thing is ready to retest ATH near $62.
Will wait for confirmation higher/lower before entering JAN 2019 long call position


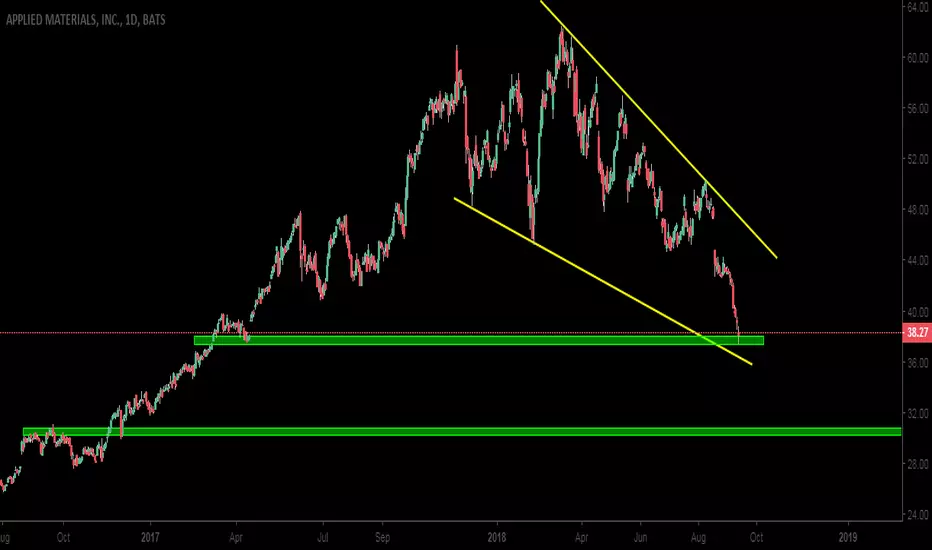
AMAT technical and fundamental pitchAMAT has been forming a falling wedge pattern. A falling edge pattern is a bullish chart pattern, therefore it could signal that AMAT is currently consolidating and investors can expect a continuation in AMAT's long term bullish trend . Furthermore, the divergence between the MACD and Stochastic indicators (moving upwards) and the price of AMAT (moving downward), could suggest an upcoming rally as the MACD and Stochastic are leading indicators. Moreover, short interest has decreased from 18,299,338 to 15,061,436 in the past month, suggesting bearish sentiment has been faltering. All this suggests an upward movement in price, which would cause an upward breakout from the falling wedge .
Fundamental:
AMAT has been able to consistently meet and beat analyst expectations for the past billion years, maintain a strong balance sheet and constantly remain dynamically efficient by innovating and creating cutting -edge technology. However, growing tension between the USA and China has resulted in AMAT's price falling recently, despite little change in the company's underlying intrinsic value. Therefore, anyone with at least 2 brain cells should be able to see that AMAT is trading at an absolute steal right now, with my invaluable buy stamp of approval.
Price Target:
The price target should be the initial height of the falling wedge added onto the price in which the breakout begins to occur. If AMAT breaks out of the wedge , a price target of roughly $64.00 is reasonable.

AMAT: The technical and fundamental pitchTechnical:
AMAT has been forming a falling wedge pattern. A falling edge pattern is a bullish chart pattern, therefore it could signal that AMAT is currently consolidating and investors can expect a continuation in AMAT's long term bullish trend. Furthermore, the divergence between the MACD and Stochastic indicators (moving upwards) and the price of AMAT (moving downward), could suggest an upcoming rally as the MACD and Stochastic are leading indicators. Moreover, short interest has decreased from 18,299,338 to 15,061,436 in the past month, suggesting bearish sentiment has been faltering. All this suggests an upward movement in price, which would cause an upward breakout from the falling wedge.
Fundamental:
AMAT has been able to consistently meet and beat analyst expectations for the past billion years, maintain a strong balance sheet and constantly remain dynamically efficient by innovating and creating cutting -edge technology. However, growing tension between the USA and China has resulted in AMAT's price falling recently, despite little change in the company's underlying intrinsic value. Therefore, anyone with at least 2 brain cells should be able to see that AMAT is trading at an absolute steal right now, with my invaluable buy stamp of approval.
Price Target:
The price target should be the initial height of the falling wedge added onto the price in which the breakout begins to occur. If AMAT breaks out of the wedge, a price target of roughly $64.00 is reasonable.

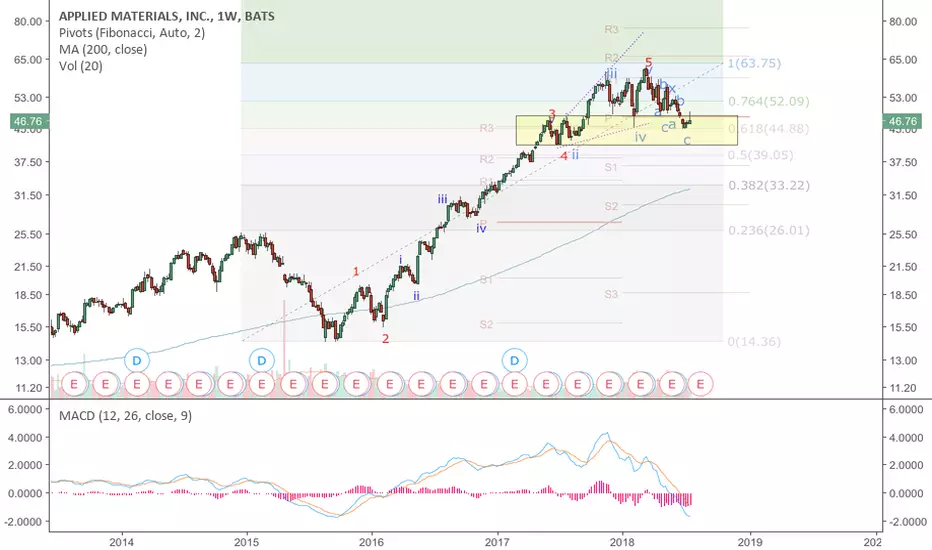
Trying to get a sense of AMAT on the MonthlyPrimary Waves and a decent Fib Retracement... maybe. I'm not much of a fib guy. Usually looking for mechanical entries for short term option trades or very long calls, where the monthly really does wonders working with TTM.

AMAT Long Term TradeAMAT in a nice distribution phase. Buy low sell high. Stop below the 100SMA on the weekly, looks delicious.
One could also look to Sell some put options down here or buy call options 3+ months should be fine on this one.

AMAT: Is the post wave 5 correction over? So far only about 38.2% retracement. MACD appears to be bottoming. Entering strong support.

AMAT - Buy Target 50 . This will go to 50 and hopefully go to 52 and higher looking at weekly chart. Keep an eye.

