Amazon Consolidating on Support to $365Amazon checked back into support today. If you want it, this is the area to buy it. Target $365.
Nasdaq Industrial also checked support today, so pretty likely AMZN will hold and rise along with INDS.
Good luck!
AMZN trade ideas

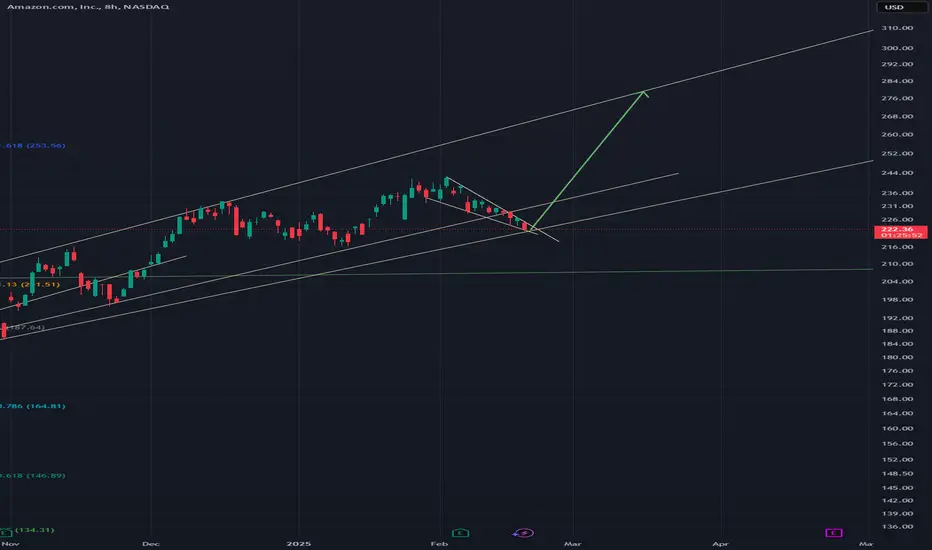
AMAZON Excellent buy opportunity for a new ATH.Last time we looked at Amazon Inc. (AMZN) was three months ago (November 13 2024, see chart below), giving a pull-back buy signal:
The price action couldn't have followed this more accurately as after a short-term pull-back, the stock hit our $240.00 Target at the end of January.
Since then the price started to pull-back again to a point where this week it broke below its 1D MA50 (blue trend-line) for the first time since September 11 2024. With the 1D RSI on the 40.00 mark, this pull-back resembles the April 25 2024 Low, made near the 0.5 Fibonacci retracement level.
We expect a similar medium-term rebound to start towards the 1.236 Fibonacci extension. Our Target is marginally below it at $252.50.
-------------------------------------------------------------------------------
** Please LIKE 👍, FOLLOW ✅, SHARE 🙌 and COMMENT ✍ if you enjoy this idea! Also share your ideas and charts in the comments section below! This is best way to keep it relevant, support us, keep the content here free and allow the idea to reach as many people as possible. **
-------------------------------------------------------------------------------
💸💸💸💸💸💸
👇 👇 👇 👇 👇 👇

AMZN 2-21🔥 Market Overview:
Trend: Bearish; consistent lower highs and lower lows.
Key Levels:
Resistance: $225.50, $228.00.
Support: $222.00, $219.50.
Indicators:
MACD: Weak bullish crossover, suggesting a potential short-term bounce.
RSI: 57.61, neutral but approaching overbought conditions.
Supertrend: Bearish, confirming downward pressure.
🔥 Scalping Strategy:
🩸 1. Momentum Scalping
Buy near: $222.50, targeting $225.00 (+1.1%).
Sell near: $225.50, targeting $223.50 (-0.9%).
Stop-loss: Below $221.50.
🩸 2. EMA Pullback Scalping
Buy near: $222.50 (EMA 9), targeting $224.50 (+0.9%).
Sell near: $225.50, targeting $222.50 (-1.3%).
Stop-loss: Below $221.00.
🩸 3. Breakout Scalping
If $225.50 breaks, enter long toward $228.00 (+1.1%).
If $222.00 fails, short toward $219.50 (-1.1%).
🔥 Mid-Term Trend Forecast (1-3 Weeks):
If price holds above $222.00, expect a short-term bounce toward $228.00.
If it breaks below $219.50, bearish continuation is likely.
The downtrend remains intact until a higher low is formed.
🔥 News & Market Context:
Amazon continues trading in a downtrend, showing signs of a potential short-term reversal.
Broader market weakness is pressuring tech stocks.
No major catalysts, meaning technical levels dominate trading action.
🔥 Decision:
🩸 Short-term: Scalping between $222–$225.50 is the best strategy.
🩸 Mid-term: Bearish unless $225.50 is reclaimed.
🩸 Ideal Play: Trade with tight stops; avoid chasing moves.
👑 Final Verdict:
Weak hands panic. Strong hands execute with precision.
🔥 LucanInvestor:
"Control risk, master the trade. Everything else is noise."

Amazon in now Net-Short on the Regression BreakAmazon has broken the uptrend - many of the other Mag-7 are also on a short footing.
I am considering this trade but I am not sure it is the best option at the moment

Amazon is about seem summer growth shoots againWhy? Because my crystal TA balls say so.
Seriously though, here is my reasoning, given the indicator momentum
Price Action & Trend Analysis
• The stock is currently at $222.42, down -1.86%.
• The price recently broke down from a local high near $244 and is in a downtrend.
• Break of Structure (BoS) and Change of Character (CHoCH) labels indicate trend shifts.
• A weak resistance zone around $244 suggests prior buying exhaustion.
• A demand/support zone appears near $218, with previous price reactions in this range.
Momentum Indicators (Lower Panel)
• The stochastic-based oscillator in the lower panel shows oversold conditions (~below 20 level).
• Previous rebounds occurred at similar oversold levels, suggesting a potential bounce.
• Multiple purple downward arrows (sell pressure) have recently printed, aligning with declining momentum.
Short-Term Outlook (Next Few Days)
• Bullish Case: If support at $218-$220 holds, a relief bounce could push prices towards $226-$230 (~50% retracement of the drop).
• Bearish Case: A break below $218 could accelerate downside momentum towards $210-$212.
Now - let’s talk Probabilities:
• Bounce towards $226-$230: ~60% if support holds. This is the more prevailing wind in my view.
• Further drop to $210-$212: ~40% if selling is strong.
Summary & Trading Plan
• Short-term traders: Watch $218-$220 support for a bounce trade to $226-$230.
• Swing traders: A breakout above $230 strengthens a bullish case towards $240+.
• Risk Management: A clear break below $218 suggests a potential breakdown towards $210-$212.

To 300 we goBuckle up we are moving fast. 3T lets go. and thats not even that much. Amazon will go to 20T with nuclear energy, aws bedrock renting of h100s, prime expansions into europe asia and africa.
Put Option setup for AMZN Open range breakout for the 15 min orb probably looking for at 80-100% return

AMZN shortsI had posted this trade idea last week and now its almost at TP. Bearish OF and we can see clear rejection from H4 SIBI and then price just trended lower to take out that wick from earnings.

Amazon scalping + forecast (2-19)🔥 Market Overview:
Trend: Short-term bearish; long-term consolidation after an uptrend.
Key Levels:
Resistance: $230.46 (EMA 200), $232.50.
Support: $225.50 (EMA 9), $223.00.
Indicators:
MACD: Weak bullish crossover, but still below zero—momentum is not strong.
RSI: 56.46, showing slight bullish divergence.
Supertrend: Bearish zone, confirming downward momentum.
🔥 Scalping Strategy:
🩸 1. Breakout Scalping
Buy near: $226.50, targeting $229.00.
Sell near: $230.00, targeting $225.00.
Stop-loss: Below $224.50.
🩸 2. EMA Pullback Scalping
Buy near: $225.50 (EMA 9), targeting $228.50.
Sell near: $230.50 (EMA 200), targeting $227.00.
Stop-loss: Below $224.00.
🩸 3. Range Scalping
If price stays between $225.50 and $230.00, trade bounces off support/resistance.
🔥 Mid-Term Trend Forecast (1-3 Weeks):
If $230.50 breaks, expect a run toward $235+.
If $225.50 fails, expect a drop to $220.
Sideways movement likely unless a strong breakout occurs.
🔥 News & Market Context:
No major earnings or macro events—price action is technical.
Overall market sentiment remains neutral-to-bearish.
🔥 Decision:
🩸 Short-term: Scalping opportunities exist in the $225–$230 range.
🩸 Mid-term: Watch for a breakout confirmation.
🩸 Ideal Play: Trade within the range; wait for strong confirmation for a swing move.
👑 Final Verdict:
Discipline wins the game. Weak traders chase, strong traders position. If the price confirms direction, enter with confidence—otherwise, patience is power.
🔥 LucanInvestor’s :
"Markets don’t reward hesitation. Make your move or step aside—there is no middle ground."

AMZN: Buy ideaOn AMZN we have a big probability of buying if only if we have the breakout with force the vwap and the resistance line by the buyers.

AMZN Trading AnalysisLong Positions:
Initiate long positions at three key support levels:
Buy at 228 with a profit target of 232.
Buy at 223 with a profit target of 235.
Buy at 213 with a profit target of 241.
Strategy Overview:
This approach is designed to capture an upward move by entering at progressively lower support levels and setting corresponding profit targets as resistance levels. The staggered entry allows for averaging the entry price and optimizing the exit points.
Risk Management:
Implementing proper stop loss levels is essential to manage potential risks effectively. Adjust position sizes in line with market volatility and your personal risk tolerance to minimize losses.
Disclaimer:
This analysis is for informational purposes only and does not constitute investment advice. Trading in financial markets involves risks and may result in losses. It is recommended to conduct your own analysis and consult with a financial advisor before making any investment decisions.

Amazon (AMZN) Stock Analysis & ForecastAmazon (AMZN) Stock Analysis & Forecast
The U.S. stock market has experienced a notable downturn recently, and Amazon (NASDAQ: AMZN) is no exception. Currently trading at $228, I am closely monitoring the stock for a potential pullback to $220, where I plan to enter.
Entry Strategy
My entry point of $220 is based on a confluence of key technical levels:
An ascending trendline indicating ongoing bullish momentum.
A horizontal support level, reinforcing this area as a strong demand zone.
Target & Exit Strategy
If fundamental catalysts align in my favor, my price target (TP) will be the all-time high (ATH) zone around $240, with the potential to extend beyond.
As always, risk management remains a priority—trade cautiously and adapt to market conditions.

AMAZON: Good results and in the 61.8% Fibonacci zone! Pay attentAmazon presented results on February 7th, beating expectations driven by the cloud business.
AWS stands out with a growth of +19%, a pace that it has maintained for 3 consecutive quarters. Revenues on the online platform grow +8%, advertising +18% and third-party services +9%. Efficiency measures and the greater growth of AWS and advertising, with higher margins, boost EBIT +60.5% with a margin improvement of +350 bp to 11.3%.
AI will continue to be a growth factor in 2025 after the alliance with Anthropic and new AI applications. But the guidance for 1Q25 is disappointing, indicating that Amazon remains cautious in an environment of uncertainty due to the impact of tariffs on China (25% of its online sales are of Chinese products) and adverse effects due to exchange rates. Despite a weaker than expected 1Q25, we remain positive on the stock.
The advertising business is growing at a good pace and Amazon is already the third largest operator after Google and Meta, with a global share of 9%. On the online sales front, the group is reducing delivery times to face growing competition from Walmart and Temu. With a 47% market share in the cloud business in 2023 (55% excluding China), Amazon remains one of the companies that will benefit the most from the adoption of generative AI, ranking among the preferred providers of AI-based services/apps for users, although investment efforts and a moderation in consumption are slowing short-term growth prospects.
--> What does it look like technically?
So far this year, it has a cumulative revaluation of +4% and its trend is clearly bullish, so we will ONLY look for LONGs. It is currently in a RECOVERY PHASE and has already reached the 50%-61.8% Fibonacci zone, which means it is in a key zone from which it could end the retracement and start a new bullish impulse on the way to new highs.
Last Friday the IVO oscillator warned us of overselling, and if we add to that the fact that its trend is clearly bullish and that it has a retracement of almost 61.8% Fibonacci, it is very likely that the MOMENTUM will soon turn bullish (Bull) and we can make a long entry.
---------------------------------------
Strategy to follow:
ENTRY: We will open 2 long positions if it exceeds the 236 zone
POSITION 1 (TP1): We close the first position in the 245 zone (+4%)
--> Stop Loss at 226 (-4%).
--> Ratio ( 1:1 )
POSITION 2 ( TP2 ): We open a Trailing Stop type position.
--> Initial dynamic Stop Loss at (-4%) (coinciding with the 226 of position 1 ).
--> We modify the dynamic Stop Loss to (-1%) when the price reaches TP1 ( 245 ).
-------------------------------------------
SET UP EXPLANATIONS
*** How do you know which 2 long positions to open? Let's take an example: If we want to invest 2,000 euros in the stock, what we do is divide that amount by 2, and instead of opening 1 position of 2,000, we will open 2 positions of 1,000 each.
*** What is Trailing Stop ? A Trailing Stop allows a trade to continue gaining value when the market price moves in a favorable direction, but automatically closes the trade if the market price suddenly moves in an unfavorable direction by a certain distance. That certain distance is the dynamic Stop Loss.
-->Example: If the dynamic Stop Loss is at -1%, it means that if the price drops by -1%, the position will be closed. If the price rises, the Stop Loss also rises to maintain that -1% on rises, therefore, the risk is increasingly lower until the position becomes profitable. In this way, very solid and stable price trends can be taken advantage of, maximizing profits.

Amazon 2-17 (scalping + forecast)🔥 Market Overview:
Trend: Amazon (AMZN) is in a mild pullback phase within an uptrend, testing key support levels.
Key Levels:
Resistance: $234–$236 (upper consolidation zone).
Support: $223–$225 (Supertrend support).
Indicators:
EMA 9: $229.22 (short-term resistance).
EMA 200: $225.34 (critical support).
Supertrend: $234.20 (indicating previous strength).
MACD: Bearish, with negative momentum.
RSI: 40.72 (neutral but near oversold, suggesting potential bounce).
🔥 Scalping Strategy:
🩸 1. Momentum Scalping:
Buy near: $223–$225 support level.
Target: $229–$231.
Stop-loss below: $222.
🩸 2. Breakout Scalping:
Long if price breaks above: $230, targeting $234.
Short if price rejects $230, targeting $225.
🩸 3. Range Scalping:
Sell near: $234 resistance.
Target: $225.
Stop-loss: $236.
🔥 Mid-Term Trend Forecast (1-3 Weeks):
If AMZN breaks above $230, expect a move toward $234–$236.
Failure to hold $225 support may lead to a drop toward $220–$218.
MACD remains weak, suggesting limited short-term upside unless momentum shifts.
🔥 News & Market Context:
E-commerce & AWS Growth: Long-term fundamentals remain strong.
Tech Sector Volatility: AMZN follows general market trends.
Macroeconomic Risks: Any Fed policy shifts could impact stock movement.
🔥 Decision:
🩸 Short-term: Watch for bounce near $225 or breakout above $230.
🩸 Mid-term: Weak momentum; a clear breakout is needed for a bullish confirmation.
🩸 Ideal Play: Wait for support confirmation before entering long positions.
👑 Final Verdict: Amazon is at a make-or-break level, with $225 acting as a key defense zone. Bulls need to reclaim $230 for continuation.
🔥 LucanInvestor's Quote: "The strongest positions are built when others hesitate. Patience is power."

Scalping & Mid-Term Analysis for Amazon Market Overview:
Trend: Amazon is in a consolidation phase, struggling to break higher after a strong rally.
Key Levels:
Resistance: ~$232 - $237
Support: ~$225 - $228 (weak), ~$220 (stronger)
Indicators:
MACD: Weak momentum, signaling indecision.
EMA: Price is hovering around 9 EMA & 200 EMA, suggesting a neutral structure.
RSI: Oversold at 43, indicating a potential bounce but still weak.
🔥 Scalping Strategy:
🩸 1. Range Scalping (Short-Term Play)
Why? AMZN is in sideways consolidation, meaning range plays work best.
How?
Buy near $225 - $228, targeting $232 - $235.
Sell near $232 - $237, as resistance is forming.
Stop-loss below $223, as further downside risk exists.
🩸 2. Breakout Scalping (If Volatility Kicks In)
Trigger: A breakout above $237 or breakdown below $225.
Execution:
If AMZN breaks $237, scalp long targeting $242 - $245.
If AMZN drops below $225, scalp short to $220 - $215.
🩸 3. EMA Scalping
Why? AMZN is consolidating near 9 EMA and 200 EMA, meaning bounces are possible.
Execution:
Buy near 9 EMA ($228 - $230) if price shows strength.
Short rejection of 200 EMA (~$232 - $235).
🔥 Mid-Term Trend Forecast (1-3 Weeks)
Bias: Neutral → Bearish
Why?
Weak momentum, with no strong bullish confirmation.
Rejections from resistance suggest sellers are active.
If AMZN holds above $228, expect a slow move to $235 - $237.
Failure to hold $225 could push price down to $220 - $215.
🔥 News & Market Context:
Tech sector uncertainty could slow Amazon's rally.
No strong bullish catalysts, making resistance levels harder to break.
Big money waiting for a clearer signal before large moves.
🔥 Decision: Enter or Stay Out?
🩸 Short-term: Scalping the range is best, avoid large directional bets.
🩸 Mid-term: Neutral unless AMZN breaks $237+ or loses $225 support.
🩸 Ideal Play: Buy dips at $228, sell rallies near $235, and wait for a breakout.
👑 Final Verdict:
Amazon is in range-bound movement. If it holds $228, expect a slow move to $237. Below $225 → $220 next. 🔥

Transformers: Optimus PrimeTSLA + AMZN is an unbeatable combination. NVDA already did the run. Amazon bought out the H100s now will rent it to the world.
One day you will have Optimus sold on Amazon. Welcome to the new world. You will never see 200 ever again in a year.
Nuclear Energy
H100 Rental over the Cloud
Palantir AIP over the Cloud
Optimus Robots in Amazon warehouses
Amazon expansion into Europe and Africa
(but for now let Elons stock take hits and consolidate while he fends off the stupid liberal horde)
Your WIFE will be in the cloud. When I and You die, we are going to the Cloud.
You have literally got to be braindead to not buy this. Take out a fken loan if you have to. This is going TITS up. It has same formation on the monthly as NVDA had in 2015. Literally, shut up. This is going BALLS up.
Amazon + TSLA

AMAZON BULLISH BIAS|LONG|
✅AMAZON is trading in an uptrend
With the stock set to retest
The rising support line
From where I think the growth will continue
LONG🚀
✅Like and subscribe to never miss a new idea!✅

amazon stock in the next dayswhere to get amazon stock with the best prices ???
will amazon stock go up in the next days?\
amazon is a great stock that we must have
you can get this stock and see the stop we must have and get in our stock

amazon ideawe can see amazon in the next few days coming to more price up
we can put the stop in these points

AMZN Consolidation with Potential for Further PullbackAmazon (AMZN) is currently trading within a range, indicating a phase of accumulation where smart money is positioning itself. The selling volume remains strong, suggesting that the bearish pressure is not yet exhausted, and we could see further downside movement.
Key technical factors:
The price is respecting a descending triangle pattern, with lower highs forming a downtrend while holding support near 228.00.
Fibonacci retracement levels indicate potential support at 227.99, aligning with the 0.0 Fibonacci level, which could act as the next target for the pullback.
The 0.236 Fibonacci level (229.03) is currently a resistance area, with price struggling to break above.
If the selling momentum continues, we may see a breakdown below 227.99, leading to further downside targets.
Conversely, a breakout above the descending trendline and 230.21 (0.5 Fibonacci level) could signal a bullish reversal.
Traders should monitor volume and price action closely, as a breakout or breakdown from this range could determine the next directional move for AMZN.

Amazon’s Short-Term Outlook: Navigating Key Support LevelsAmazon remains a market powerhouse, yet its stock is no stranger to short-term fluctuations.
Support levels are indicated on chart. A move below these levels could trigger deeper short-term weakness, whereas a bounce off these supports would underscore Amazon’s robust fundamentals. As always, such volatility is typical in dynamic, high-growth stocks, and traders should watch these key levels closely when planning their next move.

AMZN Short Price target $226-223 Full AnalysisOscillator, SMAs, Fibonacci, Volume analysis of AMZN short. Current trade 3/21 $220P.
I am not a financial advisor, but a full-time trader. Please do your own research and use my videos for educational and entertainment purposes only.

AMZN: Technical Analysis for Feb. 13🔥 Technical Analysis (TA) for Amazon (AMZN)
Amazon (AMZN) is currently consolidating within a symmetrical triangle pattern on the 1-hour timeframe, indicating a potential breakout is imminent.
📊 Key Levels to Watch:
* Resistance: $233.95 → A breakout above this level could send AMZN toward the $235–$240 range.
* Support: $229.31 → Holding above this level is crucial for maintaining bullish momentum.
* Major Support: $222.50 → If AMZN loses this level, it may test $220–$215.
📈 Indicators Analysis:
* MACD: Trending near neutral, signaling a balance between buyers and sellers. A bullish crossover could ignite upside momentum.
* Stoch RSI: Oversold, suggesting AMZN could be primed for a bounce.
Options GEX Analysis for AMZN
* Call Resistance/Gamma Wall: $235 → If AMZN can push above this, it may trigger a gamma squeeze toward $240+.
* Put Support Wall: $222.50 → This zone is acting as a safety net for bulls. A breakdown below could trigger further downside.
* IVR: 12.6, IVx avg 27.2 (-1.53%) → Low implied volatility, indicating a potential increase in movement soon.
* Calls vs. Puts Sentiment: Calls 9.2% → Bullish sentiment is still subdued.
📌 Trade Outlook
🚀 Bullish Scenario:
* A breakout above $233.95 could send AMZN toward $235–$240.
* Calls with strike >$235 for March could be favorable for a bullish play.
⚠️ Bearish Scenario:
* Losing $229.31 could send AMZN down to $222.50, with a possible drop to $220.
* A put spread targeting $225–$220 could work for a bearish breakdown.
🛑 Risk Management:
* Stop Loss for Longs: Below $229.
* Stop Loss for Shorts: Above $234.
🚨 Traders, keep AMZN on your radar – a big move is coming soon! 🚨
🔔 This analysis is for educational purposes only. Trade responsibly!
