Amazon (AMZN) is Entering a High-Probability Reversal Zone!
1. Market Structure & Price Action (1H Chart)
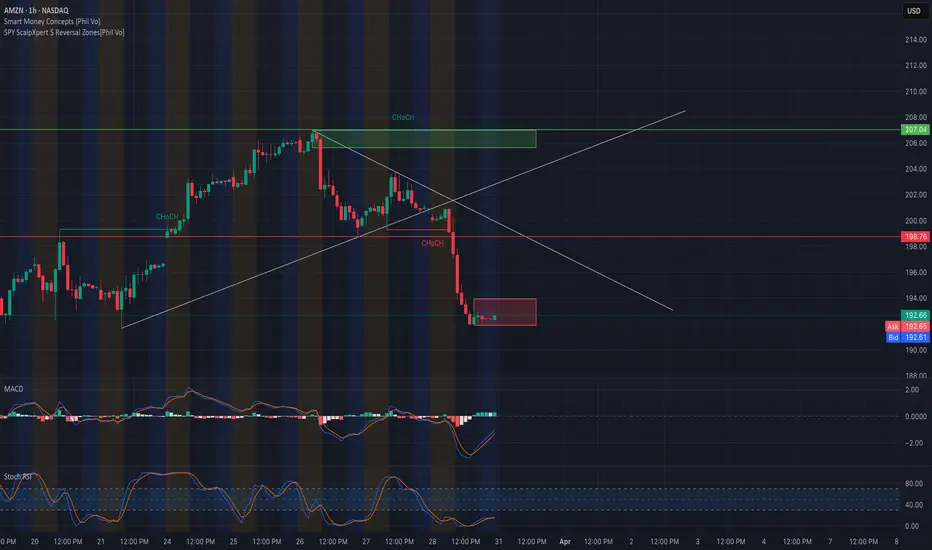
* Trend: AMZN is currently in a short-term bearish trend after rejecting from the $207 supply zone.
* CHoCH (Change of Character): The recent CHoCH around ~$198 confirms bearish control.
* Price Range: Current price is consolidating in the $191–193 zone, a potential SMC Reversal Block.
* Support Zone: $189–190 (FVG + previous demand and lowest Bid/Ask zone).
* Resistance: $198.76 (prior CHoCH zone), then $202.5–207.5.
2. Indicators
* MACD: Histogram flipping bullish with MACD line above the signal line — signaling early momentum.
* Stoch RSI: Moving up from oversold, crossing bullish — momentum is building.
3. Smart Money Concepts (SMC) Highlights
* Reversal Zone (marked): Price has entered a key bullish mitigation zone where demand previously absorbed supply.
* Internal Trendline Break: If price breaks above $195, it could trigger a BOS (Break of Structure) and change direction.
* Liquidity Grab: Previous lows at ~$189 may have been swept to trap shorts.
4. Options Flow & GEX Insights
* GEX Levels:
* Highest Positive GEX/Call Resistance: $207.04
* Major GEX Walls: $202.5, $205
* Strong PUT Wall: $185 (Highest negative NETGEX / Support)
* IV & Positioning:
* IVR: 56.6
* IVx Avg: 46
* Put%: 2.1% — 🟢 Very low put hedging pressure, bullish
* GEX Color: 🔴🔴🔴 (Bearish zone but near bottom range)
5. Trade Scenarios
🟢 Bullish Setup
* Entry: $192.5–193 (retest of reversal zone)
* Target 1: $198.76 (gap fill + CHoCH)
* Target 2: $202.5–205 (mid gamma wall)
* Stop Loss: Below $189
🔴 Bearish Setup
* Entry: If rejection below $195 with weak volume
* Target 1: $189.3
* Target 2: $185 (GEX PUT support)
* Stop Loss: Close above $198.76
6. Sentiment & Bias
* Bias: Cautiously Bullish
* Price is near exhaustion zone with momentum starting to flip.
* Watch closely for confirmation above $195 for long setups.
* Failure to hold $189 may break structure downward.
Conclusion
AMZN is sitting in a key inflection zone where Smart Money may step in. Momentum and indicators are turning up, but macro resistance at $198–202 must be cleared. Use tight risk management and let confirmation guide your trade.
Disclaimer: This analysis is for educational purposes only and does not constitute financial advice. Always do your own research and manage risk accordingly.
AMZN trade ideas
Resistance or Rebound?
Amazon's chart is hanging around $192. Think of this zone as a tug-of-war between buyers and sellers. It's acted as support before, but can it hold again? If it fails, look out below! On the upside, cracking through the $216 resistance could signal a breakout. Will Amazon finally break free, or is it destined for more sideways action? What's your game plan? Are you accumulating near support or waiting for a clear breakout?

Composite index of Magnificent 7The Magnificent 7 stocks are at a crossroads. Will they go down (like 2022) or up (like 2024)?

AMZN Testing Key Support After Rally – Gamma Zone Ahead! 🚀 Technical Analysis (TA) – Intraday Overview
Current Price Zone: ~$200.20
* AMZN made a Break of Structure (BOS) near $206 before rejecting from a key supply zone.
* Currently retracing into a rising channel support line and near previous CHoCH retest zone.
* The price is still inside a bullish structure — watching for reversal confirmation near $198–195.
Indicators:
* MACD: Bearish, but histogram flattening — suggests weakening momentum to the downside.
* Stoch RSI: Oversold and starting to curl up — possible bounce setup.
🔐 Key Levels
Support:
* 195 → HVL + psychological round level + trendline support.
* 190 → Strong PUT support zone via GEX.
* 189.38 → Recent swing low – must hold for bulls to remain in control.
Resistance:
* 206–208 → Supply zone + previous BOS level.
* 210 → Gamma wall (Highest positive NetGEX)
* 220 → 3rd CALL Wall (far extension)
🧠 GEX & Options Flow (TanukiTrade GEX Zones)
* GEX Sentiment: 🟢🟡🟢 — Moderately Bullish
* IVR: 33.6
* IVx avg: 35.4 → Options are fairly priced, no volatility extremes
* CALL$%: 2.4% (weak call flow but dealers not aggressively hedging short)
* Key Gamma Wall: 210
* PUT Support: 190
* HVL Cluster: 195 (May expiry, pivotal)
📌 GEX suggests gamma compression between 195–206, with breakout potential above or breakdown if 190 fails.
🛠️ Trade Scenarios
📈 Bullish Setup – Bounce from 195 or Trendline
* If AMZN holds the rising channel and HVL zone around 195, reversal likely toward 206.
* Entry: Above 200 reclaim with volume
* Target 1: 204
* Target 2: 206
* Target 3: 210 (Gamma wall)
* Stop-Loss: Below 194.50
* Options Play:
* Buy Apr 12 $205 Calls
* OR Debit Call Spread: Buy $200 / Sell $210 Calls
📉 Bearish Setup – Breakdown Below 195
* Break below channel support and HVL may trigger a flush to 190.
* Entry: Break of 194
* Target 1: 190
* Target 2: 185
* Stop-Loss: Above 197
* Options Play:
* Buy Apr 12 $190 Puts
* OR Bear Put Spread: Buy $195 / Sell $185
🧭 Final Thoughts & Bias
* Bias: Neutral → Leaning bullish if 195 holds.
* Gamma and SMC zones align for a bounce setup.
* If price fails to hold trendline near 195, bearish momentum may escalate toward 190 PUT Wall.
🎯 Key Watch: Reaction near $195 is everything today.
📛 Disclaimer: This analysis is for educational purposes only and does not constitute financial advice. Always do your own research and manage risk.

BIGGEST RALLY POTENTIALAmazon (AMZN) is showing signs of potential bullish continuation on the 4-hour timeframe, but confirmation is key before entering a trade. Here’s a structured breakdown of the setup:
Technical Analysis
1. Key Resistance at $200.50
• The price is currently consolidating just below this key level.
• A clear breakout with strong volume would confirm bullish momentum.
• If the breakout is successful, the next upside targets are $213 and $230.
2. Market Structure:
• Higher lows indicate increasing buyer interest.
• If AMZN maintains support above $190, it strengthens the bullish case.
3. Indicators & Confirmation:
• RSI: Trending upwards, but still below overbought levels, suggesting room for further upside.
Fundamental & Sentiment Factors
• Tech Sector Strength: The broader tech market (NASDAQ 100) remains strong, supporting large-cap tech stocks.
• Institutional Accumulation: Increased buying volume from institutions would further validate the breakout.
• Macroeconomic Catalysts: Any positive data regarding interest rates, consumer spending, or e-commerce growth could fuel additional upside.
Trading Plan
✅ Entry: Wait for a break and retest of $200 before going long.
📉 Stop-Loss: Below $189 (to protect against false breakouts).
🎯 Targets: $213-230 (short-term levels).
📊 Risk Management: Position sizing should align with overall risk tolerance.
Patience is key. A confirmed breakout above $200.59 could provide a solid buying opportunity, but failure to hold above this level may lead to further consolidation.

AMZN LEVELS ENDING MARCHHad this FIB previously drawn.
Clean?
When do I buy on fib? When it rejects @ every line?
Or @ specific lines
thinking long term portfolio build 3-5 years.
DCA method.


Amazon Wave Analysis – 24 March 2025
- Amazon reversed from the support zone
- Likely to rise to the resistance level 210.00
Amazon recently reversed up from the support zone between the support level 190.00 (former resistance from October), lower daily Bollinger Band and the 61.8% Fibonacci correction of the upward impulse from August.
The upward reversal from this support zone started the minor correction 4 of the active intermediate impulse wave (C) from February.
Given the strength of the support level 190.00, Amazon can be expected to rise to the next resistance level 210.00, former support from February.

AMZN breaks bear trendAmazon stock has gapped higher along with several other tech firms as investors rushed back into riskier assets following reports that Trump's upcoming tariffs will be more targeted than initially thought.
AMZN broke its bearish trend line after finding good support lats week at $190 key support level. If the gap now gets filled, then dip buyers might emerge near Friday's closing levels of around $195-$196. This area is now going to be significant.
Anyway, the short-term bias has flipped back to being bullish in light of today's breakout. As long as the stock now remains above the trend line, any short-term dips could be bought.
By Fawad Razaqzada, market analyst with FOREX.com

AMZN - Melt up & Crash series [2]We can see AMZN has formed a very clean parallel channel due one last leg up..
Also bullish weekly divergence visible
Not financial advice

A much easier way to use Anchored VWAPs: a BandI created this indicator to make life easier when using anchored VWAPs and ended up finding out that it's a no brainer.

AMZN short short, long long...The theory of eliot waves is great, you can expect a cork and ideally a double top or higher high.

AMZN Testing Breakout Zone – Will Bulls Hold the Momentum?Technical Analysis & Options Outlook
📌 Current Price: $196.05
📌 Trend: Bullish Momentum with Key Resistance Ahead
📌 Timeframe: 1-Hour
Price Action & Market Structure
1. Bullish Reversal Confirmed – AMZN rebounded from the $190 PUT Wall, forming a higher low.
2. Breakout Attempt in Progress – Price is testing the trendline resistance, a key breakout zone.
3. Retest Possible – If rejected at $198–$200, AMZN may pull back to $195–$192 before continuing higher.
4. MACD & Stoch RSI – Both indicate strong bullish momentum, but Stoch RSI is nearing overbought territory, signaling possible short-term consolidation.
Key Levels to Watch
📍 Immediate Resistance:
🔹 $198 – Trendline Breakout Level
🔹 $200 – Major CALL Resistance (70.86%)
🔹 $202.50 – Strong CALL Wall & Potential Profit-Taking Zone
📍 Immediate Support:
🔻 $195 – Breakout Retest Zone
🔻 $190 – Highest Negative NETGEX / PUT Support
🔻 $185 – Deeper Liquidity Zone for Buyers
Options Flow & GEX Sentiment
* IVR: 40.7 (Moderate Volatility)
* IVx: 36.1 (-2.26%) (Declining Volatility)
* GEX (Gamma Exposure): Bullish Sentiment Improving
* CALL Walls: $200 & $202.50 (Upside targets)
* PUT Walls: $190 & $185 (Major support zones)
📌 Options Insight:
* Above $198, expect a gamma-driven move toward $200–$202.50 if momentum sustains.
* Below $195, risk increases for a test of $190, which has been a strong demand zone.
My Thoughts & Trade Recommendation
🚀 Bullish Case: If AMZN holds above $195, expect continuation to $200–$202.50.
⚠️ Bearish Case: If AMZN fails at $198, expect a retest of $190–$185 before another move higher.
Trade Idea (For Educational Purposes)
📌 Bullish Play:
🔹 Entry: Break and hold above $198
🔹 Target: $200–$202.50
🔹 Stop Loss: Below $195
📌 Bearish Play (Hedge Idea):
🔻 Entry: Rejection at $198
🔻 Target: $190 PUT Wall
🔻 Stop Loss: Above $200
Disclaimer
This analysis is for educational purposes only and does not constitute financial advice. Always perform your own research and manage risk accordingly.
Final Thoughts
AMZN is in a critical breakout zone at $198. A strong move above this level could trigger a rally toward $200–$202.50, while failure to break could lead to a pullback toward $190 before attempting another move up. Watch price action carefully and wait for confirmation before entering a trade.

Post FOMCI still believe this market will drop to 5400-5300 area by next week. If I'm wrong so be it, but I go through my reasoning in the video.

Amazon Back to 2021 Highs – A 1/6 Risk-Reward SetupYes, Amazon doesn’t look great here—but let’s put it in perspective.
Imagine holding the stock from this exact price in 2021, watching it trade 20% higher in February 2025—would you sell here?
For now, I’m watching $189—if it can’t break below, the risk reward is even better.
📌 Stop: 5 points from here
🎯 Target: $230
Let’s see if the 189 level holds. 🚀

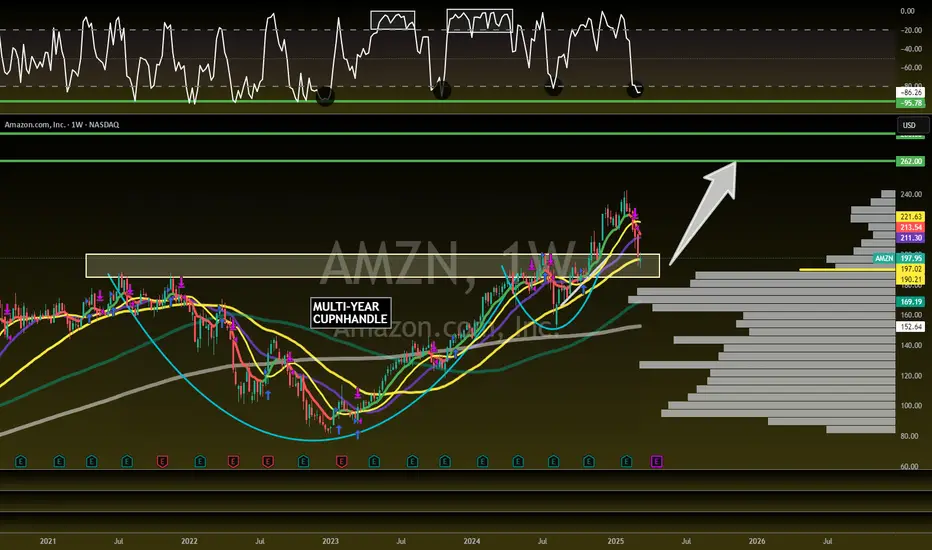
Amazon is the FULL PACKAGE! 62% UpsideNASDAQ:AMZN - H5_W Trade Setup: 🚨
Confirmed CupnHandle Retest =
🎯$262 🎯$280
📏MM: $310
- Multi-Year CupnHandle
- Massive weekly volume shelf
- Green Support Beam on Wr%
- Undervalued MOAT Company
Not financial advice

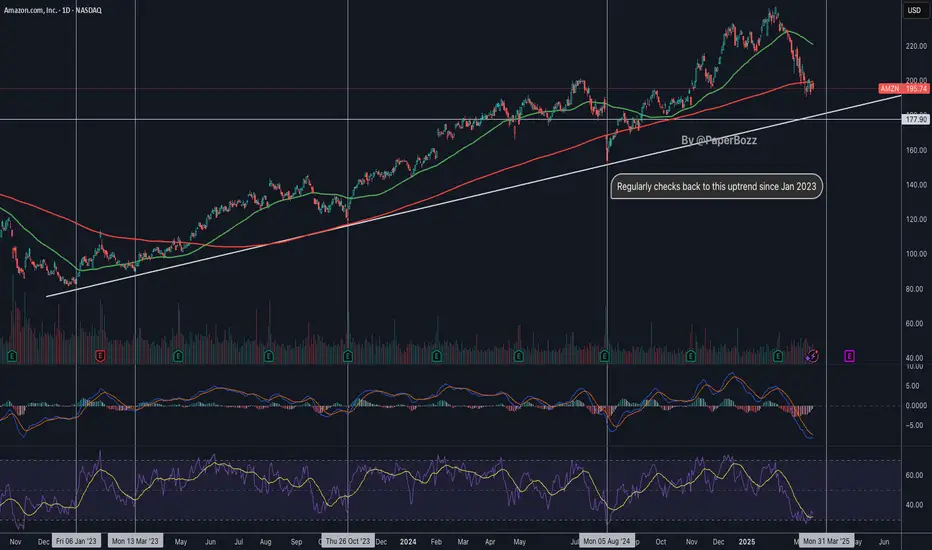
$AMZN - revisit to the trendline likely NASDAQ:AMZN consistently revisits the uptrend line that began in January 2023. There’s a strong possibility it could do so again.
The $180 area could be a good entry point.
AmznHeaded back to 180 price action and trendline support but first a push back to 208-210 (20ma) + theres a gap to close from March 5th
I don't think price makes it back over 210 before it take a turn down to 180 BUT if price can close above 211, then we are headed here
215 price action + the weekly 20ma at 217 .. that my extreme long target that will only come if Spy pushes back up to 580-585..
But we are headed back to 180 and this is perfectly normal!
The very bearish scenario is if Amzn breaks 180.. then 140 comes
So let's talk about trading this
Daily 200ma is at 199.. price action resistance is at 200.00
Long over 201.00
Target - 208-210
Stop loss below 197.00 weekly 50ma
Short only if price breaks back under 195
Target 191
Stop loss
197.50
197-199 is chop... No trade zone

AMAZON SWING LONG FROM SUPPORT|LONG|
✅AMAZON fell again to retest the support of 190.79$
But it is a strong key level
So I think that there is a high chance
That we will see a bullish rebound and a move up
LONG🚀
✅Like and subscribe to never miss a new idea!✅
Disclosure: I am part of Trade Nation's Influencer program and receive a monthly fee for using their TradingView charts in my analysis.

AMZN Sitting at a Make-or-Break Level! Watch This Closely. Mar17Hey team! Quick AMZN update based on the 4-hour chart setup.
📈 Technical Analysis (TA):
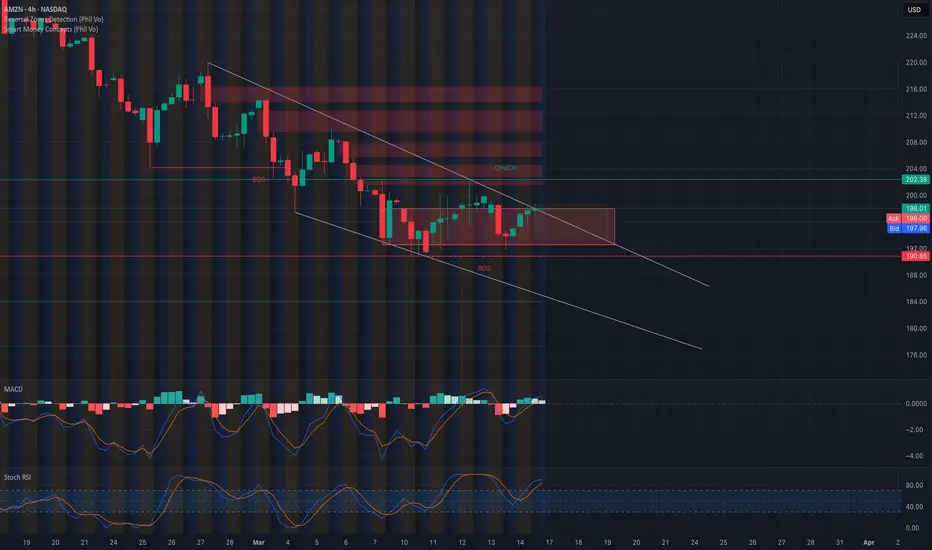
* AMZN is flirting with the top trendline of a descending wedge pattern—could hint at a bullish breakout.
* Crucial resistance zone immediately overhead between $198–$202; breaking this zone could ignite upward momentum.
* Recent BOS (Break of Structure) at $190.85 highlights strong support—this is a key area for bulls.
* Keep an eye on the supply zone around $202.38 if the breakout continues.
📊 GEX & Options Insights:
* Highest positive NET GEX and call resistance at $210; major gamma wall that could act as a price magnet if AMZN breaks higher.
* Strongest PUT support at $190.85; crucial floor level for price.
* IV Rank at 49.6%, indicating moderate volatility and premium—consider debit spreads or strategic premium selling.
* CALL ratio at just 4% signals heavily bearish sentiment in options, implying caution on bullish trades.
💡 Trade Recommendations:
* Bullish Play: A solid break and hold above $202 could set up a bullish run targeting the $210 gamma wall. Stops just below $197.
* Bearish Play: If AMZN rejects firmly at $202, puts targeting a move back down towards $190.85 could offer a solid risk-reward.
* Neutral traders: Iron Condors or credit spreads between clear ranges ($190–$210) could be attractive.
🛑 Risk Management: Stay tight on risk management, especially in a tricky range-bound scenario like this.
Trade smart, everyone!
Disclaimer: This analysis is for educational purposes only and does not constitute financial advice. Always do your own research and manage your risk before trading.
Amazon is about to DELIVER! 32% UpsideNASDAQ:AMZN
Great Risk/Reward here!
Confirmation of Retest = 🎯$262
- Right at CupnHandle Retest area
- Volume Shelf Support
- 50WMA
- Wr% Green Support Beam
Not financial advice
AmazonAmazon should definitely reach 151.37 (even if it moves up again, it will start to move down again)

AMZN Trade PlanLooking to buy AMZN at market price, with additional entries at 187 and 179 for better positioning.
🎯 Profit Target: 210 - 215
Stay disciplined, manage risk, and let the trade develop! 📈📊
⚠️ Disclaimer: This is not financial advice. Always do your own research and trade responsibly! 💡
