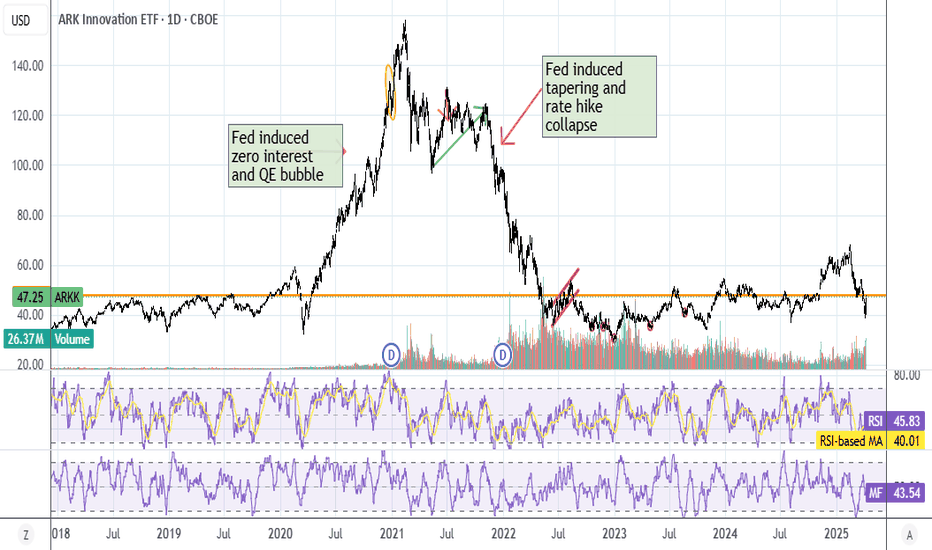
Short $ARKK Nice shorting opportunity in ARKK Details in chart. Shortby alphainvestorsignalsPublished 0
Closing (IRA): ARKK November 19th 104 Short Puts... for a .22/contract debit. Comments: Collected a total of 5.02 in credits (See Post Below); out here for .22. 4.80 ($480) profit/contract.by NaughtyPinesPublished 2
ARKK Broke up channelARKK the popular etf of cathie woods, I personally love ARKK and tbh the TA tells me that we’re going up, we broke channel, we now trailing on trend line all the way up, I do believe that we will reach to $137 and I think as soon as the market opens I’ll take the trade with stop loss below the channel trend lines, of course must wait for indicators confirmation. That’s it guys keep it simple. Longby amirhemoPublished 1
Opening: ARKK December 17th 106/135 Short Strangle... for a 3.04 credit. Comments: Venturing back out into margin account trading land with this delta neutral short strangle in the December monthly camped out at the 18 delta strikes. This results in 2x expected move break evens at 102.96 and 138.05. 3.04 credit on buying power effect of 12.11; 25.1% ROC at max as a function of buying power effect; 12.6% ROC at 50% max. Will look to take profit at 50% max and/or manage sides on approaching worthless or side test.by NaughtyPinesPublished 3
Closing (IRA): ARKK November 19th 100 Short Put... for a .26 debit. Comments: In for 2.09 (See Post Below), out for .26 here, 1.83 ($183) profit.by NaughtyPinesPublished 0
ARKK 200d MA crossoverARKK has found support below its 200d moving average and now is poised to break back up the upsideLongby antifragilemachinePublished 1
Massive bullflag on ARKK?Massive bull flag on the ARK Innovation ETF? I'm increasing my holdings hereLongby BottomZenPublished 115
ARKK - MA200 resistanceTo me the only question is whether we break 123$ which is the upper bound and also coincides with MA200 line. Only once we pass MA200, I can have the confidence of bullish trend back on. by S5_Trading_DeskPublished 0
Can ARKK Break out of resistance level 1?ARKK has been taking a beating in 2021 after a superior outperformance in 2020. Tracking this triangulation pattern before the ETF makes another move higher targeting the 157 upside Longby wallstreetsharksPublished 0
ARKK - Overhead Resistance Likely To Keep Bulls At BayIt was a pretty solid battle throughout the summer with the lower range of $114.50-$115.50 doing a solid job of keeping prices moving sideways. That changed back on Sep 28th. The rally underway presently is likely to find RESISTANCE at that well-worn support NOW resistance level. Sell rallies. Understanding Support and Resistance Levels Remember, the more informed and objective we can be with numbers, the more confident we can be with our trades. That’s important because, although price action is random (a fact that has been proven time and time again), there are repeatable patterns we can use to get an edge. Two of those objective data points we can use to gain an edge are support and resistance levels. These are two of the best tools we have when it comes to swing trading. Why? Because they give us strong data points that suggest where an instrument is likely (and unlikely) to go. But this is really key: Arbitrarily cataloging each price level that appears to be relevant as a support or resistance level isn’t going to get you far. That’s why Aspen Trading takes a unique approach to support and resistance levels. With Aspen’s Support & Resistance Levels, we measure where trades (prices) occur in terms of frequency. This gives us a sense of where market participants are wagering prices may go. That’s about as raw and unfiltered as you can get in terms of displaying what has taken place. There’s no room for interpretation - this is raw data that can be used to get a sense of where prices may be heading. Shortby AspenTradingPublished 0
$ARKK - Has broken trend lineAfter some consolidation and selling pressure, ARKK has broken to the upside and has broken through a trend line. I would wait for a re-test of this trend line and then go long $ARKK.Longby WhiteCollarDadPublished 0
ARKK bullish - wave 3 of (5) startedWe have entered the final wave (5) of the impulse from the start of the EFT Expected target 200-250 mid 2022. By then expect a significant dropLongby jespergarmPublished 3
TrendyCharts: ARKK Inverse H&SThe bigger picture shows a wedge with price at the bottom range. We've got two confluence patterns here Inverse Head and Shoulders Break of trendline PT right before supply. Longby Trendy-NeckPublished 222
$ARKK expecting another leg downSince July, ARKK has been trading sideways in the consolidation/distribution zone with no unusual volume for about 2 months. End of September we are seeing increasing volume activity to the downside. i believe it's going on wave 3 and downside target should be around 99.80-100. Oct 7 seeing the retracement up and hit a resistance level (~113) which is the blue zone area. Shortby fredpuiPublished 1
ARK Innovation ETF (ARKK) • Signs of weakness still in placeARKK currently in a no-man's land. But there are some signs of weakness showing up. It looks like it is better to stay out of ARKK for now. Next major supports around 95 and 70. Confluence between monthly opens and 50% retrace levels. by D7RUpdated 11
arkk complex correctionshort it here it looks like we will breach into the june lows..Shortby sparrow_hawk_737Updated 330
Are we on a relevant bouncing level on ARKK? Today we will take a look at Cathie Wood´s flagship, ARKK. Main elements of the chart: a) The price is against a resistance level + Lower trendline of the flag pattern (bigger white structure) + Lower trendline of the inner descending channel. b) Generally speaking, every time we find this level of alignment between technical elements, we tend to observe good reactions. c) So, should we BUY? No, remember that you should always use confirmations or filters before taking action. In this case, we want to see a bounce + small correction on the edge of the inner descending channel. If that happens, we can think about trading towards the higher trendline of the flag pattern (bigger white structure) d) What are the targets I can expect? We have two to propose. The first one is the higher trendline of the Flag pattern, and the second target is the resistance level at 130.00 e) Speaking about duration, we can expect a 50 to 70 days movement for a full movement like the one we are expecting f) We also have defined a red horizontal line that represents an invalidation level for this analysis. That means that we will assume that the price broke the current level, and we should expect bearish pressure until the next support level. Thanks for reading! by ThinkingAntsOkPublished 5518
Long $ARKKLong $ARKK Bouncing from lower trendline on channel. Longby alphainvestorsignalsPublished 0
An opportunity coming?Looking for a C wave to start soon, and the stochastic is looking over sold on both daily and weekly time frames.by moneyjeff1Published 0
-32% in the past 32 weeks!The weekly chart of ARKK could show you a very beautiful picture of what you are going to experience in the next 25-74 weeks..! As you see, ARKK could stagnate for a long time before any breakout! the last 2 stagnation period were as long as59-106 weeks! In the past 32 weeks, it has lost 32%, and its price volume decreased more than 70% from 13.4 billion a week to 4 billion! Crossing below the 50 EMA in the weekly chart should be considered a very important negative factor! Any asset could be a buy or sell opportunity at any given moment, and we should look at the opportunities, not the asset's name! Moshkelgosha Shortby MoshkelgoshaPublished 2211
$ARKK Looking for $100I'm aiming for $98 based on supply/demand zones. As long as it can clear the noted gap on the volume shelf, I think $98 will follow shortly after. Shortby recentlyPublished 0
ArkkAs we built this desceding triangle, and lost 113$ suppor we could make a case that is besrish and going back to 90$ howver we ca also say we have exagerated bullish divergents As we broke lower in the price actipn but the 3 hour rsi is showing strength has maintained the same as previous drop. If we look as lower time frames im seeing a potential bear flag or contiuation pattern to the down side. We did confirm that bullish divergents so we have dissagreeing charts on multiple time frames…. If we reclaim 114$ we could see a good size move. However if we lose the recent low, things will be looking alot more Weak by ErictaylorPublished 0