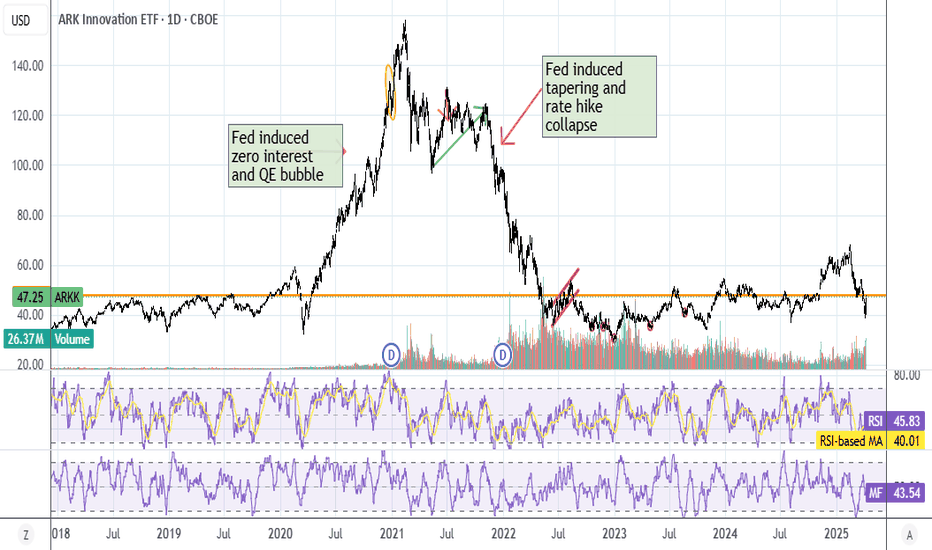
arkk daily follow up i would be looking for a higher low if not maybe a double topby wrglyPublished 0
ARKK watchARKK is like SPY for growth tech. I really would not consider shorting any growth tech until it breaks the bottom trendline on the daily close. Last time it did the drop was brutal. I still think this train won't stop until NQ1! breaks 15k or next monthlies expiration day, doesn't mean I am going to go long. Shortby MightAssTouchPublished 0
Closing (IRA): ARKK July 16th 92 Short Put... for a .33/contract debit. Comments: In for 1.94 (See Post Below), out here for .33; 1.61 ($161) profit per contract. I considered rolling out to August, but the 30-day isn't nearly as sexy as it was.by NaughtyPinesPublished 2
Let's watch ARKK closely! 👀ARKK is following the same movement seen on several tech stocks today: A possible double top in the 30min, indicating a brief exhaustion, but this is expected. The 119.15 is the pivot we must see broken as soon as possible. This will lead to a greater upside movement in larger timeframes. The red line is not going to be an easy foe for ARKK, as it seems the market remembers this price level pretty well. Yes, we also have a small divergence on the RSI, which could make ARKK fall a little tomorrow, but this wasn’t confirmed yet. On the other hand, if ARKK breaks the resistances mentioned, the 130 is our next stop! Let’s wait for more confirmation on ARKK! If you liked this trading idea, remember to click on the “Follow” button to get more trading ideas like this, and if you agree with me, click on the “Agree” button 😉. See you soon, Melissa.by UnknownUnicorn21312077Published 336
ARKK Bearish PatternAMEX:ARKK Top 3 Holdings 9%~ NASDAQ:TSLA 6%~ NYSE:TDOC 5%~ NASDAQ:ROKU Going for the retest of the longer-term bearish patternby jakelikesstocksPublished 221
ARKK Bottom Head and ShouldersThis bullish signal indicates that the stock price may rise from the close of $118.33 to the range of $131.00 - $135.00. The pattern formed over 30 days which is roughly the period of time in which the target price range may be achieved, according to standard principles of technical analysis.Longby Bob_k1Published 114
$ARKK Regains all Moving Averages!Looks like $ARKK may be ready for a nice move higher. As you may know ARKK invests in high beta stocks so it can and does move quickly. I show it broke out of a Darvas Box a couple days ago. Today it reclaimed the 200 SMA and all the shorter term moving averages are pointing up and are just under price. This should (TBD) help lift this ETF higher. You can see my entry and stop on the chart. Ideas, not investing / trading advice.Longby jaxdogPublished 2
Cathy Wood's flagship ETF, ARKK is now at the point of support Cathy Wood's flagship ETF, ARKK is now at the point of support of $101 - $103. lvl of gathering.. Not financial advice, your trades can go to $0.00. Do your own research!by awolvy0Updated 3
HYPER GROWTH IS BACK IN TOWN, CATHIE WOOD IS IN THE ROCKET SHIPHyper growth has crashed by over 35%, inflation data is not as bad as everyone thinks, 10 year treasuries have pulled back, commodity prices have dropped massively, lumber has dropped from 1700 to 1100, fed likes to print money BRRRRRRRRR. This is not financial advice and I'm not advertising the buy or sale of ARKK etf or its holdings.Longby kediguyPublished 4
There is an upside We should be heading up from here. Any drops can be bought. One caution- We are in the fifth wave of Broader Markets and i expect that to end sometime in next few months. If broader markets starts to drop, the fifth wave on this ticker will be truncated at where ever it stands. Longby rbswingtraderPublished 227
Trading Plan for the breakout on ARKK - Statistical ApproachToday, we will explain our trading idea on ARKK. What are we observing right now? The price is inside a descending Wedge pattern (106 days correction), and we are observing possible signs of a breakout happening soon. We can see a clear support zone that the price could not break, so we expect a bullish movement towards the next resistance zone at least. How are we planning to trade this movement? We are waiting for 4 daily candlesticks, at least on the edge of the wedge pattern. (Currently 3) After that, we will set pending orders above the structure, and we will wait for a new local high for an execution. The optimal scenario would be to see a retest of the white curve. Ok, but why did we chose 4 daily candlesticks and not 7 or 9? Good question, smart guy. Let's take a look at the next chart Here we have defined ALL the corrective patterns that were ABC clear structures with a duration higher than 50 days at All-time highs level. The conclusion is that after we have the first breakout attempt, we observe a 4 to 8 days correction (daily candlesticks on the edge of the broken pattern) and a new local high as an execution level has been working really well to provide Great setups with huge risk rewards ratio. OF COURSE, the setup failed several times, this is a statistical approach to taking setups, and we should be open to a new fail here. However, our approach is taking good bets in terms of Win rate and R/R ratio. (this means taking several setups to start observing an edge) The risk we are planning to take on this setup is 1% of our setup, move our stop loss to Break-Even on the next resistance zone, and we will look for a 1 : 10 R/R Thanks for reading! Longby ThinkingAntsOkUpdated 4412
ARKK at important resistance..!in the past 37 days, ARKK failed to break above the 200 SMA! The average 5-day Trading volume decreased from 3.16/D billion in March to 795 million/D. Wait for rejection and confirmation..!Shortby MoshkelgoshaPublished 101015
$ARKK meeting resistance at 50&200SMA + march low anchored vwap.title says it all. lovely bear flag forming. targets prev. lows 95-100. playing it via 7/16 $110 putsShortby will3037Published 2
ARK DeathCross Plan exit strategy or have PatienceARKK with deathcross happening shorterm It can move to $122 if mkt helps then $133 (Difficult) would be ideal before rolling over. 90-97 is decent bottom zoneShortby anjeltradePublished 3
Small cap growth still not out of trouble yet. ARKK has become the bell weather for small cap growth so it is a good ETF to track if you have small cap growth names in your portfolio. There has been some recovery in the growth space, but the ARKK charts shows us that growth names are not out of the woods yet. ARKK is still struggling to break above the ema cloud and has not broken the downward trend line. The up trend will not resume until price breaks above the neutral (tan box). In light of this caution in warranted before jumping heavily into the small cap growth space. The best approach is to scale into positions if you want to enter.by WadeYendallUpdated 5
ARKK fakeoutARKK INNOVATION ETF failed to break it´s downtrend. We may see some movement to the downside (98-100$) if it stays below 113$ area.Shortby Maddin278Published 4