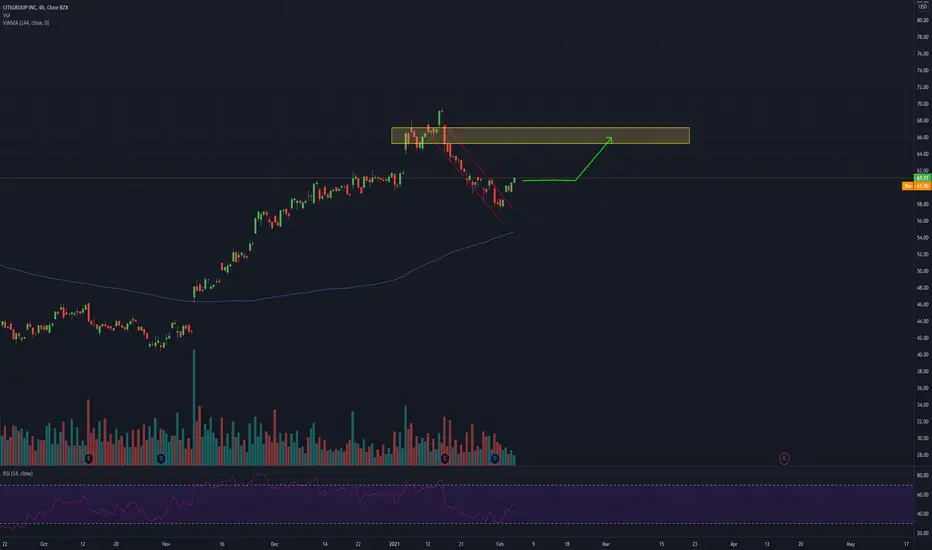
Banks gain momentum Potential gain:18%
Reward/Risk:5
Timeframe: 4-8 wks
I always try to present the charts in a simple comprehensive format to prevent any confusion.
This is just my technical view, neither a fundamental comment,nor a recommendation to trade..!
Please review my track record and calculate the odds for yourself..!
You’re likes and comments encourage me to continue this.
Stay tuned great live stream and quality content videos coming soon..!
C trade ideas

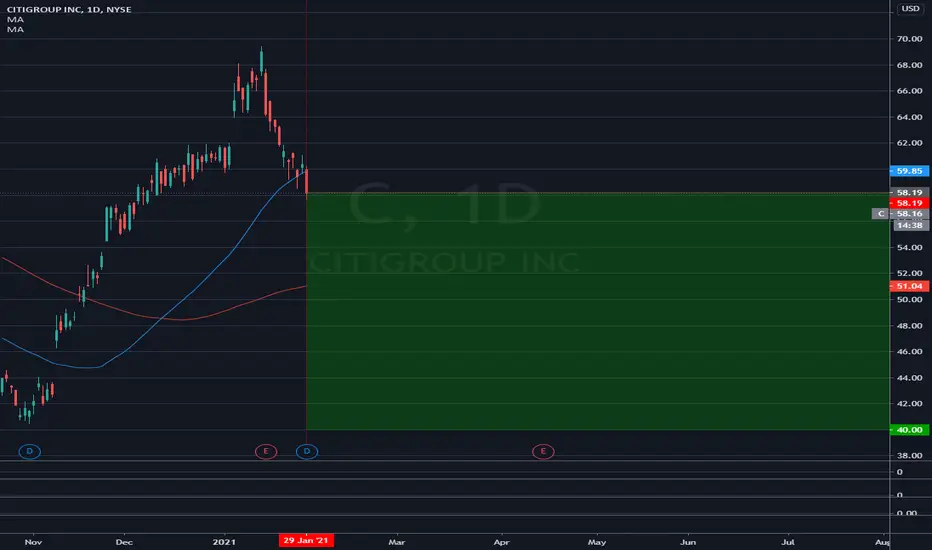
C Elliott Wave Analysis 2/19/21Probable possibility
Expecting Minor Wave C to complete Intermediate Wave (2)
An equal A to C aligns with the 50% of (1)

$C - so many great things about it IHS potential.
It's a laggard due to bad new late last year
daily consolidation, golden cross, strong ATR support, MACD cinched and stochastic has a lot of room to move up. Getting into calls. One of my faves


C Elliott Wave Analysis 12/22/20Update to previous posted chart, possible/probable target price around $66

C Elliott Wave Analysis 1/26/21Possible/Probable wave count and outcome for corrective Wave (2)
Either way I think it'll retrace to the 61.8% or 50%
If A is not complete, then it'll go lower, 38.2%

Citi Bullish Gap FillCiti just completed a gap fill, and is very oversold based on the money flow index.
It reported an earnings beat by 55%
This looks like a good place to buy the dip, I likely will add to this position
I wish everybody here luck in all your trades, always practice proper risk management.
Thank you for viewing.

$C with a Neutral outlook following earning releaseThe PEAD projected a neutral outlook for $C after a Negative under reaction following its earning release placing the stock in Drift D
If you would like to see the Drift for another stock please message us. Also click on the Like Button if this was useful and follow us or join us.

Trade Update #stocksThe Chart: Price has fully reversed from the bottom of the large range (rectangle) and has now broken out of the top end of the range. Despite todays rough down day I am comfortable with my position as long as price can hold above the 59 area.
The Narrative: Banks are taking a bit hit on earnings but the quarterly results we not as bad as the price drop may seem. Given the run most including Citigroup have had, taking some profits into the quarterly results was some what expected. The recent move in interest rates, reopenings, and overall global growth should all be tailwinds for the sector. Unless there is a double dip recession, I think the banks have more room to run especially if we hold the 59 area for Citi specifically.

resistance is close, stay cautious great breakout on all the banks in the past couple of weeks, if long here on C consider taking some profits around 70-72 where we have seen it get hammered down in the past. but of course it resistance breaks it will turn into support. if that happens you can target 75-80! either way congrats :)

Cup and Handle Earnings 1-15Earnings 1-15 BMO
Break from C&H Pattern
Cup low is 40.49 Cup depth is 21.98
Mid cup is 51.48
Support below handle low and mid cup
Targets are calculated using cup depth and fib levels then added to long entry level.
Not a recommendation
The market does not form pattern, we do (o:

Citigroup : quick lookThere were times when #C were the largest US bank and their share price was 10 times higher.
More than 12 years have passed since then and #C market cap now is just half of Bank of America's #BAC one and 3 times less than of JP Morgan #JPM.
2020 pandemic wasn't a financial industry crisis. Quite the contrary Banks are benefiting from the huge injection of liquidity, increase of the number of retail investors and IPO-mania.
Their own analysts predict a bright future for the long time undervalued financial sector in the months to come.
Sourcing inspiration from the #C share price dynamics in 2016-2018 we could mark some support-resistance levels for #C up until end of 2023: 63,50 - 53,50 - 83 - 72 - 100 - 90 - 120


nice short heretarget 54-55 and then switch to the long side after you sell the short position for profit! rejected off big resistance.. goodluck ! :)

C Elliott Wave Analysis 12/11/2020Seems like a completed Wave (1)
Fibonacci retracement and volume possible confirmation of correct wave count
IF so, expecting retracement to healthy RSI condition for a buying opportunity

IRON TARIHi guys!
New Iron condor, chek my last trades, and get my script for free!
Enjoy your wallet!
Tari.

C inside day after new high!Bank stocks started a very nice rally since November, C almost went up for 50% already!
Here we got this inside day after new high as a potential chance to get on the train!
Let's see how it goes yo!


CitiGroup sym: (C) In Big TroubleCitiGroup Bear Flagging hard. Very high volume selling. I think there's more to this story than the public knows yet. All banks having a terrible day despite beating earnings expectations. I just don't trust the CLO exposure that these banks have. Citigroup may be in for a world of hurt soon if they overleveraged themselves. If Citi goes under we could see the entire financial system collapse with it. Be careful out there.
Technical Pattern Daily:
BEAR FLAG
Supports in Green
Resistances in Red.
Good luck. This ship looks like it's about to sink.


Is $62 in the cards? #stocksBanks continue to surge pricing in a recovery. The Model gave us great trade location so now we are just playing with house money. We think 62 is in the cards which would be a completion of the wave formation.
Ingenuity Trading Model is an algorithm used in- Stock, Forex, Futures, and Crypto markets. The model is a Geometric Markov Model :
In probability theory, a Markov model is a stochastic model used to predict randomly changing systems. Markov Models are used in all aspects of life from Google search to daily weather forecast. The randomly changing systems we focus on are the equity, futures, and forex markets. The geometric element of the model is the fractal sine wave structure you can find on any chart you look at across any market and across all time dimensions.
Our model focuses on the current sine wave formation (current state)- geometric price formation along with its volume and volatility over a given time period and using that information to predict the future state- future price movement. For questions or more information feel free to contact me in the comment section or via private chat
