C trade ideas


Base on Top of a Base patternLook for an entry above $74 when the price breaks through the top of the second base with high volume above the 20 day average. See image for details.
Look for a 100% - 500% run thereafter.

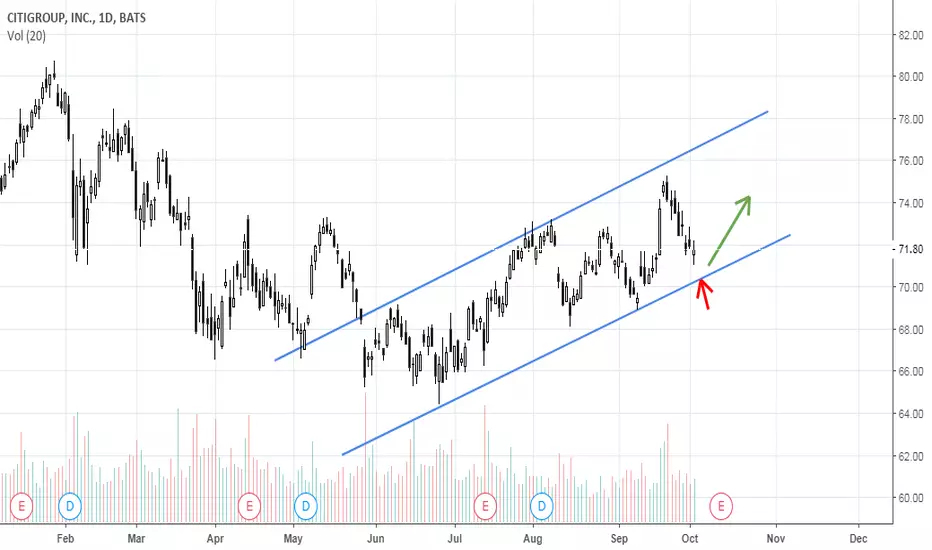
C - Inverse Head and Shoulders breakout!Following some upbeat forecasts for the financial sector and with JP Morgan announcing a 43% dividend increase, financial stocks soared today. From my analysis of the sector, C appears to have the most bullish chart at the moment and should be a top pick in the financial sector at this time.
Today, C broke out of an inverse head and shoulders pattern. Inverse head and shoulders are among the most common and most reliable reversal patterns in technical analysis. With the breakout from the neckline, the pattern provides a price target equal to the size of the head from the neckline (the cloned and placed blue boxes). With multiple supports now below the current price and a price target of $82 it offers a fantastic risk/reward long play. This represents an 11% gain over today's close in the short term (~3 - 6 months). I entered a long equity position today. I think it is fairly likely that C re-tests the neckline, in which case I will be buying long call options if any re-test fails, or on any pullbacks to its price target.
-------------------------------------------------------------
As always, the responsibility for managing your position is your own. I am not a financial adviser nor is any content in this post intended to be financial advice. The information presented is my opinion, based on tools I have learned from others sharing their opinions and my experience in the markets. I share these ideas to generate discussion and have others critique my analysis because, as always, I am still learning. With that in mind, the outcome could be quite different than what I am predicting and this is for entertainment purposes only. It should not be considered financial or investment advice of any kind. Readers should consult with a financial or investment professional to determine what may be best for their individual needs.

Cash money, but just how much?For those following the Financial Sector two big dates are coming up fast for Citigroup ($C): The 26th of September next week, when the Fed decides rate raising (decreasing/no hike) and mid October when $C and other banks report earnings.
The Sept 21 - $72 strike was just too tempting at $0.20/contract. Now that Citigroup, $XLF and the market in general is heading north, should gains be cut and collected today, tomorrow or are we gliding to the weekend on the wings of euphoria? $C beaten down MACD converged bullish, and the buy rumor sell news still has about 5 more days before expiration (unlike the Sept 21 contracts). The resistance at the $71.5 strike seems to be the only remaining obstacle before a short-term run on $73.
As always, do your own due diligence.
-Bayarizard

38.2% & POSSIBLE 61.8% Retracement LONG GWAVE38.2% & POSSIBLE 61.8% Retracement LONG GWAVE.
FIB Retracement Percentage is calculated in a Higher Euclidean Dimension.
PLEASE ALWAYS WAIT FOR STOCHASTIC CONFIRMATION!!! THANKS

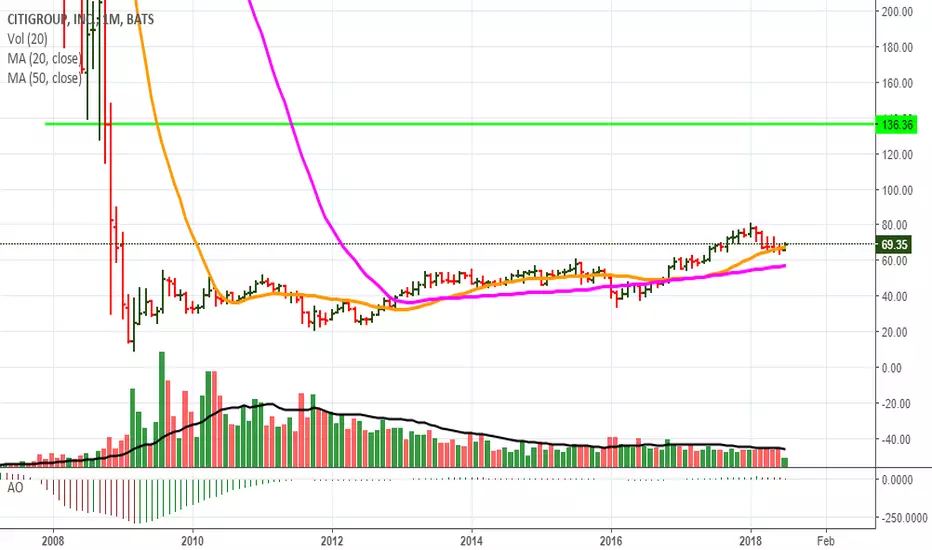
Citigroup is a sleeping GIANTI would like to present you the 6month TF, this card shows a slow uptrend, bc the price is trading above the 7EMA line and step to step will reach new highs. Citigroup is a really long run stock, if you want to made a quick profit don't look at it.
I choose this TF merely because it shows that these future months is a stage of accumulation, with 60% upside. Let's answer the question, what's showing indicators.
The RSI has the strong uptrend, and I feel the price will break through the 50 at July 2019, which lead the price to the target $90 p/s. The MACD has made a crossover with its signal line and has the centerline resistance level, but to reach it we need more than 18 months.
How to invest in C?
Simple strategy. If you have some profit from your swing trade take from it 30% to buy some C shares. I'm sure at the end of 2019 you will be happy with your diversified portfolio which will have some percent of C shares.
Good Luck!
ENTER: $65-75
CLOSE: $110 and higher
Likes/Comments, Yes please! :)

Citi never sleeps and aims for higher growthStrong trendline with a bullish uptrend on all the frames.


$C Looking like a downtrendFinancials have been on a tear lately, but we think $C is about to hit a triple top and fall from here.

Trading Strategy for Parabolic Markets [Part 3]In part 1 I outlined an approach that I have been working on that is aimed towards trading parabolic markets. In part 2 I outlined 4 trades with entries, stop losses and risk:reward calculations. The best position (in terms of risk:reward) has been saved for last.
Notes: Tyler Jenks says, “All hyperwaves are bubbles but not all bubbles are hyperwaves.” This looks much more like a legit bubble than a hyper wave. Weekly chart has been included to illustrate that. | 200 MA > 10 MA > 50 MA | ADX is getting ready to cross 20 in confluence with the bull flag breakout | Weekly ADX getting ready to cross below 20 | Price is currently below 200 day MA and is acting as resistance | 50 week MA is also acting as resistance | Daily RSI = 56.81 and weekly RSI = 53 | Visible Range Volume Profile shows all of the volume at $19 - $50 and very little resistance at higher prices. Since this is not a hyperwave the VRPR and FIB Retracement levels will be very important. The profit targets are also much easier to recognize/calculate.
Q-2 Earnings Report: Deposits: Expected earnings per share: $1.54 vs $1.62 actual earnings per share for a +5.19% surprise. $996.7B vs Projection: $1.009T | Fixed income trading revenue: $308B vs Projection: $3.11B' | Sales from consumer banking and institutional clients: $8.25B & 9.691B for a growth of 2% & 3% respectively.
Time Analysis: Could see it gapping over the 200 day MA on Monday, could also see months of consolidation to follow death cross from 4/26 and ADX falling below 25 on weekly chart.
Possible Entries: Breakout above 200 day MA and 50 week MA - I have set a price alert at $75.59 | Breakout above local high of $81.54 (second price alert) | 50 and 200 day MA golden cross
Risk: Need new low to be established on the weekly after breaking through the 200 MA. If use current low then the risk is 21.25%.
Profit Targets: $125 (+56%) | $236 (+195%) | $399 (+398%)
Risk:Reward: Depends on how much is profit is capitalized at each target and where the next weekly low comes in. Suffice it to say this is the best r:r out of all the positions listed. When there are too many good opportunities for an entry then I like to use the risk:reward ratio to determine the best entry.
Part 1
Part 2
Thank you for reading! If you found this helpful then please like, comment and subscribe!

Citi Is In For a Technically Bumpy RideI did this analysis really elucidate what an "extended ceiling" looks like. The annotations are pretty straight forward AND if you look well enough you'll see an upside-down cup and handle forming and if you squint just right you'll see a head and shoulders forming. I would've shown it on the diagram but the drawing would've become too busy to make sense. Notice too, that the 21-day moving average is working well as a support and as a resistance. Admittedly, I haven't done any fundamental analysis but preliminary, doing things in reverse, we see that Citi, technically, is in for a rough ride. If there's a stock you're fixing to take a position, put the ticker in comments section also what position, long or short, you want to take.

C (NYSE) Citigroup long set up M$C Good set up on the monthly chart. A break out could give a very nice r/r here $SPY
Break out or Break down - $C - CitigroupShort-term call?
After a quick drop and sharp earnings reversal, Citigroup seems to be ready to break out of the "Head and Shoulders" pattern it has been setting for a year. In the past two years especially, the second half of the year has typically been a boon to the Financial Sector. Due to the lack of resistance, if Citigroup does resume it's trend, it's clear skies until $73 or 8 strikes from it's Monday (7/16/18) close of $69.47. MACD & RSI divergence, higher lows & highs, hint it's break out time; although $C tends to test support when closing below a mid-dollar strike (e.g. $68.5, $69.5 ... ) many signs seem bullish.
Short-term Put?
Since the 100-day MA hasn't been traversed quite yet and dimming global outlook for a very globally diverse financial institution are pertinent concerns: a resumption of $C's breakdown toward $67.50 is still plausible; Less likely after $66.50 was touched and multiple lines of support drawn there after during the post-earnings fire-sell, but still plausible all the same. Having a complete collapse like the "Head & Shoulders" suggests, and a fall straight through $66 is more of a longer term trend that is unlikely, but still possible. Caution would be to start with a strangle or straddle around the $69.50 strike, with the call focusing on the resistance-turn-support of $69 (firmly in the money) and roll the dice with the put's placement, with one's choice on potential gains.
At the end of the day:
Financial deregulation, tactical global divestment, Citigroup's 10% share buyback, increase in dividend payouts and a solid beat on it's Q2 earnings (despite the sell-off) all point toward a brighter future. Old allies and Old foes becoming the opposite, nationalistic rhetoric and new Middle-Eastern oil deals all are obstacles, but whether they are insurmountable is up to your short-term hypothesis because only time tells; and time is always money.

Citi (C) bullish butterfly pattern and daily hammer!The banks showed significant relative weakness against the market since 2018.
While, with regard to the rate hike cycle, put some banks in the portfolio is still one of the major investing ideas.
Therefore, this daily bullish butterfly pattern and the daily hammer combination may be a short-term set-up to long C!
Without abundant EMA correction rooms, I won't prefer trading the hammer with the breakout strategy;
on the other hand, the 50% or 0.618 pullback buy and put the out below 62.80 would be the trade for me!
Let's see how it goes!


Citigroup still says buy Trade the trend with bullish bias until proven wrong, It bounced nicely off the last safety net of 66, price area around 72 should be interesting to see if bears will keep the ball rolling or let the trend continue to flow. Trend says buy so I buy. Stop loss below 65 if that breaks it will show bears are gaining momentum.

CITIGROUP - is turning bearish and expected for a new breakdown.CITIGROUP - is turning bearish and expected for a new breakdown.


watch for the break downIf this can close below that blue ling then expect lower prices. falling wedge below all sma banks are really lagging and holding the markets back

Long C via CallsStrong close here on the 65m chart.
Long 3x $67.5 Aug17 calls @ $2.51
Stop: 66.68
Target: ~72.2
I will also move my stop up as C moves up because of decaying options.
