C trade ideas

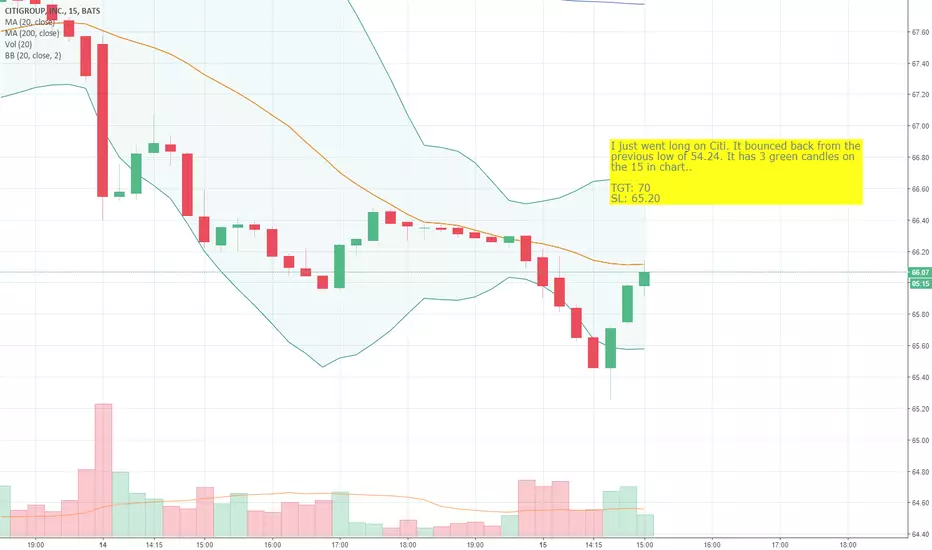
Long call on C - My Options tradeI just went long on Citi. It bounced back from the previous low of 54.24. It has 3 green candles on the 15 in chart..
TGT: 70
SL: 65.20


#C citi plan....Im on sell...made money...now the next plan...
Plan 1 : Sell here 66.5
Plan 2 : buy pull back 73.5
I still feel the trend is up...and it will move up...let us watch....

Citigroup Support & PredictionI believe the market support is going to be around $67 for the next few weeks, and a short call of it going to reach a $70 market price within a timely manner is reasonable. The negative correlations and left skewed spread though seems unattractive to investors, but it is still not considered a high risk stock. Overall Citigroup is investable for a conservative portfolio and both an expectancy of it surpassing the $70 price, as well as strong market support trailing at $67 in the meantime, is a reasonable analysis.

Citibank found support at 67C has been at 67 before, if the price clears 68, it could grind higher towards 78.


C & financial sector showing weakness?The financial sector sell off caught my attention. Bearish future?

The "Cheap" Bank w/ Short Term Trading Gains (PT $75.40)Who couldn't love Citi when it had dropped to $68? Given both the long term and "2017 Hotness" trend lines, the stock has been knocked down between a reasonable to weak area where it can rebound back up to a comfortable "median" position that has been previously held. Reading between the fib lines and the somewhat consistent range of $70-77, it wouldn't be unreasonable for the stock to climb back to around the midpoint of $75. Its earnings call was great, though some will argue with how fantastic it should have been given the current climate and what's priced in.
If the stock reaches $78, absolutely sell and don't be greedy trying to wait for that magic $80 mark. I'm sure everyone will be watching and waiting for it, but without proper volume, it will be a short lived rally up as everyone else takes their gains. I love Citi as a company and believe it to be strong and stable moving forward the rest of this year. Any price point close to $70 is great for a small position and for technical trading to get some ranged gains.

Citibank filled it a Gap, but the ES didn’t...Looks like we will get a squeeze higher on the Es, then drop

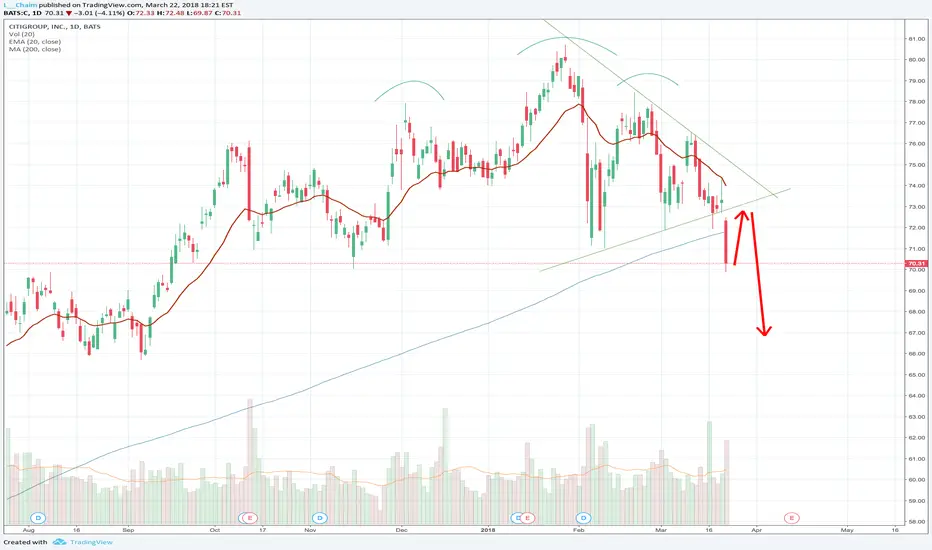
MA 200 is broken.The price bounced off the upper border of the downward trend. This means that we will be able to move the stop order all the time.The fall occurred on the day of publication of the quarterly report.This fact sets the direction for the next three months.

C is on an ABC Wave Now, A-B up wave Monthly chart just tells you before 2008 2009 crash Citibank was huge, now $80 looks like a MAJOR resistance area, with $40 MAJOR support area. Earning is scheduled for later this week, I except price will be bullish for next week or two, then continue down wards to support level of $60 area.

Trading PPsignal Trading IdeaWe detected an entry sign in C Citi NYSE:C .
We are close to the earning calendar so we believe there may be a technical purchase alert.
We have traced a fibonacci retracement. If pp siganl gives buy signal above or close to 23% .60 fibo ... Buy. Take profits in fibo 50 or 78%.
Configure signal in W search.

Bullish Deep CrabBullish deep crab with bullish divergence
Measurements
- 1.618XA
- 1.27AB=CD
- 2.24BC
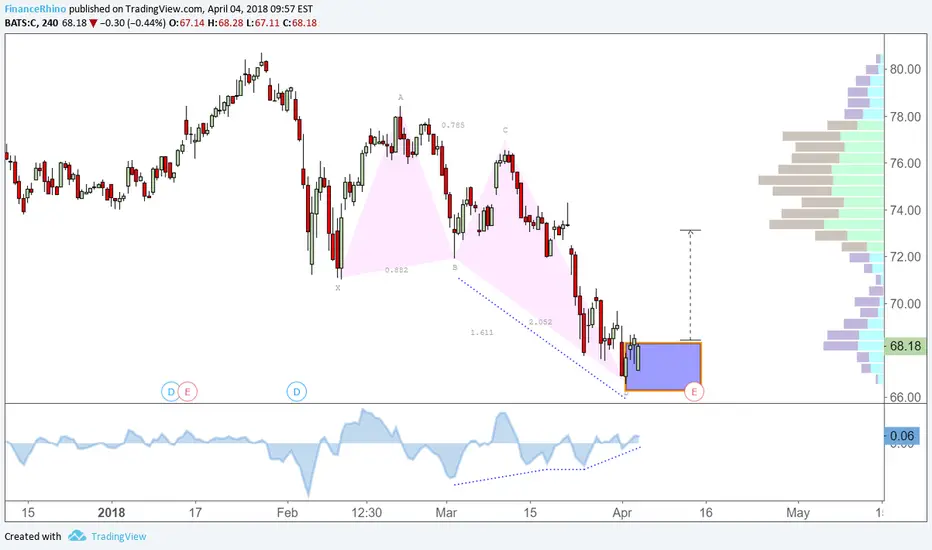


Citigroup(C) Bullish Butterfly and 70 long opportunityAs the stock market pulls back, it will be exciting to do the bottom-up strategy.
C has a potential bullish butterfly pattern and the entry will be near 70.00, which no doubt will be lots of buying orders.
In an investment mindset, long in front of 70.00 and put the out below 65.00 will be a solid strategy,
while in a trading mindset, an intraday reversal sign near 70.00 will be necessary as we won't know how and why it went there.
I like both though!
Let's see how it goes!

Triangle brokento the downside contrary to initial expectation. Bullish trade was never confirmed.
Besides a HS is forming. See chart
Bullish on confirmationUpon breaking out of the triangle (To the upside) I'd look for long opportunities.

Bank vs. Cryptocurrency #11 (C)One year of trend after 9 years of no direction and below the 60.00
And now, finally this bank is trending, the past year the stock went up 24.8% is low compared with Bit-Coin
But a investor is buying value with low risk and is diversifying your own Portfolio when buy this kind stocks.
How many times in your life will you be able to buy shares of Citigroup-Inc. at 77.08
In other words for the right investor this is a bargain.

Sentimental Short Hi guys. I always feel sad making short calls but somebody has to do it imho. Happy trading and please always wait for confirmations (e.g. lower high and lower low).
