CAT: Ride Long TradeCAT follows my China/Macau Recovery Theme and it's too expensive for me to run an options trade. CAT similar to LVS, was showing independent price movement from the broad market drops we have seen starting on the 15 Feb.
Increasing Annual Rev
Increasing Quarterly Rev
1.62% Short Interest
CAT trade ideas

CAT - CATchup or fall behind.CAT - looking at CAT I was seeing it hit the top of a channel but when put together with Deere it makes me wonder if it is just being a tortoise here.
This is for me to track in the near future as the markets change.
Thanks

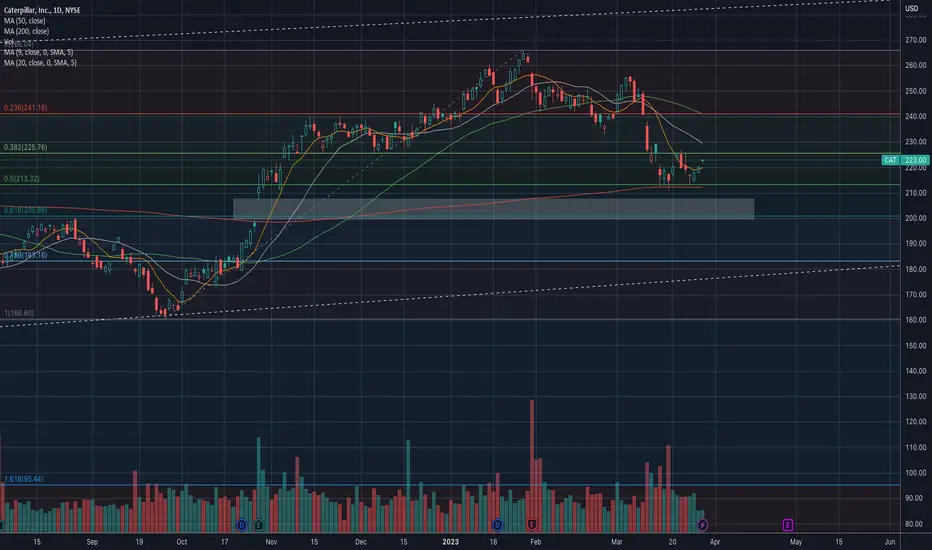
$CAT - Watch and wait for nowSo far 200DMA provided support. The 200DMA is also 50% fib retracement. However there is a gap at $200 that needs filling. My guess is it could fill that gap.
Just watching for now.
CAT Swing Long Reversal UPDATECAT is now bottoming for a SALE just in time for seasonal construction and agricultural upticks.
The long view is a long uptrend that started in September and ended with a lousy earnings report in
early February. The beatdown is now ending perhaps for fundamental reasons including CAT
has cash and down not need high-interest rate costs.
See the chart for the analysis. See also the previous idea. Check DE.
I see this as an intermediate-term swing long or investment or a good choice for a long expiration
call contract of options.

[CAT] - Daily - ShortZoomed in on daily.
Last trading day Fri 17 Feb 2023, we wicked right off the C.E. of the rejection block and the upper level of the daily bearish breaker.
Currently sitting right at the C.E. of the daily bearish breaker. Want to see us move towards the lower half of the breaker and trade through it, attacking the sellside liquidity at the RELs.

CAT Swing Long ReversalCAT has a downtrend 10% from its 30-day high.
However, fundamentally the industrial is holding up quite well.
The downtrend was inverse parabolic accompanied with
an appropriate volume pattern showing 3X relative volume
This is sometimes called the retirement trade pattern
or V-type pattern. CAT has dropped to three standard
deviations below the anchored VWAP /
This makes it undervalued well below fair value.
I see this as a good setup for a long swing trade or a call options
contract with the expectation of a 50% retracement of a
10# drop or a 5% price target For the call options I will
target the anchored VWAP at a strike of $243 about 12 DTE.

CAT: Looking for a BounceCAT is at support and RSI is signaling a buy signal. Purchased calls and expecting gap at $240 to be filled within the next 2 weeks.

CAT - Technical Breakdown on watchCaterpillar is on the verge of triggering a bearish topping formation.
This stock has been a powerhouse during the rising rate environment.
if this market leader breaks down its signaling weakness in the economy and likely the industrial sector.

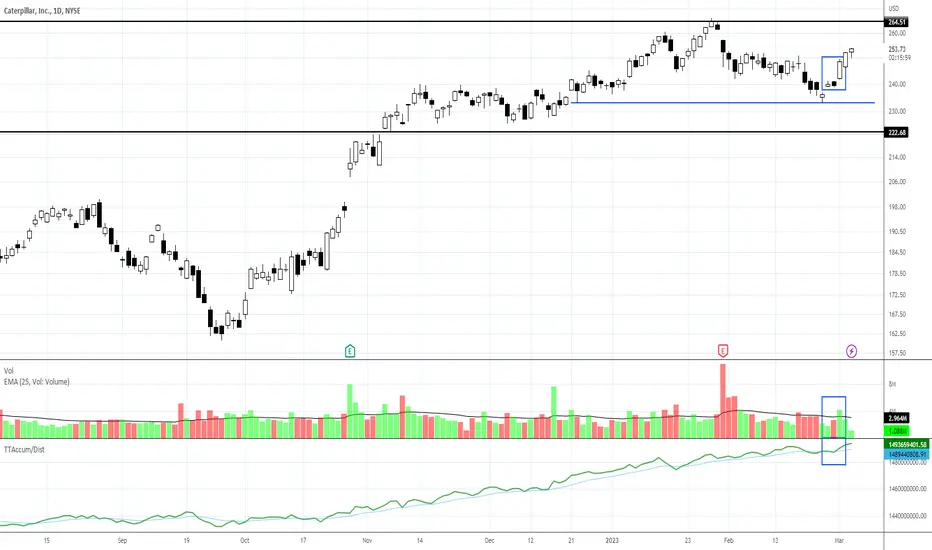
CAT: Range Bound Swing TradingCAT developed one of the entry signals I teach this week. The stock rebounded from testing the lows of the trading range. Hybrid indicators suggest large-lot buying is triggering in the lows of the range.
Point gain potential may be limited by the sideways trading range developing, but swing trading can be done within the range if you can catch the entry early in the upswing from the lows and plan to exit near the highs.
This trading range will need to compress near the highs to sustain a breakout to the upside.
CATERPILLAR SHORT 2 distinct possibilities, but the RR is great.
HIGHLY dependent on SnP and US30 ofcourse, broader market implications are always extremely important to keep an eye on.
Nonetheless, wouldn't be surprised to see the first position be a sweep of wicks and then retest of lows.
Second position would mean we sweep highs of wichs but also fill the gap above before we dump to retest lows.
Let's see.
NFA.

Caterpillar , buy opportunity Uptrend
Although market is not in a good trend but i suppose Caterpillar has started new rising wave and today i've entered by a small part of my equity.

[CAT] - Weekly - BearishATH liquidity PURGED.
RELs at $241.80 are too clean.
looking for a shift in market structure, with a break below the short term low at $225.56. Then looking at the bearish breaker acting as resistance, holding and pushing price down further.
Multiple inefficacies to the downside as targets and draws on liquidity.

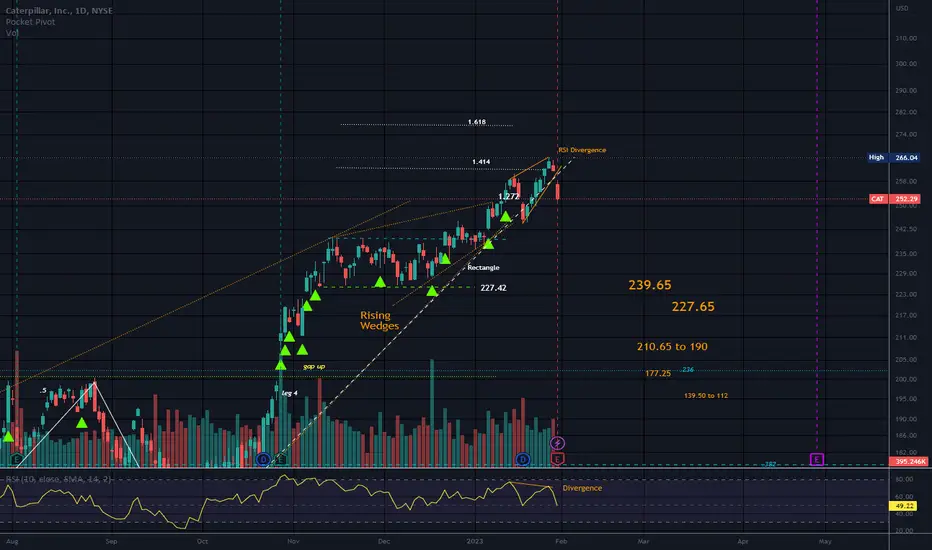
Rising Wedges/DivergenceCAT had earnings this morning. I am not sure but I think something was not as expected in the earnings report.
Bearish Rising wedges noted.
A bearish crooked W noted that reached just beyond the 1.414.
Market opened as I type and I see price fell out of the small rising wedge at the top. Rising wedges are valid only after the bottom trendline is broken.
There is a bearish divergence between price action and the oscillator, RSI.
Good luck/No recommendation.
Price is above the .236 of the trend up.
Rectangle below price that may provide support.
$CAT: low risk short ideaGood to try and short some stocks as well, here and there when buying things...In this case the stop is rather tight (see green dashed line) and downside ample, and as a bonus different to everything else out there.
Worth a shot, best of luck!
Cheers,
Ivan Labrie.

CAT targeting 300 initially...Caterpillar will probably touch the giant long term blue resistance once more around 300-320. If it can clear it, the golden top band top band above 675.

$CAT with a Neutral outlook following its earnings #Stocks The PEAD projected a Neutral outlook for $CAT after a Negative Under reaction following its earnings release placing the stock in drift D with an expected accuracy of 77.78%.

CATERPILLAR? BearishThe head and shoulders pattern is a technical analysis chart pattern that signals a potential reversal in a stock's trend. It is considered bearish because it shows a peak (left shoulder), followed by a higher peak (head), followed by another peak that is lower than the head (right shoulder). The pattern is confirmed when the stock price falls below the support line drawn between the two low points of the pattern, known as the "neckline." This breakdown signals a potential trend reversal and is often associated with a bearish outlook for the stock.
Having an earnings date around the time of a head and shoulders pattern can add to the bearish sentiment and potentially lead to a drop in stock price. This is because an earnings release can potentially cause a large price movement, and if the earnings are not as strong as expected, it can add to the bearish momentum and drive the price further down. The head and shoulders pattern, along with a weak earnings report, can increase the likelihood of bearish price movements. However, it is important to note that other factors such as overall market conditions, company-specific news, and analyst recommendations can also impact stock price movements.

Earnings watch tomorrow morningEarnings watch tomorrow, 1/31/2023 pre-market. Here's a 4hr ext chart comparison, with the tickerTracker MFI Oscillator set to 20, color coordinated with these 10 tickers.
CAT
GLW
SPOT
UPS
XOM
PSX
MCD
GM
PFE
MRO

CAT to break 52 week hiTf week price above 50 EMA , uptrend.
Then we want to buy only ,when the price break 52 week hi we open long position.
stop loss at low of super trend of that open bar chart.

Caterpillar , buy opportunity Uptrend
As previously has been pointed, It has a good trend and i still believe it's a good buying position to achieve 320

CAT Historically, CAT plummets after a dividend when sky-rocketing pre dividend. I'm expecting $10 - $15 drop over the next week and I think earning misses. Price target is the .618 Fib retracement at around $200 in the next few months.


CAT Short Good time for a starter position on CAT, the EV steam will wear off when the markets roll over.
