$CCL Major break of Downtrend for Carnival CorpEntry level$51.50 = Target price $57.75 = Stop loss $50
CCL trade ideas


CCL Carnival Corp nice bottom again and MACD divergence upThe MACD is right on the signal line and the divergence indicates the $47 level is where prices should be. Going to grab some 16 Aug 47.5 calls in the morning if the market behaves currently last trade was around 19c

CCL (CARNIVAL CRUISE LINES) ENTRYGOOD LOW RISK ENTRY ON CCL TODAY. ENTERED AT 45.70 BEFORE THE UPTICK. COMING OFF HISTORICAL SUPPORT AND SHOWING DIVERGENCE ON 4 HR TIME FRAME SO FAR.

CCL 8 & 6 RRR shorts on two timeframesTrading Methodology:
1. An asymmetric bullish/bearish pennant is drawn using ascending and descending curved trend lines with a minimum of three price action touche points per line. The direction is determined by the previous trend.
2. The angle tool is applied from the earliest two trend touch points, beginning at the earliest touch point.
3. A trend-based Fibonacci retracement triangle is drawn starting from the earliest trend touch point and ending at the earliest touch point of the opposite trend line .
4. Based on the degree, of the earlier defined angle, the appropriate (and secret) levels are selected for the fibonacci retracement ; two levels for stop-loss and two levels for take-profit. The closest stop-loss level to the current price level is the top priority stop-loss. Though the secondary stop-loss level is often chosen for some markets such as FX and some equities in order to account for seldom unexpected resistance breaks. The greater target level is the top priority, and where majority of the shares are sold, though some may choose to close part of the position at the first target level or set it to be the stop-loss once price exceeds it. Entries should be laddered in around the levels closest of the yellow line.
This trading strategy can be applied to any market and time frame, and positions most often garner the greatest risk-to-reward ratio with the highest success rate. What more can you ask for? I will only be posting my unique trading strategy until EOY. I work solely with price action to identify pennants and apply unique trend-based fibonacci retracement levels for SL and TP levels. Reach out to me if you have any questions.


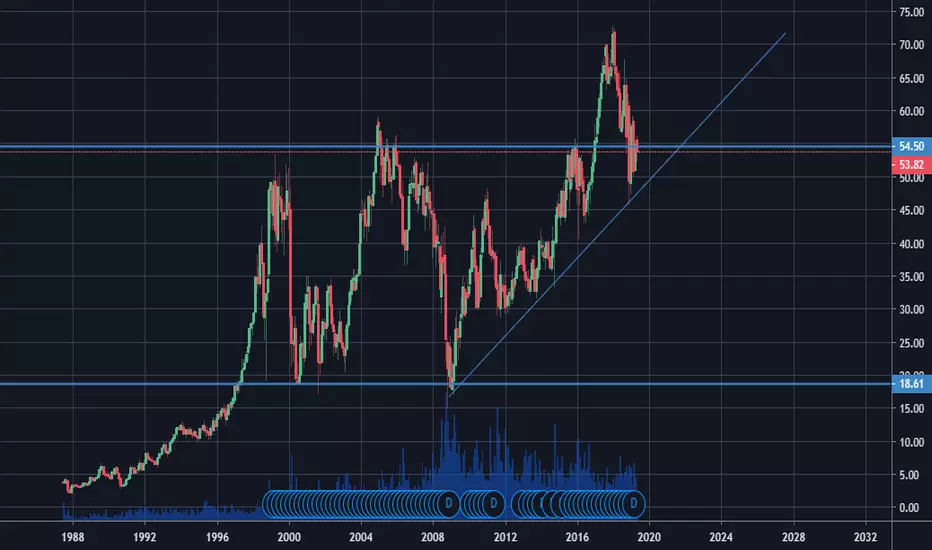
Retesting long-term consolidation level?Moment of truth. Either the price will hold this level ($50-55), or it will go below the trend line to area $40-45. I'll try to buy some @ $50-55, no SL, long-term only.
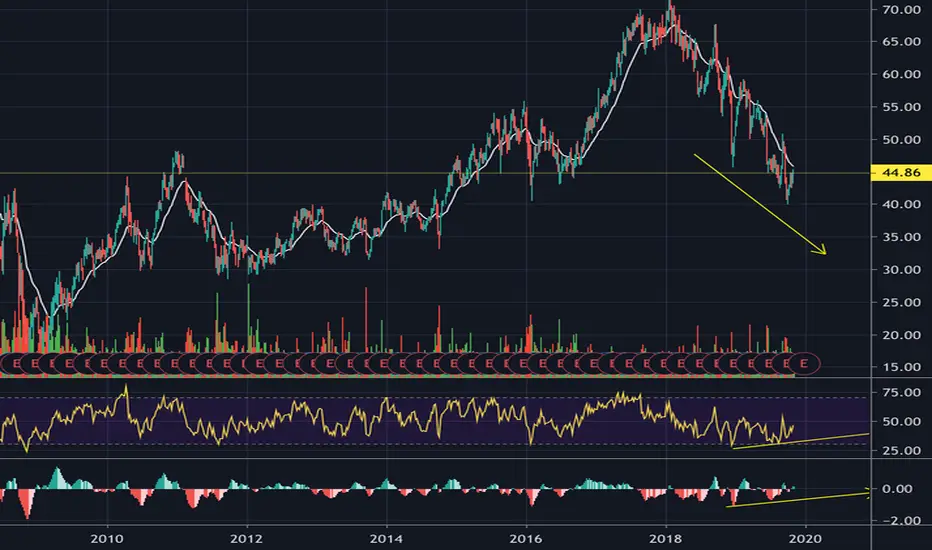
CCL: Long-term ABCD completed with downside risk at $53CCL had a good run since since 2014 but is flat-lining at the tail end of an extended ABCD formation. High of c.$73 was a stretched 138.2% CD extension with price action range bound since Sep 2017. CCL and competitors have been aggressively adding capacity over the last few years which you would expect severe operational deleveraging in the event of a dry spell. Min price target is a 38.2% retracement at c.$60 whereas base case would be a retest of the congestion zone around the $53 level.


CCL:(Long) FIB Resistance Speed Fan set for 9/27/18 EarningsFIB Resistance Origin: 56.45 (07/03/2018)
FIB Levels: 67.97; 68.19; 68.43; 68.68; 69.59; 69.98; 70.07; 70.76; 71.14; 71.76; 72.03; 72.44; 72.72; and 74.60 (Analyst PT 9/13/18)
For Educational Purposes Only.

CCL (Long) FIB Speed Resistance FanPrice Points: 56.45 (7/3/18) to 67.59; 69.95; 70.76, 71.11; 71.79; 72.70; and, 74.60(Analyst PT 9/13/18)
For Educational Purposes Only


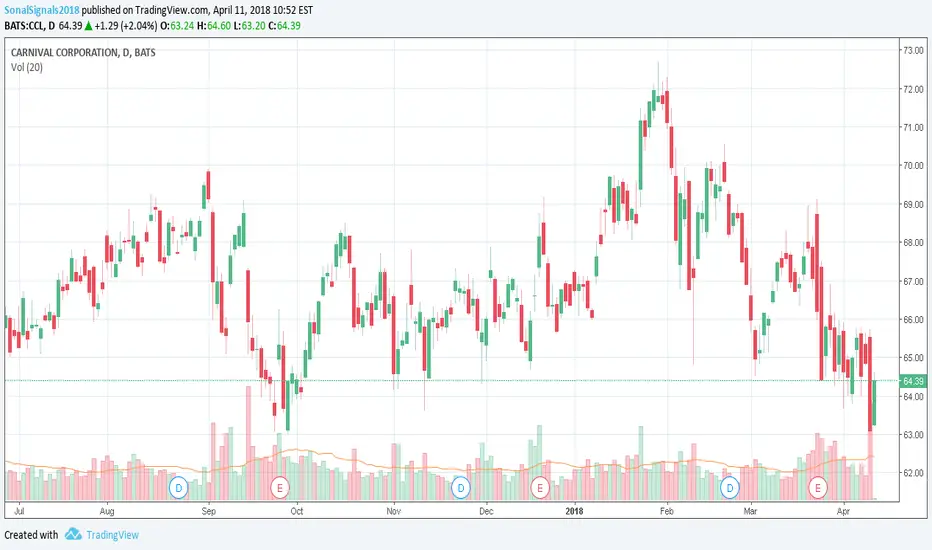
CCL Detected possible stock repurchase!!!CCL: carnival corp
2018-04-11 08:00:12
Detected possible stock repurchase