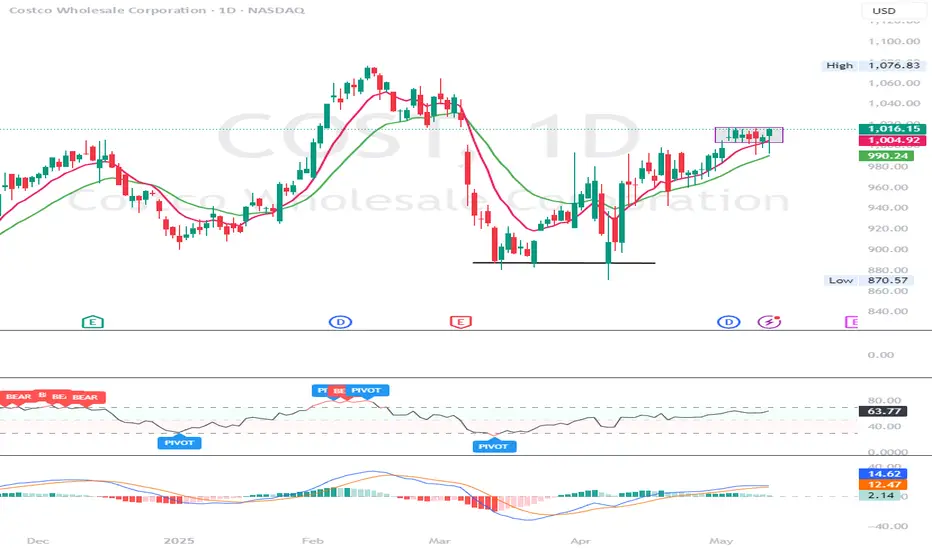
Costco readyNASDAQ:COST looks ready to move up to 1100
closed the gap from last earnings
bullish engulfing candle on the weekly and is breaking out of this 3 week range now
if it raises prices like NYSE:WMT did, might see a boost
Next report date
—
Report period
—
EPS estimate
—
Revenue estimate
—
17.17 USD
7.37 B USD
254.45 B USD
442.63 M
About Costco Wholesale
Sector
Industry
CEO
Roland M. Vachris
Website
Headquarters
Issaquah
Founded
1983
FIGI
BBG01MVBPLL4
Costco Wholesale Corp. engages in the provision of operation of membership warehouses through wholly owned subsidiaries. It operates through the following geographical segments: United States, Canada, and Other International Operations. The company was founded by James D. Sinegal and Jeffrey H. Brotman in 1983 and is headquartered in Issaquah, WA.

COST - breakout above $1020 steady uptrendCOST - stock in an steady uptrend but now consolidating and holding support well. Looking for calls on this one above $1020 for a breakout move higher. Next resistance at $1050 and $1075. Stock is strong on indicators. Stock has earnings end of the money could see $1110 pre earnings.
COSTCO: 4 touches/rejections. Can we pop over gap?Costco looks loaded.
4 touches along the resistance, looks like a big wedge forming. Next touch can be a break out to upside, fill gap and move with momentum upside.
OR
Green ray for the entry to downside. We got data tomorrow as well..
Do your DD! Not FA but let me know what you think!

Base Case Costco 810. Total company revenues were up 6% compared to a year ago. The Profit Margin of 2.9% was better than the longer-term average of 2.5%. A 90x multiple applied to a Sales Growth Rate of 9% would imply a share price 810. Costco's narrative revolves around execution. Considering the company continues to e

Costco (COST) Breakout Alert! Ready to Soar? Costco (COST) Breakout Alert! Ready to Soar?
Hey traders! Check out this bullish setup on Costco Wholesale (COST) . The stock just broke out above key resistance at $987.72 after a solid consolidation phase, with a clear target of $1,052.87 (+4.91% potential gain). The risk-reward ratio here is a

$COST Rising WedgeCost perfectly tagged the upper line of the rising wedge that we have seen play out over the past couple of weeks. I opened some puts at the top today in hopes that it breaks to the downside of this wedge for a target around $900. This would also complete the right shoulder of H&S on daily chart.

Ascending Wedge - Right ShoulderNASDAQ:COST is currently trading within a well defined ascending wedge that looks like it may be forming a right shoulder on the daily chart. Looking to get short near 1,020.

COST - breaking out gap fill above $1000COST - stock is about to enter the gap to $1026.50. looking for calls above $1000 for a move towards gap fill. Stock is moving strong with momentum but has rejected this area multiple times. key level to watch is 1k. Stock is decent on indicators.

$COST Getting TiiightCostco has been bouncing between these trendlines the past couple of days. I'm expecting a big move in either direction soon, but right now its 50/50. My lean on the longer time frame is to complete the H&S on the daily chart to the downside after potentially trying to fill the gap at 1020.

COST /LONG D1/WCasco is still in an upward trend in the upper half. It is trying to fill the gap. It is above the moving averages. And the moving average 20 is below the rest and one side up. My good friend. I would be happy if you follow me and leave me a comment.

See all ideas
Summarizing what the indicators are suggesting.
Neutral
SellBuy
Strong sellStrong buy
Strong sellSellNeutralBuyStrong buy
Neutral
SellBuy
Strong sellStrong buy
Strong sellSellNeutralBuyStrong buy
Neutral
SellBuy
Strong sellStrong buy
Strong sellSellNeutralBuyStrong buy
An aggregate view of professional's ratings.
Neutral
SellBuy
Strong sellStrong buy
Strong sellSellNeutralBuyStrong buy
Neutral
SellBuy
Strong sellStrong buy
Strong sellSellNeutralBuyStrong buy
Neutral
SellBuy
Strong sellStrong buy
Strong sellSellNeutralBuyStrong buy
Displays a symbol's price movements over previous years to identify recurring trends.
COST4977644
Costco Wholesale Corporation 1.75% 20-APR-2032Yield to maturity
4.85%
Maturity date
Apr 20, 2032
COST4977643
Costco Wholesale Corporation 1.6% 20-APR-2030Yield to maturity
4.58%
Maturity date
Apr 20, 2030
COST4977642
Costco Wholesale Corporation 1.375% 20-JUN-2027Yield to maturity
4.11%
Maturity date
Jun 20, 2027
COST4495548
Costco Wholesale Corporation 3.0% 18-MAY-2027Yield to maturity
4.02%
Maturity date
May 18, 2027
See all COST bonds
Curated watchlists where COST is featured.

Related stocks
Frequently Asked Questions
The current price of COST is 1,002.05 USD — it has increased by 10.97% in the past 24 hours. Watch COSTCO WHOLESALE CORP stock price performance more closely on the chart.
Depending on the exchange, the stock ticker may vary. For instance, on BVL exchange COSTCO WHOLESALE CORP stocks are traded under the ticker COST.
COST stock has risen by 10.97% compared to the previous week, the month change is a 10.97% rise, over the last year COSTCO WHOLESALE CORP has showed a 10.30% increase.
We've gathered analysts' opinions on COSTCO WHOLESALE CORP future price: according to them, COST price has a max estimate of 1,205.00 USD and a min estimate of 890.00 USD. Watch COST chart and read a more detailed COSTCO WHOLESALE CORP stock forecast: see what analysts think of COSTCO WHOLESALE CORP and suggest that you do with its stocks.
COST reached its all-time high on Feb 10, 2025 with the price of 1,052.00 USD, and its all-time low was 903.00 USD and was reached on Mar 14, 2025. View more price dynamics on COST chart.
See other stocks reaching their highest and lowest prices.
See other stocks reaching their highest and lowest prices.
COST stock is 9.88% volatile and has beta coefficient of 0.58. Track COSTCO WHOLESALE CORP stock price on the chart and check out the list of the most volatile stocks — is COSTCO WHOLESALE CORP there?
Today COSTCO WHOLESALE CORP has the market capitalization of 455.14 B, it has decreased by −0.67% over the last week.
Yes, you can track COSTCO WHOLESALE CORP financials in yearly and quarterly reports right on TradingView.
COSTCO WHOLESALE CORP is going to release the next earnings report on May 30, 2025. Keep track of upcoming events with our Earnings Calendar.
COST earnings for the last quarter are 4.02 USD per share, whereas the estimation was 4.09 USD resulting in a −1.77% surprise. The estimated earnings for the next quarter are 4.24 USD per share. See more details about COSTCO WHOLESALE CORP earnings.
COSTCO WHOLESALE CORP revenue for the last quarter amounts to 63.72 B USD, despite the estimated figure of 63.11 B USD. In the next quarter, revenue is expected to reach 63.12 B USD.
COST net income for the last quarter is 1.79 B USD, while the quarter before that showed 1.80 B USD of net income which accounts for −0.56% change. Track more COSTCO WHOLESALE CORP financial stats to get the full picture.
Yes, COST dividends are paid quarterly. The last dividend per share was 1.30 USD. As of today, Dividend Yield (TTM)% is 0.45%. Tracking COSTCO WHOLESALE CORP dividends might help you take more informed decisions.
COSTCO WHOLESALE CORP dividend yield was 0.49% in 2024, and payout ratio reached 26.32%. The year before the numbers were 0.71% and 27.12% correspondingly. See high-dividend stocks and find more opportunities for your portfolio.
As of May 18, 2025, the company has 333 K employees. See our rating of the largest employees — is COSTCO WHOLESALE CORP on this list?
EBITDA measures a company's operating performance, its growth signifies an improvement in the efficiency of a company. COSTCO WHOLESALE CORP EBITDA is 12.07 B USD, and current EBITDA margin is 4.53%. See more stats in COSTCO WHOLESALE CORP financial statements.
Like other stocks, COST shares are traded on stock exchanges, e.g. Nasdaq, Nyse, Euronext, and the easiest way to buy them is through an online stock broker. To do this, you need to open an account and follow a broker's procedures, then start trading. You can trade COSTCO WHOLESALE CORP stock right from TradingView charts — choose your broker and connect to your account.