$DIA - Trading Levels for March 14 2025
Are you guys ready?
The 35EMA - is a BEAST
Grab this chart and let's GO!!!
DIA trade ideas

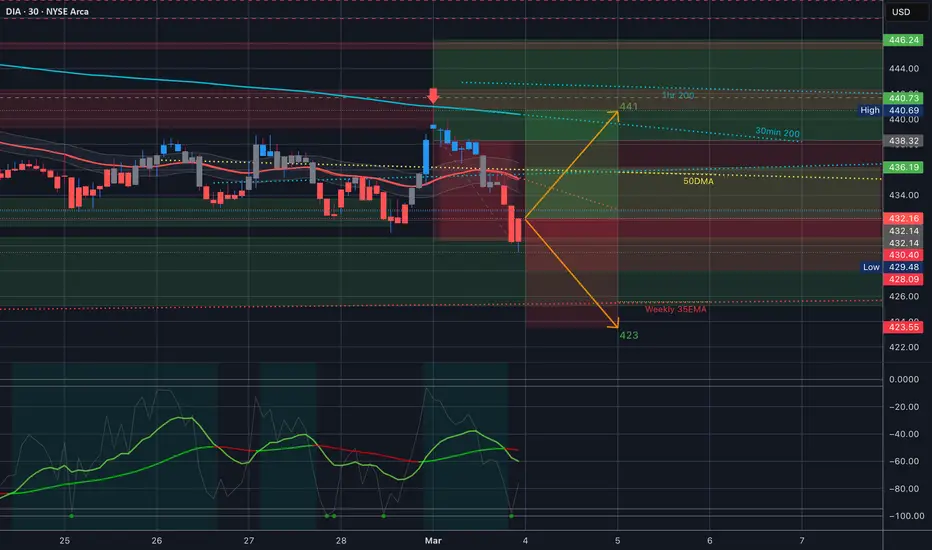
$DIA - Trading Levels for March 13 2025
That 35EMA LOL.
DIA being a leading indicator of market strength is flashing a warning signal here. If we don’t take it back above the 200DMA that will kill the momentum of the long bull run and we will go back down to the 200WMA.
I want that as we are long overdue for a correction but I also want to be careful to read the signals and not my bias. Let’s see how this weekly candle closes.

$DIA - Trading Levels for March 12 2025
Our trading range today here is completely underneath the Weekly 35EMA.
That is big. You know what happens when we close under that on the week, right 🫣
Ok I'm being a little dramatic but still - watch for a cross up on the indicator, looks like it could be a little divergent to give us a swing up today. maybe to the 200DMA

$DIA - Trading Levels for March 11 2025
So we are AT the 200DMA, and under it. So if we continue this momentum down and it becomes resistance than the next support is at 400.
Ok with that out of the way, today’s trading range is between 409 and 431 based on Fridays contract. That is UNDER the weekly trading range with that low of 418
We still have some upward momentum on the 200DMA which makes me think we stay flat-ish (as flat as you can with volatility so high)
You typically don’t want to go short at an upward facing moving average.

$DIA Trading Levels for March 7 2025
That Weekly 35EMA is in focus and it’s a big level and it’s going right through the center of the trading range. I’m expecting a fight here to hold this level, even if for a technical bounce. If there’s no technical bounce here than things are worse than we think.
Let’s goooooo!!!

$DIA Analysis, Key Levels & Targets for March 6th 2025
WEEKLY 35EMA is an important level to hold here. You can see the two time we bounced on it this week.

$SPX Analysis, Key Levels & Targets for March 5th 2025
What is running through the trading range today?
We are sitting right on the 35EMA (weekly) and if that breaks the next support is at 418.
The 430 was the original bottom of the trading range for the week we’re not too far from that.

$DIA Analysis, Key Levels & Targets for March 4rd
Holy smokes, if you can read this you’re one of my master students… LOL!!
I just don’t feel like writing a description - if you know you know.
$DIA Analysis, Key Levels & Targets for March 3rd
Alright, y’all… I am still sick and still dealing with the fatigue so I’m not going to write a whole lot but here are the levels for today
You know what to do with them… lol
And we will go over it all tonight.
Don’t forget to hit the “Grab this Chart” button under this chart is you want to use it.

$DIA - Analysis Key Levels and Targets for Feb 25
We do have some quite larger bull gaps in the lower part of the trading range here for support and you can tell it was support already yesterday
And then the 50 Day moving average is above us and you can see that it was resistance yesterday. Top of the trading range has a town gap and a potential 4hr 200MA 30min 200 brawl.
Don’t forget to grab this chart - the button under the chart that says “grab this chart” and lets goooo….

$DIA - Resistance at the 50Day Moving Average
Don’t go long at a Downward Facing 50 Day moving average - we haven’t turned it yet.
Resistance at the 50 Day moving average, and support at the up gap just below us.
35EMA is moving in toward the 50 Day. We could bounce here but likely not very far until that 50Day turns upward. If the 35EMA slides under it look lower into those gaps.

$DIA Analysis, Key Levels & Targets for Feb 24
50 Day moving average in focus. Futures putting us right at that level at open.
Two bull gaps below us, Bear gap above us.
If that 35EMA falls underneath the 50 day MA that would be BAD. It probably won’t but if it does watch out, y’all.
The entire weeks trading range is underneath that downward curving 30min 200 MA.
Should be a wild week.
Don’t forget to grab your chart and let’s GOOO!!!

$DIA Recap of Last Week Feb 18-21
Have you noticed that when the Dow goes bearish it’s like a leading indicator for the others? At least the last few times. We opened the week with a bearish moving average setup (the 35EMA UNDER the 30min 200MA)
So Last Week we opened the week on Tuesday under both the 30min 200 and the 35EMA
Wednesday we closed above the 30min 200MA but the MA’s closed bearish and then Thursday we gapped down to the 1hr 200
Friday we gapped under the 1hr down to the Downward facing 50 Day MA and broke that level.
We did NOT close within the expected move for the week at all.
The DOWNWARD FACING 50 DAY MOVING AVERAGE showed everyone who’s bass last week.

BOOM!!! $DIA Downward Facing Moving Average Hit Target!!
Don’t take a Downward facing 50 Day moving Average lightly!!
Good Game, y’all. Good Game.

$DIA Analysis, Key Levels & Targets for Feb 21
Downward Facing 50 Day Moving Average.
That is all I have to say. LOL.
Yesterday we bounced on the bottom of the implied move for the week and came up from there. So 439 is a level to watch.
1hr 200MA momentum should keep us within the trading range today, but that 50DMA could keep us near the lower end.
Have a great weekend, y'all

$DIA Analysis, Key Levels & Targets for Feb 20
The 35EMA is under the 30min 200MA (That is a bearish setup to start the day)
30min 200 curling down and the 50DMA is underneath the trading range for the week pointing down also.
That 1hr 200MA at the bottom right of the trading range is looking ripe for a hit.

$DIA Analysis, Key Levels & Targets for Feb 18
Welcome back, y’all. We just had a 3 day weekend so we got an extra day of theta burn if you had any spreads on over the weekend.
So This weeks Trading Range doesn’t look too complicated but I do want to draw attention to TWO things.
FIRST - in the trading range - The moving averages are bearish here. The 35EMA is under the 30min 200MA.
SECOND - the 50DMA is facing DOWN.
The 30min 200MA and the 35EMA are running together.
These two things are enough to keep us flat or down on the week while we either meet up with the 50DMA or wait for it to catch up.
Outside of that resistance and support are labeled.
Expected move on the week is 439-450
Let’s go !!

$DIA Analysis, Key Levels & Targets for Day Traders Feb 14
Bearish MA’s
Green signal line
Looks like we’re gonna close the week within the implied move on the week…
I’m beginning to like the Friday contract and that’s opening a lot of other tickers to play. I still love 0dte but that 5dte or 7dte really because I’d play it from the Friday before.
Anyway I’m rambling and it’s 9:30 so let’s TRADE

$DIA Analysis, Key Levels & Targets for Day Traders Feb 13 AMEX:DIA Analysis, Key Levels & Targets for Day Traders Feb 13
50DMA pointing down and 35EMA under the 30min 200. That’s everything you need to know LOL
Ok so 35EMA under the 30min 200, that’s bearish so look to those levels as resistance today. If we get above it the top of the expected move of 448.
Underneath the bottom of the expected move is 441 (for the weak which is bounced on yesterday, and then for today 439.
Under all of that the 50DMA and the 1hr which look like a beautiful target below with the crossing momentum’s
Let's make some money today, y'all!!

$DIA Analysis, Key Levels & Targets for Day Traders Feb 12 AMEX:DIA Analysis, Key Levels & Targets for Day Traders Feb 12
This is such an interesting chart with that downward facing 50DMA.
Green Signal Line, Bearish 35EMA
Support around 443 at the gap from the week open
Still trading well within the expected move.
GL, y’all lets see what inflation looks like today!!

$DIA Analysis, Key Levels & Targets for Day Traders for Feb 10 2AMEX:DIA Analysis, Key Levels & Targets for Day Traders for Feb 10 2025
Red signal line.
Expected move between 435-450 for the week….
I don’t have a whole lot to say about this at the moment but as the week moves on I will add. DIA is definitely at a critical level here

$DIA Analysis, Key Levels & Targets for Day Traders Feb 11 25
So we got that bearish cross down yesterday. We have been consolidating back to the 30min 200MA and yesterday the 35EMA went under the 200 and then we saw that crossover as resistance. So look to the 35EMA as resistance for now.
50 Day moving average is under us and pointing down - that is bearish

$DIA Analysis, Key Levels & Targets for Day Traders for Feb 7 20AMEX:DIA Analysis, Key Levels & Targets for Day Traders for Feb 7 2025
Today’s implied move is well within the weekly implied move here!!
We’re still seeing 450 as resistance and trying to find support on the 35EMA
444-451 on the day to close within the implied move for the week
also take a look at that red signal line on the bottom indicator
