Europe head and shoulders--weak industrial productionBearish divergence daily. Pattern is technically a head and shoulders. Close to neckline. If right 61.50 could be in the works next week. Weak numbers in Eurozone and england say regardless brexit risk Europe is in trouble. Shortby The_dumpster_diverPublished 1
Keep an eye on this oneGood day folks, I am currently working on my watch-list for this year, and I found this chart very interesting. Of course, this is a very long time-frame and things could change drastically, but there is information on it that raises pertinent questions about what is going on in the market ATM. EFA is in a triangle within a larger triangle, and it just bounced from its channel support. There is 2 possibilities IMO: the market continues down, the uptrend is over and the recession hits, or the channel holds, the price goes up to the top of the triangle, hits the resistance around 70 (flattening), then reverse to crash in 2022-2023. Is this chart going to predict the future? Maybe not, but I will certainly keep an eye on it. After all, this is a very long time-frame and the patterns are very clear, so I must give it some credit. Thank you, by tipere445Published 0
EFA 18 MONTH HS TOP REVERSALEFA is an etf tracking MSCI EAFE. There is an 18 month Head & Shoulder pattern that has been broken already with a nice bullish candleShortby alik472Published 1
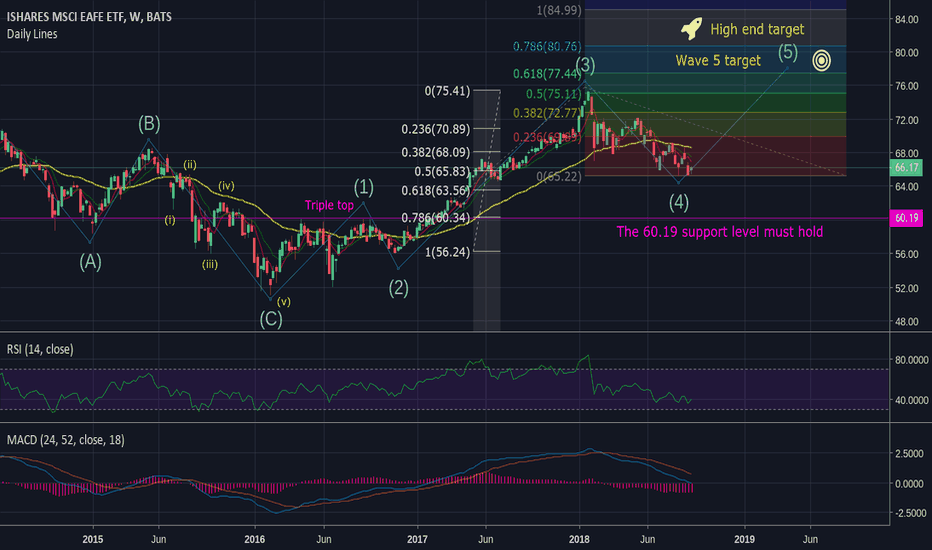
EFA: Long term price target of 77 - 85Dear all, from the years long chart with weekly candlesticks we can see that after completing the 5/15 - 2/16 correction EFA made a triple top on April as well as September (twice) 2016 before finally breaking out in March of 2017 into a powerful 3rd wave that has since given way to a wave 4 down. With EFA currently at 66.17 Wave 4 has retraced near perfectly to within 34 cents of a 50% retracement of the magnitude of wave 3 (65.83). Please see this level within the white colored narrow Fibonacci spread which represents the span of wave 3. Though I would not be surprised to see further decline in price I would expect support at the 61.8% retracement level; 63.56, if she dips any further than that 60.19 (represented by the horizontal magenta line) must not break otherwise the wave count would be invalidated by the trough of "wave 4" dipping into the peak of "wave 1" note that I do not expect this scenario to play out. Based on current price levels we can expect with seventy percent certainty to see a wave 5 up which will take EFA to 77.44 and potentially even as high as 85. It is also plausible we would see a truncated wave 5 based on the mellow wave 1 and the notion that wave 5s resemble the wave 1 of their respective wave count, we will see. A further dip in price will require a re-calibration of the upside targets and if necessary I will do so in a few months time. Thanks for reading this post, criticisms and question are welcome. Longby TNasrUpdated 1
EFA weekly view.First I found the channel. Then I took the swing high during the week of 3-19-18, that went out of that channel and place a vertical line there to find the next potential area for support as it intersects with the lower channel. And last week's candle held up around that area @ 69.05. Then I placed a vertical line on the previous swing low during the week of 1-22-18, and where it intersects with the channel, that's where I'm looking for the next possible area of resistance @ the 70.73 area.by ForExtraPipsPublished 1
EFA weekly anglesI connected the last two weeks highs and lows with two trend lines. Then I placed a vertical line for this week's time line. And where they intersect at is my area of interest for support and resistance. Price is currently sitting right on support at 71.69. by ForExtraPipsPublished 1
Ascending TriangleDelta Wave in progress, should breakout in next 4 weeks, PT1: 77, expecting continutation of Major trend PT2: ≥89, which is validated by previous symmetrical measuring rule.Longby Jrussell86Published 1
OPENING: EFA JUNE/SEPT 66/71/71/76 DOUBLE DIAGONAL... for an .83/contract credit. Notes: I seem to be on a double diagonal kick of late ... . Will look to take profit at 20% of the width of the wings/roll the short straddle aspect at 25% max or at 21-25 DTE.by NaughtyPinesUpdated 5
EFA - 4hrI'm going flat today. Targets reached with confirming negative divergence. Can it leak higher? Sure, a bit. I'm primarily expecting consolidation into the mid-60s with support between 76.4% and 100% fib extensions shown in green. See earlier ideas linked below.by nick.holland78Published 112
EFA Symmetrical triangle breakoutEFA has broken out of symmetrical triangle well before apex indicating very bullish move. Measuring rule implies potential gain of $56.61 or 89% from breakout. MACD also breaking out of downtrend since 2007. Longby Jrussell86Published 1
EFA - 4hAs long as support holds EFA should extend higher in wave 3. As much as 8-12% higher from here.Longby nick.holland78Published 3
Neutral trade on EFA (Laddered Straddles)I didn't have any positions on EFA and With IV Rank at 47, I wanted to sell some premium. We are out of the ideal 45 days expiration window and since my portfolio theta is pretty low right now I decided to do laddered straddles. Selling the 62 Straddle with 32 days to expiration and another one with 60 days to expiration. This will give us an avg date of expiration of 46. I got a total of $526 in credit. This is close to a 50% chance trade, but I will look to take profit early to increase my probabilities. by AlexanderGotayUpdated 15
EFA - 4hrUpdated with log-based fibs. White count is my basecase. Wave 2 got so deep I had to calculate sub-waves of white 3 to refine the targets (shown in green to match fibs). Nice reaction these past few days with extreme positive divergence on MACD, several timeframes. Blue corrective count is still valid as well, so caution is warranted between ~61-65 region. Should price reach there and fail to hold support I'll revisit again. Breaking down below 56.11 would be suggestive of something like my red count, but that's not my expectation.Longby nick.holland78Published 335
GET OUT OF THE S&P RUT: LOOK AT ETF'S AND INDIESIf you have ever spent more than a few hours in the Stocks and Indices chat room, you'll soon get the impression that the trading universe is seemingly made up primarily of E-Mini S&P Futures, SPX CFD's, and/or SPY (I probably exaggerate a touch, but that's the overall impression I get), along with a repeated frustration with the way the S&P is behaving in one way or another: the old "it shouldn't be here," "a correction is due," "who's buying way up here," etc. In short, some are frustrated, for various reasons, with the S&P or other broad U.S. market instruments. Well, there's hope for you out there ... . And that's because the trading universe is made up of a ton of instruments that focus on various sectors, various markets, and individual companies. Naturally, some of these don't trade 24/5 like SPX500 or /ES, but if you can't figure out how the S&P, /ES, or SPX500 should be traded here, you should quit banging your head against the wall and move on to other instruments. (Unless you enjoy banging your head against a wall ... ). Some of the more obvious things to look at are naturally instruments like GLD (the gold ETF), SLV (the silver ETF), and TLT (the treasuries ETF). For non-US broad market exposure, look at things like EFA (the world market, ex. Canada and the U.S. ETF) and EEM (the emerging markets ETF). And for U.S. equities sector exposure, look at sector SPDR's, such as XME (mining), XBI (biotech), XRT (retail), XLF (financials), etc. Naturally, getting into individual stocks can be a bit of a slog due to the number of companies involved. However, you can contract that universe to liquid stocks trading an average than 2 million shares daily and that are within the price range you want to devote to a play.by NaughtyPinesUpdated 1
EFA - 1hrSmells like distribution. Taking profits from 27 June entry. Note negative divergence on technicals. See also SPY and IWM ideas.by nick.holland78Published 3