$F Ford Motors Low Risk/Reward Trade
Yesterdays decline post earnings may have given a great opportunity,
the stock retraced to the 100ma and found support , below which can now act as a Stop Loss area for a long trade.
This gives us a very good r/r with a potential run back to the gap fill .
F trade ideas

Stocks - FordIdea for Ford Motor Company:
- We believe that a macro turn is here.
- As the global economy moves toward Stagflation, and perhaps Deflation, investors will decrease their risk appetite appropriate for a Goldilocks economy, and will rotate from Momentum and Consumer Discretionary stocks to Quality, Consumer Staples, Utilities, Dividend Yields, and Defensives stocks.
- We believe that Ford is an excellent defensive stock, traditionally being a dividend yielding stock and having being in operation for over 100 years.
- Ford is a good pick even before moving into a Stagflation economy, because they have exposure to the Tech and Industrials sector, with their introduction of EVs, and their 13.9% US market share of the automobile industry, coming second only to GM.
- Ford transitioned away from sedans, and announced that almost 90% of its North American model selection will consist of trucks and commercial vehicles. We believe that this is a most excellent choice, and are impressed by this decision making.
- We foresee a ravenous appetite in the supply chain sector, due to (a) COVID shipping backlog, which will only increase should COVID mutate and cause further lockdowns, (b) nations moving toward domestic production, which will increase intranational logistics and infrastructure demands, and (c) a shift from a software-oriented tech boom to a boom in the industrials and capital goods sector, from what we perceive is being attempted with the US stimulus packages.
- The price is technically in what appears to be a Wyckoff Accumulation Cycle, and is showing signs of strength.
- We believe that a better entry is possible, as it tests support levels during market volatility which we expect, but still it is a good entry point for a longer time-frame.
GLHF,
DPT
Disclaimer:
We absolutely do not provide financial advice in any shape or form. We do not recommend investing based on our opinions and strongly cautions that securities trading and investment involves high risk and that you can lose a lot of money. Loss of principal is possible. We do not recommend risking money you cannot afford to lose. We do not guarantee future performance nor accuracy in historical analyses. We are not registered investment advisors. Our ideas, opinions and statements are not a substitute for professional investment advice. We provide ideas containing impersonal market observations and our opinions. Our speculations may be used in preparation to form your own ideas.


FordChart pattern: Support trade
Entry: Immediately
Stop: 10.90$
Description: The chart is at a crucial support level and shows a positive divergence with the RSI and MACD.

Ford Motor Co.Friday, 30 April 2021
00:005 AM (WIB)
FORD still in the huge downtrend movement after unpredictable there are so many holders start selling. It doesn't matter. I could add more purchase when the price has reach the base ground support.
Best regards,
RyodaBrainless
"Live to Ride and Ride to Live"

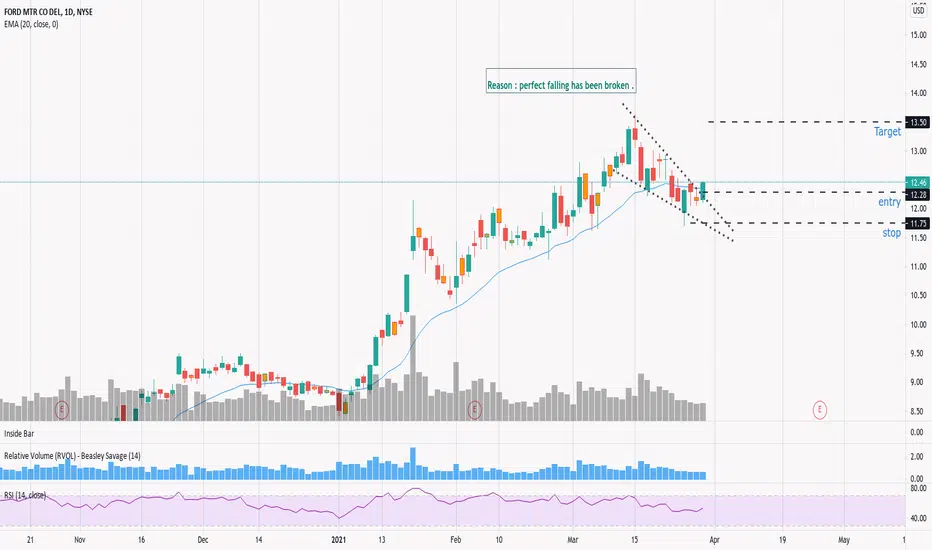
Ford in big trouble!ford just gets out of a 1-year bullish channel.
Yesterday I published an analysis for my private followers and predicted a price drop after an earning call that beats estimates..!
How is it possible?
Don't you believe it?
Check this:
In a normal situation, I would not doubt to publish a long (buy) analysis on Ford with this chart setting.
What makes me concern is the earning call ahead, and its unpredictable results!
I believe Numbers are better than the estimate, but there were a lot of companies with better than expected numbers and 5-7% price drops after earning calls!


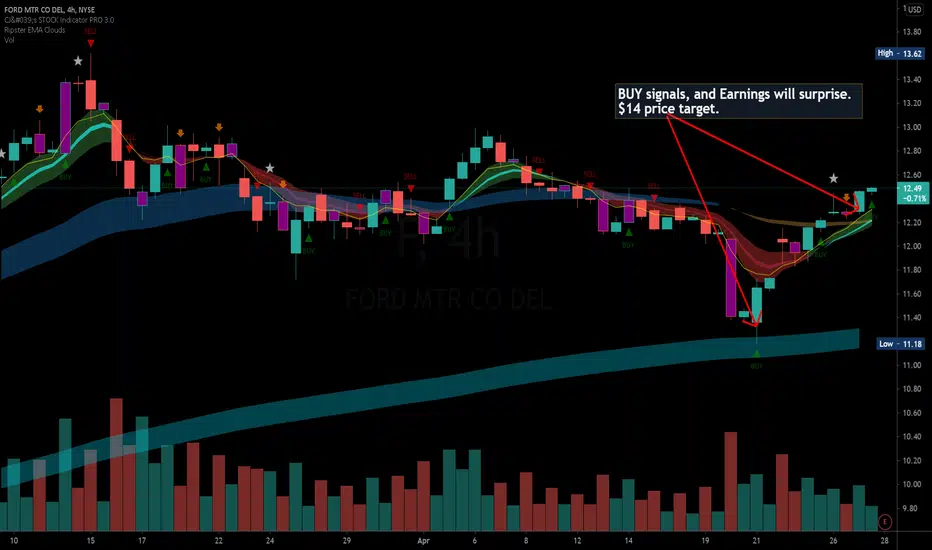
Ford will come through and surprise??$F flashed two BUY signals.
Surprisingly high PUT volume on it, but I'm contrarian here.
To find out more about The Ultimate Stock Indicator on Tradingview, please check my public profile. 🚀🚀🚀🚀
Swing it !EMA 21 Weekly + EMA 50 Daily as supports
Earnings next week
The discending channel shows a negative price action.

Keep an eye on Ford. Daily chart on Ford is looking very bullish. Earnings coming up could be the catalyst this stock needs to push higher. MACD is closing red and the RSI is heading up. Look how we gaped up today and with market conditions looking much better we can see this stock go higher. Recently saw the new Mustang MACH E and it looks alright. Have been seeing Ford Broncos on the road more here in LA and earnings will be interesting to see how the company has been dealing with the Chip shortage. We can see more down time, but that will be short lived.

Ford looking good in 4 hour chart, BUT!!!!!Ford is primed and ready to ascend, but be mindful that volume is down. Without volume it is harder to ascend. Invest wisely and GOOD LUCK.

Ford is a great long term holdFord has survived through everything for hundreds of years. They are one of the longest surviving companies out there and are still doing great! With the new CEO Jim Farley they are undoubtedly due to break out here soon and see new highs. Ford has completely changed their entire lineup to EV in a years time and have already proven these cars are capable to stand up to the competition. I am very bullish on Ford long term and I think they will continue to climb as the sales come in for the new EV lineup. There is also a new Ford Maverick being produced which will be a fully electric truck at around $20,000! Absolutely incredible. I have full faith in Ford to pull through in the race for electric vehicles as they always have. The stock is considerably undervalued currently and my price target is $25.

Ford potential pennant, continuation of long-term upward trendFord has been in a long-term uptrend since its lows in March 2020. With a new, dynamic CEO, and huge EV investment, the legacy car maker is highly underappreciated. The trend has slowed recently and a pennant has begun to form as a result of narratives around the chip shortage which was addressed at the last earnings. However, the price action over the last couple of months are beginning to draw the pennant and last time the 50 day moving average was touched - as happened today - we saw a bounce within the pennant configuration. I would expect the long-term uptrend to continue, and in the short-term would see a bounce from this level. Breakout imminent, either into- or post-earnings at the end of this month. Watching closely over next few days for pattern confirmation.

Opinion on FordAnother vehicle company that could move up but i am not as confindent in this one right now.
looks to be consolidating in the symmetrical triangle.
no position. Awaiting to see if it breaks the triangle and goes down.
will maybe consider entry on breakout and re test of support levels.
first price target of 12.50 and 13 if bull holds.
personally not a fan of car plays since i think the EV field has more potential, but F has shown promise in that field.
not financial advice. DYOR.

FORD MTR CO DEL 15MNBullish BAT for SCALPING Strong POTENTIAL REVERSAL ZONE
price need to follow Green Trend line & hit target
If price Breaks Red Trend line is where EXIT before SL hits
POTENTIAL BUY

FORD MTR CO DEL 1HRBULLISH BAT
price need to follow Green Trend line & hit target
If price Breaks Red Trend line is where EXIT before SL hits
POTENTIAL BUY

F / FORD LONG POSITION
PRICE 12.5 $
TP 36.17$
STOP LOSE 1 50% / 11.63 $
STOP LOSE 1 50% / 10.30 $
GOOD LOCK

F LongPrice has been printing higher highs and higher lows on the 1hr time frame. 12.50 support and 200ema (gray) seems to be holding support pretty well. Entry zone at 12.56 - 12.37 zone.
There is still a chance for price to go lower at 12.03 to form double bottom (bullish) and 11.73 is the last support. Break this for a bearish sentiment.

F: Bullish Flag (32%), Ascending Triangle (67%)Primary Target (short term)
Bullish Flag, confirmed (32%)
PT = 14.50$
Secondary Target (Long term):
Ascending Triangle, confirmed (67%)
PT = 15.94$

Ford Testing resistance. Long on Ford and looking at the daily chart you can see that ford is testing resistance right now, and the MACD is about to turn green. RSI is steady starting to point up and Earnings are not that far off. Passed thru a dealer and saw the mustang Mach E. doesnt really look like a mustang but its okay. Would not be surprised to hear something about the chip shortage affecting there production. Either way i see this running into the twenties in the coming year.

Ford - Short Term Bearish1) Bearish divergence (white lines).
2) Falling wedge failed breakout (couldn't break above the .382 fib).
3) 9EMA crossing below the 21EMA (bearish indicator).
I think we'll fall to around 11.60-11.11.70. This is the 51EMA as well as the support we bounced off of on 3/25. If we bounce off this level, I'll go long. It'd be a nice double bottom.
I will not short Ford. I'm just waiting for a long entry, and the daily chart says that this is not the time.

FORDTuesday, 30 March 2021
13:46 PM (WIB)
When Mr. Joe Bidden announced the needs for Electrical Vehicles in USO (Universal Service Obligation) scale projection, and Ford with General Motors win this project, I start to purchase Ford when the price still at $10. So I want to add more purchase when the timing is right for Ford. And will keep them alive for 5 or even 10 years from now. In Retrospective, I am a big fan of Ford. So this will be historical movement for my own investment.
Best regards,
RyodaBrainless
"Live to Ride and Ride to Live"
