FORD MOTORS CO.Saturday, 13 February 2021
18:33 PM (WIB)
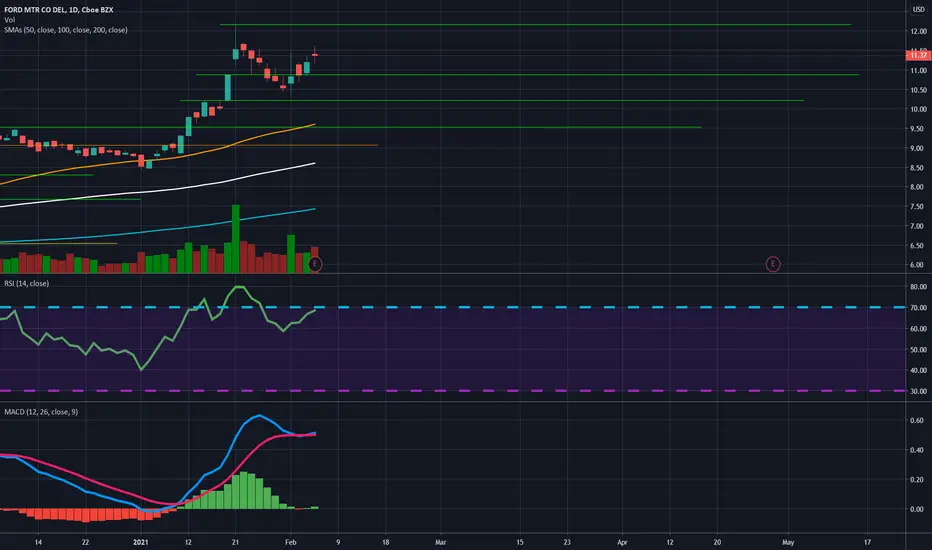
Ford will still in a bearish trend until next week.
Best regards,
RyodaBrainless
"Live to Ride and Ride to Live"
F trade ideas


$F Wave CI like $F to chop in this area for a week or two. I'm playing with some weekly long puts. Plan to exit near the bottom of this triangle, though wave C could extend beyond. Not trading advice!

$F : This Stock Can Change Your Life If Invest TodayWhat does F mean in stocks?
When the F symbol is listed at the end of a stock market listing, it indicates that the stock is a foreign stock, meaning it is based outside of the United States. The F symbol is one of the additional descriptors for labels that are used with stocks listed on both the New York Stock Exchange (NYSE) and NASDAQ.
Is Ford stock a good buy right now?
The RS Rating for Ford stock is now an 83. That means Ford has outperformed 83% of stocks over the past year. Elite growth stocks boast even higher scores, but this is a positive development for Ford.
Does Ford have a future?
While Hackett has announced a renewed emphasis on electric cars and hybrids, with an announcement in 2018 that Ford would release 40 nongas cars by 2022, this is the first tangible evidence of his strategy—and the first evidence of how his emphasis on the Ideo brand of design thinking might pay off for the 116-year-old
Is Ford making money?
Automotive. Ford makes the majority of its money by selling cars. ... Ford's relative success domestically is its biggest buffer against its poor performance in international markets. In 2018, Ford earned EBIT of $7.61 billion in North America, up slightly from about $7.26 billion over the same period last year.
New Ford CEO Takes Over; Announces Executive Changes
On Oct. 1, COO James Farley took the helm as Ford's CEO. His tenure began with a shake-up of key leadership roles. Ford announced Tim Stone is vacating his role as CFO. He was replaced by John Lawler, who recently oversaw Ford's autonomous vehicle unit.
Along with Farley's new position came a ramp-up in Ford's intent to invest more in emerging technologies, including autonomous vehicles, electric cars and software-as-a-service capabilities. Ford stock investors have welcomed the changes, with shares almost doubling from last October through early February.
Farley stepped in after disappointing results in Hackett's three-year bid to reshape the automaker. The centerpiece of Hackett's tenure was an $11 billion restructuring plan. That plan ran into major roadblocks when Ford botched the redesign and launch of its popular Explorer SUV in 2019.
All in all, Ford stock declined roughly 60% during Hackett's time as CEO.
In addition to C-suite changes, Ford announced last July it was resurrecting its iconic line of Ford Bronco SUVs. Production of the new Bronco lineup will include two-door and four-door models, as well as a smaller Bronco Sport edition. Consumers can now see some of the new Bronco models, set to hit showrooms in May 2021, online.
Bronco Relaunch Part Of New Strategy
The relaunch of the Bronco SUV — which was discontinued in 1996 — is part of Ford's overall strategic initiative to capitalize on its iconic brand lineup to boost U.S. revenue and earnings.
Ford President of the Americas & International Markets Group Kumar Galhotra told CNBC last July he expects annual unit sales of the new Ford Bronco series to be "in the hundreds of thousands." The Bronco SUV family is set to directly compete against the popular Jeep brand owned by Fiat Chrysler (FCAU).
The revival of the popular Bronco vehicle models came just weeks after the Detroit-based car company unveiled details of the latest version of its top-selling Ford F-150 pickup truck in late June. The truck is the first Ford vehicle to support over-the-air software updates, first pioneered by Tesla (TSLA) in 2012.
Ford Stock Fundamental Analysis
To determine whether Ford stock is a buy now, fundamental and technical analysis is key.
The IBD Stock Checkup tool shows Ford stock has an IBD Composite Rating of 96 out of a best-possible 99. The rating means Ford stock ranks very well vs. all stocks, in terms of the most important fundamental and technical stock-picking criteria.
But Ford stock has an EPS Rating of 75 out of 99, which compares quarterly and annual earnings-per-share growth with all other stocks. While that score could be better, it has improved since the last quarterly report. Ford has a spotty earnings track record, with many quarters of earnings declines over the past decade.
The rankings place the car manufacturer in the No. 2 spot vs. its automotive industry peers. Tesla (TSLA) currently holds the No. 1 rank in IBD's Auto Manufacturing industry group. Recent IPO Arcimoto (FUV) is ranked third.
Ford Stock Technical Analysis
Ford cleared a 9.60 buy point on Jan. 12 as shares surged more than 5% in heavy volume. Investors also could view the current consolidation as a handle on a base going back to Ford's December 2019 peak. The 5% buy zone extended to 10.08.
Ford stock offered an early entry prior to this traditional breakout. In the second week of 2021, Ford staged an upside reversal at its 10-week moving average.
Shares of Ford quickly climbed as much as 28% from their 9.60 breakout, boosted by a gain of more than 6% on Jan. 21. This price action triggered the 8-week hold rule, which allows a stock more leeway to climb before a definitive sell signal emerges.
Additionally, Ford's Relative Strength Rating has improved alongside the stock's share-price gains. The RS Rating for Ford stock is now an 83. That means Ford has outperformed 83% of stocks over the past year. Elite growth stocks boast even higher scores, but this is a positive development for Ford.
Ford's relative strength line — which measures price performance vs. the S&P 500 — is at its highest levels in about 16 months, which is another bullish signal for this earnings turnaround play.
It's important to note that Ford has underperformed the S&P 500 for the better part of the last decade. But looking at a monthly chart, Ford is now solidly above its 24-month moving average.
Closes above that level for the months of November, December and January are a big step in the right direction. But it's not necessarily a fail-safe sign Ford will continue to move higher from here.
Ford Stock: A Buy Right Now?
Ford stock has yet to break its long-term downtrend going back to 1999. However, shares are surging after finding support at key levels. As for the fundamentals, Ford sales and profits are rebounding. The company is moving more into electric vehicles, too.
Those who bought the stock coming out of the flat base in mid-January are likely basing their purchase on strong 2021 estimates.
Bottom line: Ford stock is extended from a proper buy zone. Positive earnings have lifted Ford stock near three-year highs. A pullback to the 21-day line could offer an alternate entry point for investors who want to add to an existing position or even start a new one.
With dollar volume above the $600 million threshold, this low-priced stock also shows strong institutional sponsorship. Even with improving earnings, investors may want to focus on top growth stocks with superior fundamentals.

Ford Rising Wedge and possible short term fallHere there is a rising wedge on the 15 minute chart Could see a short term down trend. If below the red line I will be holding 11 strike put. My stop is as defined.


F - Key levels to watchHigher timeframes show F is over bought. Previous RSI levels have lead to to sharp retraces.
Price is currently at a key hedging level, which can keep price pinned.
A couple PT - $15, $18.


How stupidly pumptarded can the market get?Market is in a bubble, you can tell by looking at auto manufacturers like GM. Since GM went bankrupt and I can't chart 1998, I am using F as a surrogate.
You can see that during the Dot Com bubble, F wound up trading at 3x it's normal range. GM is only at 50% normal range right now, so there is plenty more room for the market to get stupid.
Also note that it took 3 years to go back to normal. So in essence, I expect the market to go parabolic, then come down when inflation hits and the Feds are forced to raise rates in 2 years. We already know even the slightest increase in rates can tank the market, imagine what happens when he has to raise it from zero?

F - Multi-year two patterns breakoutFord is in multi-year down trend breakout.
Both patterns broke out and both patterns have similar breakout target.
Break out target is 16.
———————————————————
How to read my charts?
- Matching color trend lines shows the pattern. Sometimes a chart can have multiple patterns. Each pattern will have matching color trend lines.
- The yellow horizontal lines shows support and resistance areas.
- Fib lines also shows support and resistance areas.
- The dotted white lines shows price projection for breakout or breakdown target.

FORD MOTORS CO.Friday, 5 February 2021
21:51 PM (WIB)
Ford Motors Co. Open transaction for long terms strategy.
Funds 10% + Equity 10% = ROI 300% (Target End of The Year 2021)
Best regards,
RyodaBrainless
"Live to Ride and Ride to Live"


Good times for Ford incoming. Ford had a pretty good earnings report. They plan on increasing there investment in EV and autonomous driving. The daily chart is looking bullish as MACD is starting to widen green. RSI is heading up toward overbought territory.
Bullish Island Reversal Pattern & Exhaustion GapA: What type of gap is A1?
Possibly a continuation gap or exhaustion gap. This gap is questionable because it is unconfirmed.
A2: This is confirmation that A1 is an exhaustion gap.
This gap is now at least a temporary exhaustion gap. An exhaustion gap breaks out in the direction of the current trend, and then it will reverse direction and break the previous major support price. When it breaks the previous major support, then it is a confirmation.
B: What type of chart pattern is this?
This is a bullish island reversal pattern. It involves two gaps. I gap downward and a gap higher that will close the previous gap. A bullish island reversal pattern is an indication that the price will go higher.
C: How to interpret volume with price gap?
I heard before that high volume is associated with a continuation gap, and low volume is associated with an exhaustion gap. I don't know. I am going to answer this question with a maybe. Volume was high with gap A1 in the chart, but the price quickly reversed direction.
Thank you for reading!
Greenfield
Remember to click "Like" and "Follow" to see more articles.
Disclosure: Article written by Greenfield. A market idea by Greenfield Analysis LLC for educational material only.

Ford: Simple strategy says buy.Updating my recent analysis, Simple Strategy says that Ford is now a buy. The MACD is above the signal and above 0, the top BB is pointed up, and the RSI is above 70. Of course, all that said, today is earnings day, so if they miss the mark there, all of the technical analysis is for naught.
I am long F, and I am not a financial advisor. Just a smooth brain ape trying to make a buck playing with green strips of paper. Don't listen to anything I say.

F - Ford $12+ After Earnings0. A follower asked us about this when it was around $9.75 as you can see in the chart;
1. We recommended it sub-$10 and said it was consolidating below the $10 mark and would break out;
2. I think the post is still on our thread;
3. Anyway, stock has earnings, has done nicely, and we see a $15 price Target, and earnings are crap, but
the future is what counts today folks;
4. So, we were correct sub-10, and we believe this is good NOW, or you can wait til after earnings, but GUIDANCE counts
the most and outlook;
- drchelsea

Ford MT (February 4th 2021)Ford Motor Co (F) (February 4th 2021 through June 2021)
Low: $9.41 - $10.89
High: $13.69 - $15.68
2020 Q4 announcements for Ford are today.
Here are my main speculations/expectations.
I think overall guidance for the year ahead will be positive, maybe not miraculous but still positive, better than it has been in the last few years?
My estimates for EPS fall around $0.60 - $0.61 - $0.63 - $0.69 for my most expected levels, but even if its not that high I have a suspicion it will exceed the analyst expected $-0.07 levels by at least 20 to 30 cents.
I think the next trading day will close in positive gains, as well as through tomorrow.
This chart idea is based on a diagonal H&S I think could happen along with unfulfilled fibonacci levels I think could happen next. Just a couple different paths all in one general direction for up. Looking for trend line breaks in case all of this is wrong too.
Thanks for tuning in :) Disclaimer, anyone in the trade needs to do their own due diligence and decide what is right for YOU. My charts can be wrong at any time and it's very important that you have your own strategies and plans in place. I run this channel for my own educational purposes of learning to trade, and I will never be 100% right, so please do not let me confirm any bias for you! (Dangerous to do so, stay safe and remember the basics & rules of risk assessment.) Expect the unexpected and happy trading!

Ford- Earnings CatalystFord is currently showing what seems to be a possible flag pattern. There are two possibilities for a bullish trend: 1. F spikes due to earnings tomorrow or 2. F retests resistance in the next 2-3 days and if a rebound is successful then this could signal the next phase of Ford's growth. It all comes down to earnings tomorrow.


FordI have been following Ford for a long time. I do think it is undervalued and has the potential to increase another $10 within 24 months.

Ford: Almost time to buy in.If you follow Heitkoetter's Simple Strategy, Ford is nearing a buy opportunity. The upper Bollinger band points up, and the MACD has crossed the signal and is about to move positive. Barely. That said, the RSI is low, sitting in the mid 50s.
The MACD is ONLY BARELY past the signal, and the RSI is low. If you already have Ford stock (and I have for over a decade), continue to hodl. If you want to enter, you could, but I would say that the Simple Strategy would tell you to look for other investments. Of course, the market hasn't opened yet, and I am not giving you financial advice. I am just reading the bones, and you should not listen to me.
