$GLD - Grrr babyIn a world where central banks are buying the hell out of gold/precious metals in preparation for what’s to come with Russia and China, gold prices were brought down by speculative and stupid beliefs in other assets. As dumb as it is that a shiny rock is worth soooo much, it’s the asset China and Russia want every ounce of which makes me love it more. Getting more beautiful!!
GLD trade ideas

Gold is soldFirst time looking at the gold chart and it is not as bright as I expected. The end game here is to make equql bottoms at the thick red line and extend further to take out the equal bottoms. NFA use stops.
Cup and HandleThis is not quite to long entry level.
Often best to be sure a security breaks resistance unless you are already long.
Always look in the rear view mirror, then up as well (0:
No recommendation

GLD big LEVELBe careful because this the big level NOW on GLD this will determine where we will go we're still in a bear market until we break up this level !!!

GLD SPDR two bullish breakout patterns in one!W Formation has formed and the price has broken above recently.
We then have a larger Cup and Handle forming, which the price is now completing the Brim Level.
This market is correlating well with Gold and seems to be lagging the current Gold rally. This means, we can expect upside for GLD very soon.
My first target is $174.68

$GLD Long Setup Watch out for $GLD; Very high probability of this going outside month which gives a target of 160-161$, Also about to go 2-1-3U on the 2W 🟢 . Dec. 160C's are beautifu

GLD Daily - long run bullish but Retrace to 160 GLD double bottom (X to B) - look for a retrace back to pt D fib support (160) around 11/30/22.

How high and how low can Gold go in this cycle?In my honest opinion Gold will head much much higher in the next decade, and the double top at 2070 is bound to break. In the short term it also looks fairly bullish as it has reclaimed several key support levels, along with the 200-400 DMAs and the diagonal trendline. Getting up to 1900-1920 over the next few days or weeks definitely seems possible.
However in the medium term it isn't clear whether it is ready to resume higher. To me it looks more likely that Gold will get to 1600 and maybe even 1300 before getting to 3000. The quadruple bottom at 1670 looks vulnerable, as so does the triple bottom at 1450, while the 1300-1350 looks like a massive magnet. The market never retested that breakout and it could certainty revisit it before going higher.
But how could gold go lower if inflation remains high? Well inflation has been high for a while now, and yet Gold is still sitting below its 2011 ATHs. Central bank balance sheets have exploded, and yet gold remains quiet. In my opinion this has to do with several things, that could range from manipulation up to a strong dollar. Central banks are cornered and not many governments are profitable enough to add gold to their balance sheets. Some will potentially be forced to sell in order to support their currencies. As energy and food go higher, bonds yields will go higher, and therefore more opportunities will arise outside of gold. Being long oil is probably a better inflation hedge than being long gold. At the same time higher inflation forces people to sell stuff in order to cover their extra costs, and that includes gold. People bought gold as insurance for a period of high inflation, and now they need to exercise that option. Finally, as bond yields go up, if the dollar also goes up, then this could seriously harm gold. If the USD appreciates too fast along with interest rates going higher, then gold could collapse along with most other assets in the case of a liquidity squeeze.
In conclusion, I don't believe inflation is fully under control, I don't think we are done with QE and low rates by Central banks, however I do think that gold isn't ready for prime time yet. Gold is in a weird spot both fundamentally and technically, so I'd need to see a more bullish price action in order to be convinced that 3000 will come before 1300.

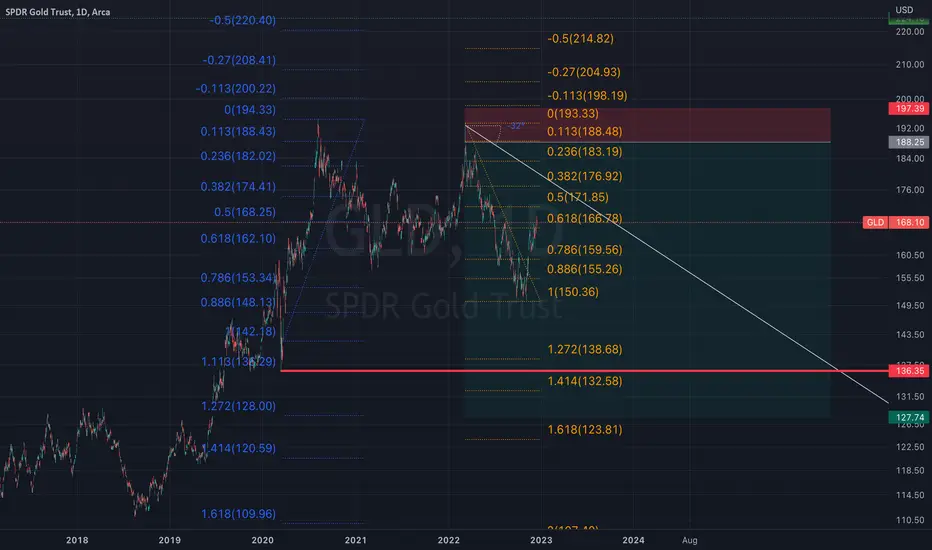
GLD to stay below 150 and last chance to get outHello Golden heart people
Sorry I am not bringing a good news for GOLD/GLD. The chart pattern seems to be replicating itself from 2011 - 2015. Description in the chart should be self explanatory, here are few points to make it clear.
This is a monthly chart, so please do not hold me for the daily bounce. I am taking this opportunity to short at the better price. What are you doing?
Moving average I have used is 34 because it is at least respecting that average, and currently it is below 34 monthly moving average and is turning down. I will change my mind only when it closes above this monthly moving average.
If you know me, my monthly fib levels are in red and the price is below 23%, the minimum target is 38% which is 135
I have used Anchored VWAP since inception of GLD and now it is finally below 1 standard deviation and if mean reversion has started then the target is 125 and to capitulate it has to go below 110
One thing I have learnt is, longer trend works BUT the only condition is you should be able to ignore the losses short term
I will keep updating this idea as and when there are big moves or if there are any questions.
This is my opinion, I would like to know yours as well if you do not agree with this.

GLD: Testing Previous S/R LineAMEX:GLD
GLD looking to test previous multiple tested S/R line from earlier this year. On the 4h MACD is threatening a negative roll over and the RSI is extended into overbought land since last Wednesday. On the 1D, MACD is much like the price over the past week and is almost vertical while the 1D RSI is breaking into overbought. Price is ~4% extended from the 9sma, and running face first into a S/R and 200sma convergence wall.


gold vs btcheld the monthly, looking for the short bounce here back to 170 range, keep yall posted. seems easy enoughw ith the current macro outlook

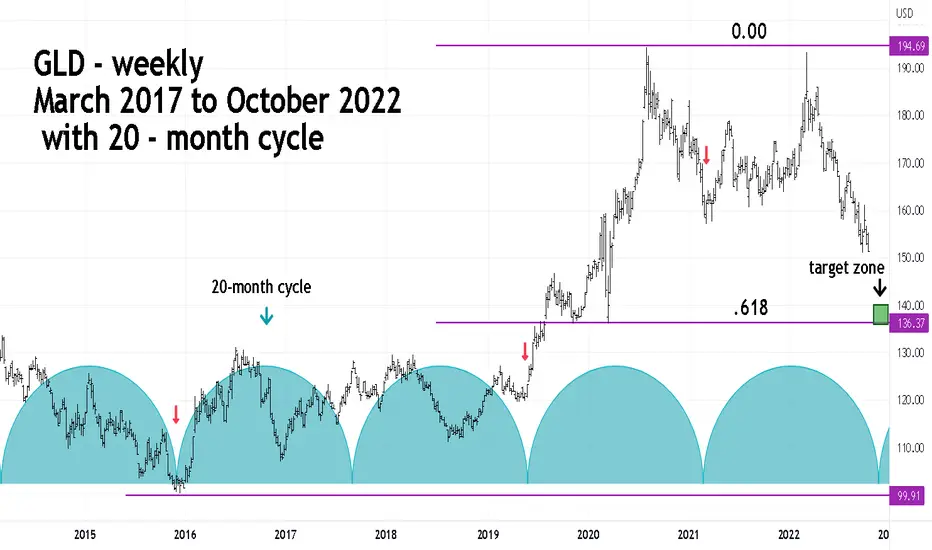
Potential Major Gold Bottom in NovemberGold sometimes has seasonal bottoms in the Noverber to December time zone.
There's also a 20 - month cycle that could bottom in November 2022.
Gold could trend down to the .618 retracement of the bull move that began in 2016.
If Gold can reach that price zone in November 2022, a major bottom could form.
GLD - ShortI'm watching the 156 and 160 level. If GLD fails there, it could be heading back down towards the bottom of the channel.

gold spot on bearish momentumbased on weekly chart, we saw a break and retest of a support at level 1700.38 dollars, these means that we are on the sell side market and our target is at 1500.89 us dollars

GLD: Sandbox ⛱After the hard work of finishing wave iv in magenta, we expect GLD to play a bit in the yellow sandbox between $150.72 and $140.40, all the while completing wave (4) in yellow. Then, it should get down to business again – or rather get up to business, as we expect GLD to climb northwards, crossing the resistance at $171.23. There is a 35% chance, though, that GLD could rise above this mark directly and without amusing itself in the yellow sand.

Gold Order Flow - Bears Rule The MarketHey traders,
Yet again, the OFA script clearly show we should not be meddling with the affairs of the bears, side fully in control of the price action in the Gold market.
Let the flows, identified via the formation of fractal-based structures, determine the path of least resistance. As usual, credit where is due (Bill Williams). The script simply makes it visually easier to call these trend, which otherwise would be seemingly hard to continuously identify through manual analysis.
Be reminded, when applying the OFA script , it has 2 main components to study:
Magnitude: A major clue that will help determine the health of a trend is the type of progress by the dominant side in control of the trend. We need to ask the following question: Are the new legs in the active buy-sell side campaign as identified by the script increasing or decreasing in magnitude?
Velocity: When it comes to the distance the price moves, the magnitude is only ½ the equation. The other ½ has to do with the velocity of the move or the speed. Was the new leg created after a fast and impulsive move? Or did price make a new low or high with the movement being sluggish, compressive and taking too long to form? A good rule of thumb is to count the number of candles it took to achieve a new leg.
DISCLAIMER: This post contains commentary published solely for educational and informational purposes. This post's content (and any content available through links in this post) and its views do not constitute financial advice or an investment or trading recommendation, and they do not account for readers' personal financial circumstances, or their investing or trading objectives, time frame, and risk tolerance. Readers should perform their own due diligence, and consult a qualified financial adviser or other investment / financial professional before entering any trade, investment or other transaction.


Gold gonna tankGold lost support and with Europe going into a recession while central banks raise rates, it's a horrible combination.
I think it tanks

GLD: Warm-up 👟GLD is warming up in the lower magenta-colored zone between $152.85 and $159.20, where it still has some room left to finish wave iii in magenta. Afterwards, it should jump up into the upper magenta-colored zone between $163.39 and $171.23 to complete wave iv in magenta, before sliding into the yellow zone between $150.72 and $140.40, where the overarching downwards movement should end. There is a 40% chance, though, that GLD could decide to rise earlier already and thus could directly climb above the resistance at $171.23.

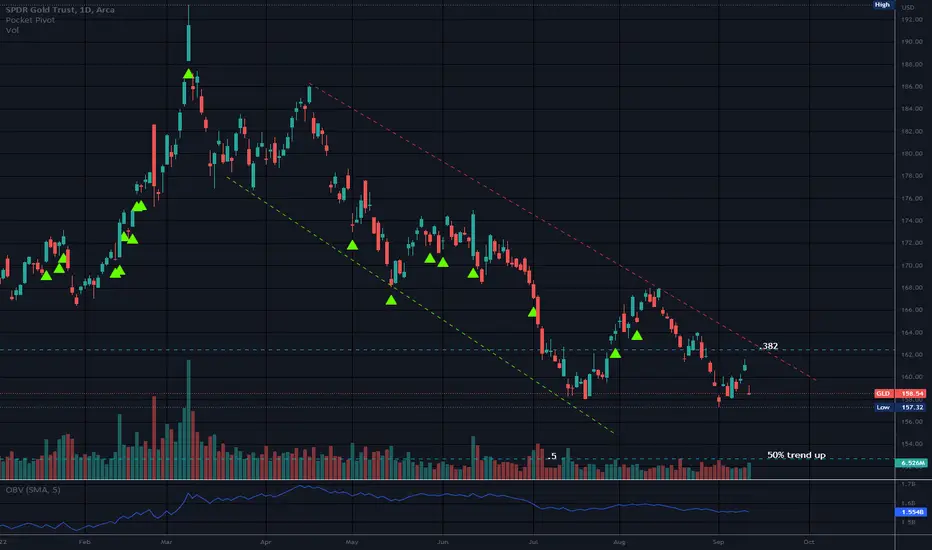
$GLD Positive Momentum DivergencePositive price divergence with MACD and RSI indicators. Playing long to the upside of the falling wedge channel, roughly coinciding with the 50-day MA.

Does Inflation Hurt the Value of Gold? Channel Down. Not looking like a buy point for me.
But why?
Gold does not generate a yield. If interest rates continue to rise and you’re holding gold, you’re forgoing the interest income you could earn on dollars if you put them in a bank account or invest them in bonds. Maybe that’s why rising interest rates tend to create headwinds for gold. Dunno.
The markets expect the Fed to fight inflation with more rate hikes, thus decreasing the appetite to hold holding gold. Maybe? This is just one of many hypotheses.
I am not sure but I check it every so often.
It appears Gold is moving with the market for now like the coins are. Gold is having some short term buying opportunities here and there, only to go back down when the market does
another somersault.
"Even based on the government’s flawed CPI, inflation rose by about 7% in 2021"
A random economist.
No recommendation.
“Gold is money. Everything else is credit.” – J. P. Morgan
GLD ready to riseGLD got beaten up for years. Expecting a small little spike down to 154/155 and then climb. Inflation and high rates are here to stay. Why would GLD not rise?
