GLD trade ideas

Elliot Wave TheoryI believe we are in Wave Five up at the larger degree, currently Wave Two down at the smaller degree.

Gold forming similar topping pattern Many have observed that gold (using GLD here as a reliable proxy) might be forming a huge cup-and-handle pattern (1,2). That may prove to be the case. However, at the moment, the similarity of the unfolding trend to the 2011-13 topping pattern seems noteworthy in itself. Perhaps we’re seeing the start of the cup-and-handle leading to an upward bull run, or perhaps it will be a rerun of the 2011-13 pattern with gold going into a sustained decline. Imo, persuasive arguments can be made for either outcome, so I’ll just wait and see and in the meantime point out this arguably curious unfolding similarity.
(1)
(2) www.investopedia.com

Tight Trends in Gold with predictable Tops & Bottoms in channel.R values over 90 show price only moves are in line with slope.
Note use of Renko blocks for price and not other factors.


GLD 10-03-2021 LongAsset and Time frame -Daily,GLD(XAUUSD)
Entry Price -161.4693
Exit(Stop Loss) -158.12
Exit(Take Profit) -175.12
Technical Analysis - Price has reached the bottom of the down trending channel after a long run-up, on the weekly time frame the price is pretty close to the 100MA, and volume started to pick up, smaller position than usual because of the market choppines
Good luck and stay safe ;)

GLD Clear Cup and HandleWatching 1y high and will create price target according to rejection or not.


Trend Change for GoldGold broke through long term descending resistance and appears to have shifted from bearish to bullish.

Copper Leading Precious MetalsWhile Gold, Silver and Platinum are doing well as a hedge against a falling dollar, Copper is outpacing them so far this year.

New Trend or Reversion Opportunity for GLDGLD may revert back to its earlier channel if the Dollar finds support near its previous low, but if the Dollar breaks through and keeps going lower, GLD is surely headed for a new high.

GLD LongSPDR Gold Shares has entered an uptrend a while ago and looks promising, at long perspective even $224+ is possible
Opinion - BUY


GDX, Gold Futures & RoyaltiesWith inflation expectations high and the purchasing power of fiat currency under threat, the traditional store of value is gold. Retail traders have fallen fowl to the manipulation of the yellow metal with the likes of JP Morgan paying $920 million in settlements. New regulations could turn the tide which will allow the price and fundamentals to make sense once again. One way of getting around the inflationary pressures and the price volatility within the precious metals space, is to invest in a royalty company.
Red Cloud Securities likes Vox Royalty, as does Crux Investor.
From Red Cloud:
Vox Royalty Corp. (TSXV:VOX, BUY, C$5.70 target, David A. Talbot) announced it has recognized preliminary record revenue of C$668k (or US$540k) in Q1/21, below our expectations of C$766k. There were no operating costs attached (cash operating margin was 100%) for the quarter as all revenue stemmed from royalties, not streams. Key highlights in the quarter included initial revenue from the Koolyanobbing royalty (uncapped at 2% of FOB sales value royalty) which had iron ore mined at the recently commissioned Altair Pit; increased production from the Hidden Secret deposit, covered by the Dry Creek royalty of Karora Resources (TSX:KRR, BUY, C$9.00 target, David A. Talbot); and rebounding diamond prices in the quarter associated with the Brauna royalty. We believe the company’s revenue should continue to rise going forward, at least through 2023, and expect seven paying royalties by year-end (up from just a single royalty one year ago). FY21 guidance is also forecasted for C$1.7M to C$2.5M, while we forecast about US$2.9M given our higher gold price assumption. With the combination of ongoing royalty acquisitions, and further increases in revenue and earnings as recently acquired royalties come online (read more), we expect the valuation gap between VOX and peers to diminish. VOX currently trades at a P/NAV of 0.7x peers at 1.2x.
Underlying Fundamentals
Inflation has superseded the global pandemic as the primary risk affecting every corner of the globe. The Federal Reserve insists that the inflationary pressures are transient, not pervasive, though the CPI / PCE data shows that CPI has jumped month-on-month at the fastest rate in several years.
Commodity prices have run up to all-time highs as bottlenecks in supply chains create an imbalance to increasing demand on a year-on-year basis, but we have also seen a massive rise in inflationary pressures from the price of energy, particularly through the price of oil. But to the frustration of the retail investor, the price of gold has failed to go parabolic.
The largest economies are looking to spend big on infrastructure, and technologies are pushing towards a global target of net-zero carbon emissions over the next few decades. Gold’s usage within safety-critical technologies and components, fuel cell technology and carbon capture industries are pushing the physical demand at an increased pace with the current industrial/technology markets equating to approximately 7% of total demand.
In the long term, gold serves as a strong strategic component in many portfolios, not only for its diversification benefits but also for its returns. As a store of wealth, protection against diminishing US dollar purchasing power and as a very liquid Tier 1 asset, pension funds and institutional money managers tend to allocate 5%-10% of the portfolio to the precious metal.
Consumer demand driven by the Indian and Chinese markets is a large proponent of gold jewellery, and the Jewellery markets equate to 34% of the total gold demand. As the overall economic outlook and Risk-On markets do well, these consumers purchase more gold. When times are uncertain, as we witnessed in 2020 during the peak of the COVID-19 pandemic, the consumers reduce their purchases of jewellery, but the institutions step into the market to de-risk their portfolio, as Gold is a safe haven portfolio hedge, which decreases the price volatility during the uncertain times.
The New Regulatory Framework
Gold is a High-Quality Liquid Assets and as of 2019, the Bank of International Settlements (BIS) reclassified physical gold as a Tier 1 asset. Gold was previously viewed as a risky asset, classified as a Tier 3 asset, which meant that gold could only be carried on banks’ balance sheet at 50% of the market value for reserve purposes. Since the Great Financial Crash, a lot has been done within the banking system to try and protect the broader economy from banks blowing up, as Lehman Brothers did.
As part of the regulatory framework, banks have been working under Basel 111 rules and the time is coming for some of the rules to be enforced on the gold markets.
These new regulations are scheduled to be introduced for European banks at the end of June 2021 and in the UK from 1 January 2022, affecting all London Bullion Market Association (LBMA) member banks. The risks to the bullion banks are that they trade in an OTC derivatives market, not holding much, if any, allocated gold. Allocated gold is when an investor is allocated gold and is the outright owner of a certain amount of physical bullion.
There will be a requirement for banks holdings to meet a ratio limit between tangible assets and unallocated assets. The ratio is named Required Stable Funding and the crux of the matter is that if the bullion banks can no longer trade their paper and unallocated gold without holding physical allocated assets, the derivatives market could collapse. The 3 parts of the Basel 111 regulations that affect the paper gold markets are:
• The Available Stable Funding factor (ASF) is applied to the sources of a bank’s funding on the liability side of its balance sheet. Depending on the liability (shareholders’ equity, customer deposits, interbank loans etc.) they are multiplied by a factor, from 100% for the most stable forms of funding, such as Tier 1 bank equity, to 0% for the least stable. Being on their balance sheets, unallocated gold owed to a bank’s deposit customers is to be given a Basel III ASF of 0%, which means it will not be permitted to be a source of funding for any balance sheet assets, which must therefore be funded from other liabilities.
• The Required stable funding (RSF) is to be applied to a bank’s assets. Unallocated gold positions are to be valued at 85% of their market value. Note that allocated gold, being held in custody, is not on bank balance sheets (except where the bank actually owns physical gold in its own right) and is therefore not involved in the calculation.
• The Net stable funding requirement (NSFR) is the ASF divided by the RSF and must be at least 100% at all times.
The bullish scenario is that LBMA member banks have to find a lot of physical gold, increasing the demand and pushing up the price. The second bullish scenario for gold stackers is that with the removal of the paper gold positions that suppressed the gold price from inflating against the M2 money supply / global fiat currency expansion, the physical gold price could adjust towards higher prices in line with inflation.
Technicals
From the chart, we can deduce that the futures market is currently breaking higher and the miners are too. It is conceivable that as physical gold reaches $2k t/oz prices and beyond what is likely to happen in the derivatives markets, a lot of investors will pile in, making the current price of Vox Royalty look very cheap for such a fast-growth company.

GLD ready to run 170-180, finally?One of the most unusual things about the market over the past few months has been this "inflation fear" has not helped gold out. Typically people flee to hard assets like GLD to try to preserve value while their dollars lose relative buying power and bonds get slaughtered. arguably, bitcoin has been poaching money from the GLD trade of late.
But things may be changing....
Along with my bearish BTC forecast ( ), this might even make more sense (perhaps some money rotates back from BTC to GLD after the COIN ipo?)
However, finally technicals on GLD are starting to firm up!
First, we have a very nice double bottom ('W') formation. Second, we have a descending wedge breakout. Third, the momentum indicators -- MACD, RSI are finally setting a northerly direction. The "easy" trade here seems to be a short term push to ~~ 170 (completion of the 'W' pattern (W bottom of 158 and top of 164 gives a 6 point upside projection to 170) (point 'A') while the more challenging one would be a push all the way to 180 (point 'B').


Bullish expanding wedge on gldWith implied volatility being subdued, now my be a good time to go long some options. Very bullish on GLD long term.

Will history repeat itself this time with GOLD? Solid technical and fundamental backdrops for gold these days.
I find this historical view interesting!
Gold has the potential to be THE asset to own over the next decade.

GLD, GDX, USD & YieldsThe sentiment across the forex community is that the weakening US dollar pushes the prices of precious and base metals higher.
From this chart, it can be seen that US 10 year yields are actually the inverse in price action to the Gold Metals ETF/Miners ETF or Gold CFD.
With the US dollar more of a proxy for volatility.

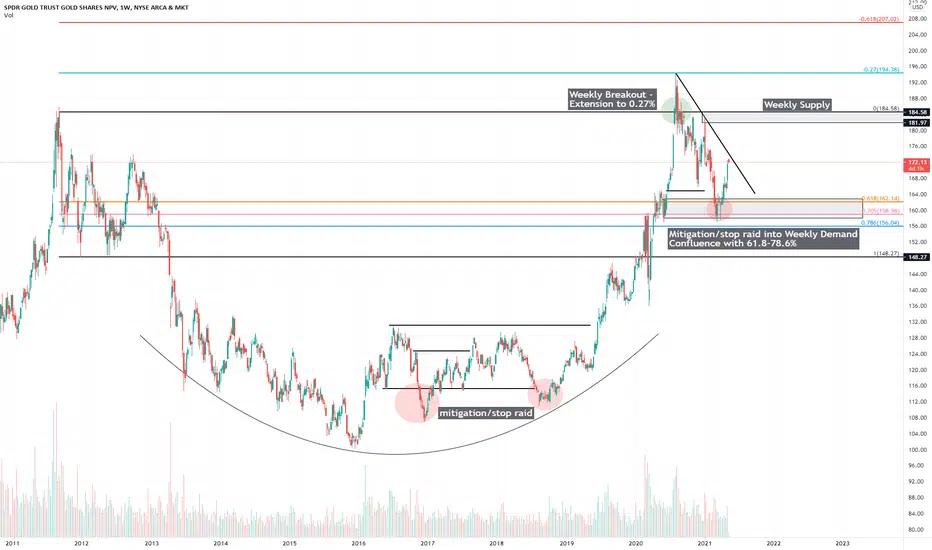
Gold - The Long GameGold - The Long Game
Gold, in addition to other precious metals and commodities, has been rallying on inflation fears.
Here is our technical breakdown:
After forming a 7-year rounded bottom, $GLD rallied 43% from the March 2020 bottom, topping out at the 27% extension of $194.50 in August of 2020.
A successful breakout of our August 2020 downtrend targets a re-test of weekly supply of ~$182-$184.5.
Beyond that, a re-test of highs at $194.50, and extension to the 61.8% of $207.
-Will, OptionsSwing Analyst
Cup and Handle on GOLDIf Gold continues its uptrend next week, I think the breakout will be in motion. Otherwise, Gold will continue to be squashed for another few months or so.
What is interesting is what Gold rising will mean for other assets and the macro environment in general.
Currently, gold actually does tend to rise with stocks since its a bet on yields staying low
The higher yields are on treasury bonds, the lower gold moves.
You saw this on Tuesday when Yellen scared the market by implying rates may rise.
In the future, when this pattern completes, will this correlation still hold?
Will yields actually go negative if gold is allowed to move?
Or will the correlation break down?
Something to keep in mind.

Charlie Munger's O.G. go-to derp. respect the trend ya filthy animals 🤙🏽
the only trade I'm not trading, just buying dips atm...
