GLD Approaches Key Resistance! Will the Rally Continue?"Technical Analysis Overview:
1-Hour Chart:
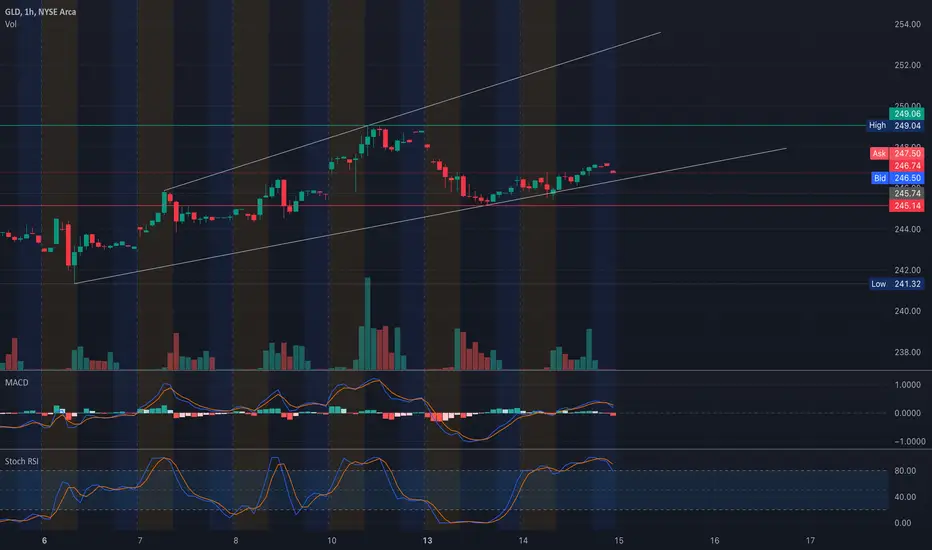
* Trend: GLD is in a steady uptrend, trading within a rising channel and approaching the $248-$249 resistance zone.
* Indicators:
* MACD: Slight bullish momentum, but the histogram is flattening, indicating reduced strength.
* Stochastic RSI: Overbought at 89, suggesting a potential short-term consolidation or pullback.
30-Minute Chart:
* Price Action:
* GLD is consolidating near $247, with key resistance at $248-$249.
* Immediate support at $245 has shown strength in recent sessions.
* Volume: Moderate volume, consistent with the gradual upward movement.
Key Levels to Watch:
Support Levels:
* $245: Immediate support zone, aligning with the HVL and 2nd PUT Wall.
* $243: Secondary support, coinciding with the 2nd PUT Wall (-5.96% GEX).
* $240: Strong support near the 3rd PUT Wall.
Resistance Levels:
* $248: Immediate resistance, aligning with the 2nd CALL Wall.
* $249-$250: Key resistance zone, highlighted by the highest positive NETGEX.
* $253: Long-term resistance, supported by the 3rd CALL Wall.
GEX Insights:
Key Gamma Levels:
* Positive Gamma Walls (Resistance):
* $248: 56.42% GEX (2nd CALL Wall).
* $249-$250: Highest positive NETGEX and immediate resistance.
* $253: 39.99% GEX (3rd CALL Wall).
* Negative Gamma Levels (Support):
* $245: Immediate support backed by HVL and gamma support.
* $243: Strong support with PUT activity (-5.96% GEX).
* $240: Key PUT Wall support (-2.96% GEX).
Options Metrics:
* IVR: 57.2, indicating relatively high implied volatility.
* IVx: 15.2, below average, signaling a stable environment.
* Call/Put Bias: Calls dominate at 49%, reflecting bullish sentiment.
Trade Scenarios:
Bullish Scenario:
* Entry: Above $248 with volume confirmation.
* Target: $249-$253.
* Stop-Loss: Below $245 to limit risk.
Bearish Scenario:
* Entry: Rejection at $248 or a breakdown below $245.
* Target: $243-$240.
* Stop-Loss: Above $249 to control losses.
Directional Bias:
* GLD's continued uptrend and consolidation near $247-$248 suggest bullish momentum, but the resistance zone at $248-$249 is critical. A breakout could lead to a rally toward $250-$253, while a failure to clear resistance may result in a pullback toward $245-$243.
Conclusion:
GLD is approaching a pivotal resistance zone at $248-$249. A breakout could signal further bullish continuation, while a rejection might trigger consolidation or a retracement. Traders should monitor volume and price action closely for confirmation.
Disclaimer:
This analysis is for educational purposes only and does not constitute financial advice. Always conduct your research and trade responsibly.
GLD trade ideas
$GLD - GOT GOLD?!AMEX:GLD - GOT GOLD?!
Day/ Week/ Month all breaking out!
- Green H5 Indicator
- Two symmetrical triangle breaking out
- Daily WCB thriving
- Launching off volume shelf
- Safe haven when FUD hits
All pointing to measured move: $268 🎯
Not financial advice

GLD gold bull flag monthlyThis is actually pretty insane to look at, this bull flag is text book, and multi month. What does this tell us about the markets for 2026? Are we really getting a whole market pump?

GLD Technical Analysis (Daily & 30-Min Chart)Daily Chart Analysis:
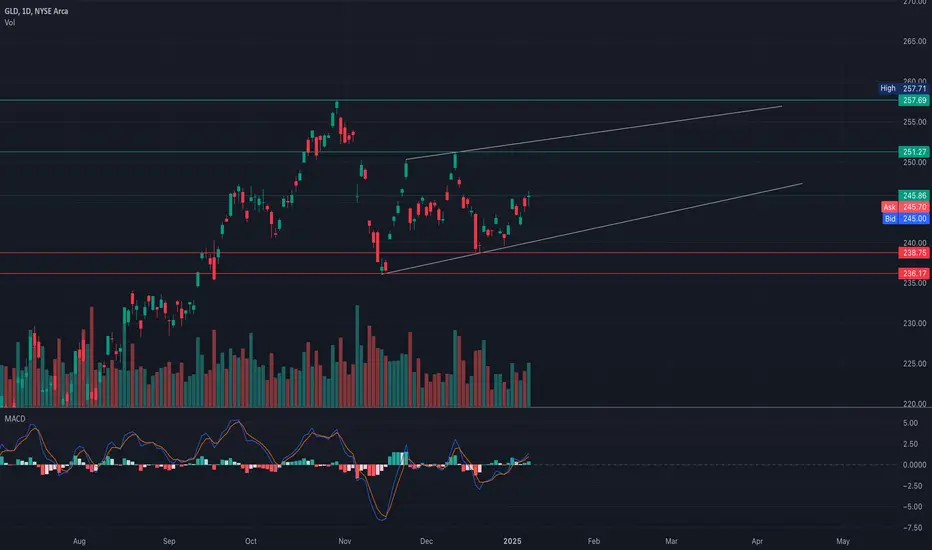
* Trend: GLD is trading within an ascending channel, with higher lows and higher highs forming a bullish structure. The price is approaching the upper resistance line near $257.71, indicating a potential test of this level.
* Support Levels:
* $245.86: Current price zone showing consolidation.
* $238.75: Key swing low, acting as a strong support level.
* $236.17: Major support to watch if a bearish breakdown occurs.
* Resistance Levels:
* $251.27: Intermediate resistance before testing the channel high.
* $257.71: Upper channel resistance.
* Indicators:
* MACD: The MACD is showing bullish momentum with a crossover above the signal line, indicating potential upward continuation.
* Volume: Increasing volume on bullish days suggests strong buyer interest.
30-Min Chart Analysis:
* Gamma Exposure (GEX) Levels:
* $246.45: Highest positive NET GEX and CALL Resistance (Gamma Wall). If the price breaks above, expect bullish continuation.
* $245: Current price zone with balanced sentiment, acting as a pivot level.
* $242.5: Major support near the 3rd PUT Wall, indicating strong buyer interest at this level.
* $241: PUT Support and likely defensive zone if selling intensifies.
* $239: Secondary PUT Wall, representing a key defense point.
* Volume Profile:
* Point of Control (POC): Near $245.69, confirming this as a high-volume price level and significant short-term support.
Trade Scenarios:
Bullish Scenario:
* Entry: Above $246.50 (gamma resistance breakout).
* Target: $250 and $257.70.
* Stop-Loss: Below $245.
Bearish Scenario:
* Entry: Below $244.
* Target: $242 and $239.
* Stop-Loss: Above $246.50.
Directional Bias:
* The overall trend remains bullish within the ascending channel on the daily timeframe. However, watch for a breakout above $246.50 for confirmation of further upside. A failure to hold above $245 could lead to a short-term pullback toward $241.
Disclaimer:
This analysis is for educational purposes only and should not be taken as financial advice. Please conduct your own research and manage risk appropriately.
A Case To Be Long GoldSince the beginning of the year, I've been seeking an opportunity to invest in gold, and I believe there's a compelling case from macroeconomic, fundamental, and technical perspectives.
Macroeconomic Perspective on Gold
With President Trump returning to office, it's important to consider the economic impact of his proposed income tax reductions. Lowering individual taxes increases disposable income, leading to higher consumer spending without incurring additional debt. This contrasts with lowering interest rates, which encourages spending through borrowing, potentially having a slower effect on inflation compared to direct fiscal measures like tax cuts.
The recent stimulus checks have shown a direct impact on inflation, and similar effects could arise from income tax cuts, especially for tipped workers. Investors often turn to gold as a store of value during inflationary periods, making it a potentially attractive investment under these conditions.
Fundamental Analysis of Gold
Currently, the price of gold relative to the SP:SPX ( $TVC:GOLD/SP:SPX ) appears undervalued. Additionally, the GOLD/SPX ratio is at a support level, indicating potential for appreciation.
Seasonal Trends
Historically, over the past 18 years, gold has shown strong performance from January to late February, posting negative returns only four times. Even in those instances, the losses were minimal compared to the gains during positive years, suggesting a favorable seasonal pattern for gold investments during this period.
Technical Analysis of Gold
Gold has been in an uptrend, and after a significant pullback, there appears to be an opportunity to enter the market. The recent large bearish movements may indicate a slowdown in the weekly trend, leading to a consolidation phase where the market establishes a new price range.
Conclusion
Gold presents a promising opportunity for inclusion in a long-term investment portfolio, potentially offering substantial returns. Monitoring the risk/reward profile is essential, and adjustments may be necessary based on market developments. If the desired entry point isn't reached and a bullish inside bar forms this week, next week's entry could be even more favorable.
Good luck and happy trading!
For more information on this subject and many others visit my website and my YouTube.

GLD UpdateStill waiting for price to continue lower towards the target box. As I have said many times before, C waves can either be 3 or 5-wave moves. This appears as if it will be a 3-wave move based on the structure it has carved out thus far. I am of a mindset that we should move into the box within the next month or two. Gold in general just moves very slow the majority of the time. Every once in a while, it sees some volatility but that is very rare.
Should it make a new ATH before entering the box, then wave 4 is likely already over and was very short. This is not my primary thought process but nonetheless it is very possible.

Gold vs. Silver: Is the Ratio Signaling a Major ShiftIntroduction:
Precious metals are displaying promising price action, warranting a closer look at the gold AMEX:GLD to silver AMEX:SLV ratio. This ratio provides valuable insights during bull markets:
Bullish Silver: In a strong bull market, silver typically outperforms gold, causing the ratio to decline.
Gold Leading: Recently, gold has taken the lead, advancing in a corrective rally, but there are signs this could change.
Analysis:
Inverted Saucer Formation: On the gold-to-silver ratio chart, a large inverted saucer formation is emerging. This bearish pattern indicates a potential breakdown below key support levels, signaling silver’s outperformance in the months ahead.
What to Watch:
A confirmed breakdown of support in this ratio could signal a major shift in favor of silver.
If silver outperforms, prices could surge to retest its 2011 highs of $48-$50 next year.
Gold Outlook: Despite the shift in favor of silver, gold remains bullish. A breakout could target significant upside, with price projections of $3,300-$3,400.
Trade Setup:
Silver Bullish Setup:
Trigger: A breakdown in the gold-to-silver ratio, confirming silver’s relative strength.
Target: SLV retesting $48-$50.
Stop Loss: Manage risk by placing stops near recent support levels in silver.
Gold Bullish Setup:
Gold continues to show strength, targeting $3,300-$3,400. Monitor for breakouts in gold prices alongside silver’s potential surge.
Conclusion:
The precious metals setup looks increasingly bullish. The gold-to-silver ratio is hinting at a shift toward silver outperformance, a hallmark of true bull markets. If this scenario plays out, silver could retest its 2011 highs, while gold targets new all-time highs. This is a chart and setup worth keeping a close eye on in the coming months. Which metal do you think will lead the charge? Share your thoughts below!
Charts:
(Include charts showing the gold-to-silver ratio with the inverted saucer formation, key support levels, and projected breakdown targets. Add gold and silver price charts highlighting bullish setups.)
Tags: #Gold #Silver #PreciousMetals #GLD #SLV #BullMarket #TechnicalAnalysis #TradingIdeas

$GLD Double Bottom, Bullish Inverted H&S AND Bull flagging?! Am I blind? Are you? Holy moly. This looks textbook under the reversal patterns I have documented. To be HONEST, it doesn't look 100% but it's showing signs. In my previous AMEX:GLD posts I said $242.73 needs to hold and it has. I think AMEX:GLD is creating a new floor of support for the next 3-6 months. I'm going to be entering GETTEX:250C for months out in 2025. + EOY rally. $250 target gets AMEX:GLD to a 30% YTD. AMEX:SPY in the same boat, 30% YTD - I posted a chart on it as well, check that out. Leave a comment to let me know your thoughts. I looked through many time frames and this one looks the best. I can't say I'm a fan of the big Elmo candles but I see a flag forming. Leave a follow and a comment.
wALL sTreeT L0S3R

$GLD boiling, $253.99 targéPosted a chart before, this seems to be setting up for a EOY pop. Flagging, spinning stop doji, tight one at least, on the green side. $250 calls for Jan-Feb. Bitcoin CRYPTOCAP:BTC vs. Gold Trust $GLD. Money is on both.
Wall street Loser


$GLD cup and handleFew weeks ago AMEX:GLD pulled back from its all time highs back into the $230s, hit $236 then went all the way back to $250 then back to $242. Here you can see a little cup and handle, if it stays above $245.17 I will enter monthly calls for a $250 strike. I entered $240c for 12/20 when it dipped the first time and made a 100% return and sold too early, wound up going 300%. I think AMEX:GLD has a lot more to run.

Market Update - 11/24/2024Small caps are taking the lead again, consumer discretionary, finance and energy names are the strongest. These are all healthy signs. Interestingly nuclear names ( NASDAQ:NNE , NYSE:SMR , MIL:NUCL ) are showing high relative strength. China names might also start working again next week after a nice consolidation for ~2 months. Over a third of my passive account is invested in energy/commodity ETFs which have been doing well, especially MIL:EXXY due to $GLD. There are also lots of good setups and my market timing model has been significantly improving in the last few days. I'm quite bullish, until the market proves me otherwise.

Expired GLD Weekly outlook. 5th WK OCT 2024Expired GLD Weekly outlook. 5th WK OCT 2024
> BULLISH 📈 HIT
Prior Week Closed Price: 253.32
This Week Target Price: 254
Strike Price: 257.71 on OCT 30, 2024
Upper Range: 258.17
Lower Range: 250.97

Portfolio diversification - 5-10% in GoldWe can see from the long term monthly chart that it took more than a decade for the prices to go from low of 98 to 184 before it finally broke out in March this year. The price has been rallying non-stop thus far and I believe we have yet to see the peak yet.
Some investors like physical gold while others prefer digital gold. I am of the opinion that central banks worldwide has jumped on the bandwagon of printing money to sustain their own economy. China is now on this mission to shore up its weakening economy and US is definitely going to print more.
More debts mean more interest for the government to pay off which will weaken the reputation of US dollars over time. When enough people feel US dollar is weakening (as it is now), then they would want a safe haven to park their money. Gold for centuries has been labelled as a safe haven to hedge against inflation.
One must have a longer time frame to invest in this alternative asset and not expect to make quick returns in a year or two. Central banks worldwide have shore up more gold than before , just google it.
With pull backs , I would want to accumulate more.

Gold vs Commodities: Monitoring Relative Strength in Hard AssetsIntroduction:
The commodity sector spans various areas, including energy, agriculture, livestock, and metals. However, focusing on the most promising areas can lead to more effective investment strategies. One key ratio to monitor is gold AMEX:GLD versus a broader commodities basket (DBC). This ratio is especially relevant for those interested in hard assets, as it highlights where strength lies in the commodity space. Currently, this ratio favors gold as the stronger performer.
Analysis:
Relative Strength: The GLD-to-DBC ratio offers critical insights into the relative performance of gold versus other commodities. Gold has been outperforming the broader commodity basket, indicating its resilience as a hard asset.
Technical Pattern: Earlier this year, the ratio broke out of a rounding bottom pattern, signaling a bullish trend in favor of gold. Even before this breakout, the trend was clear through a series of higher highs and higher lows, reinforcing the strength of gold relative to other commodities.
Gold’s Performance: Gold remains near its all-time highs, while other commodities continue to lag behind. This highlights gold’s resilience in the face of broader market uncertainties.
Conclusion:
Gold’s resilience compared to other commodities makes it a standout performer in the current market environment. The recent breakout in the GLD-to-DBC ratio and the continued pattern of higher highs and higher lows support the bullish case for gold. Traders focused on hard assets should monitor this ratio closely to gauge potential shifts in strength. What’s your outlook on gold versus other commodities? Share your insights below!
Charts: (Include relevant charts showing the GLD-to-DBC ratio, the rounding bottom pattern, and the higher highs and higher lows trend)
Tags: #Gold #Commodities #HardAssets #GLD #DBC #TechnicalAnalysis

Weekly Analysis of Gold ETF GLD: Cup and Handle Price Target andWeekly Analysis of Gold ETF GLD: Current Bull Trend Following Cup and Handle Formation
Introduction
The SPDR Gold Shares ETF (GLD) has emerged as a pivotal investment vehicle for those seeking exposure to gold, especially amidst ongoing economic uncertainty. A thorough technical analysis reveals a significant cup and handle formation that developed from 2001 to February 2024. This bullish pattern has now led to a steep upward trend in GLD, signaling continued momentum for investors.
Cup and Handle Formation
The cup and handle formation is a classic bullish pattern indicating a strong potential for price appreciation. In GLD's case, the handle is approximately 50% of the height of the cup, resulting in a robust setup that has propelled the ETF into a sustained bull trend following its breakout in February 2024.
Volume Analysis
Volume behavior is a crucial component of the cup and handle pattern. During the cup formation, volume displayed a strong U shape, reflecting robust buying interest. A decrease in volume during the handle phase indicated healthy consolidation. The subsequent heavy breakout volume in February confirmed the strength of this bullish movement, validating the upward trajectory of GLD.
Measuring Target
To project potential price targets, we can measure the height of the cup and apply it to the breakout price. The calculated target suggests a price level of $278.51. Additionally, Fibonacci projections provide confirmation for this measurement. The 1.272 Fibonacci extension level indicates a price target of $282.08, which closely aligns with the previously calculated cup height target. This convergence of targets reinforces the bullish outlook for GLD, indicating a strong potential for continued upward movement.
Trading Strategies
The pink trendline on the chart serves as a crucial support level. Monitoring price action around this trendline is essential for traders. A breakout below this level would signal the end of the current bull trend and may lead to a trading range followed by a potential correction. Conversely, maintaining support above this trendline will be vital for sustaining the upward momentum.
As we navigate this bull trend, it’s important to be mindful of potential market corrections. Before entering any short positions, traders should look for confirmation signals, such as a test of previous highs, which may result in a lower high, a higher high, or a double top formation. A breakout below the pink trendline alone is not sufficient for short-selling decisions; a clearer indication of a reversal is needed.
One critical area to watch is the 0.618 Fibonacci projection level, which previously acted as a significant resistance level before becoming support. A pullback to this level is anticipated, representing a potential correction in the GLD price. Additionally, the correction may find support at the blue trendline, which connects the lows of the cup and handle formation.
Potential Catalysts and Seasonal Trends
A significant catalyst for market correction could be the 2024 U.S. Presidential Election, particularly if Donald Trump wins on November 5, 2024. Trump’s previous presidency was characterized by substantial stock market gains, often attributed to policies that fostered economic growth and stability. His commitment to end the conflict in Ukraine may further boost investor confidence, creating a conducive environment for market corrections.
Timing remains crucial for any investment strategy. The end of December typically sees increased gold prices due to the holiday season, and this trend continues into the Chinese New Year. Investors should be aware that these seasonal factors can lead to upward momentum for gold in the near term. However, caution is warranted, particularly as the market may experience corrections after these seasonal peaks.
Conclusion
As GLD currently navigates a steep bull trend following the breakout in February 2024, investors should closely monitor critical levels and potential price targets. A strong breakout below the pink trendline could signal a shift in market dynamics, leading to a trading range and potential correction. In contrast, maintaining support above this trendline will be crucial for sustaining upward momentum.
Investors are encouraged to remain vigilant for key developments, especially surrounding the upcoming election and seasonal trends, as these factors may significantly impact the gold market. Those looking to act should carefully consider the timing of their trades, aligning them with technical signals and fundamental events to maximize potential gains.
In summary, adopting a well-informed approach that combines technical analysis with an understanding of fundamental developments will be essential for successfully navigating the current market dynamics associated with GLD.

GLD - Inverted head and shouldersInvesting in the SPDR Gold Shares ETF (GLD) offers several long-term benefits:
1. **Inflation Hedge**: Gold historically performs well during periods of inflation, protecting against the decline in currency value.
2. **Safe-Haven Asset**: Gold is often seen as a refuge during economic or geopolitical instability, making GLD an attractive option for risk-averse investors.
3. **Diversification**: Gold’s price movements tend to be uncorrelated with stocks and bonds, which can help reduce portfolio volatility.
4. **Liquidity**: GLD is traded on major stock exchanges, offering high liquidity and ease of trading compared to owning physical gold.
5. **Cost Efficiency**: Owning GLD is cheaper than holding physical gold, as it avoids the costs of storage and insurance, with an expense ratio of 0.40%.
6. **Historical Performance**: GLD has demonstrated strong returns, with a year-to-date return of around 27% as of 2024, and a 10-year average return of nearly 9%.
7. **Timeless Value of Gold**: Gold has been a reliable store of value for centuries, and remains relevant as a hedge against modern market volatility.
These reasons make GLD a solid choice for long-term investors looking to mitigate risk while benefiting from gold’s enduring value.

GLD: Short-Term Weakness, Long-Term OpportunityGLD is showing weakness today, confirming that the strong upward trend is now in a phase of consolidation or temporary correction. This phase could present interesting entry points, but in the short term, the acceleration of the declines and the shift of previously bullish indicators to neutral signals suggest a cautious approach is warranted.
AMEX:GLD Key Indicator Analysis:
Relative Strength Index (RSI 14) at 43.60: This is in neutral territory, indicating that GLD is not yet oversold, but the weakening momentum signals the lack of immediate upward pressure.
Stochastic %K (14, 3, 3) at 23.02: While close to the oversold threshold, this oscillator is still neutral, hinting that the current decline might not have fully exhausted selling pressure.
Commodity Channel Index (CCI 20) at -213.86: A clear "Buy" signal, as this extreme negative value suggests the possibility of a rebound. However, it must be considered within the context of broader market conditions, which remain weak.
Average Directional Index (ADX 14) at 26.06: Indicates a lack of strong trend direction. This suggests that the consolidation phase could last longer, and a strong trend (either up or down) is not yet established.
Momentum (10) at -4.10: This "Buy" signal indicates that selling momentum may be fading, but the bearish MACD (-0.73) contrasts this, suggesting the potential for further declines before any meaningful recovery.
Moving Averages: Most short-term moving averages (Exponential and Simple) are indicating "Sell" signals (10, 20, 30 days), reinforcing the bearish sentiment in the near term. However, the longer-term moving averages (50, 100, 200 days) remain in "Buy" territory, supporting the notion of a broader upward trend that is currently in a correction phase.
Conclusion:
Aggressive Traders: Those looking for short-term opportunities may consider selling intraday rebounds. The weak oscillators and bearish moving averages in the short term indicate that the downside risk is present. These traders can aim for quick, short-duration trades, betting on continued price drops before stabilization.
Strategic Traders: More patient, strategic traders can observe how deep this correction phase goes. The extreme CCI value, along with the longer-term bullish moving averages, suggests that GLD is in a corrective period within a larger uptrend. Waiting for a clearer signal of the correction’s depth could provide an attractive buying opportunity with the expectation of new highs before the year-end.
In summary, GLD is in a period of caution as the short-term indicators turn neutral to bearish, while long-term signals suggest this is a temporary consolidation phase.
Disclaimer: The information provided is for educational purposes only and does not constitute financial advice. Trading and investing involve risk; always conduct your own research and consult with a professional before making any financial decisions.

Golds Super Wave 2.0Gold's incredible symmetry on this Monthly view of GLD begs the question : Is 2005-2011 the dress rehearsal for our 2018-2025 Super Wave 2.0

GLD too stretched... time for some pullback Gold bugs/bulls are running too fast, time for some quick pullback soon.

GLD and Oxy inverseThis is why I am short GLD and long oil, a combo of oxy being undervalued, and crude being oversold. As the market absorbs this rate cut I expect pumps from oil and dumps from gold.
Summary:
Put spreads on Gld
Call spreads on Oxy

GLD rejection soonGLD looks like it might reject this golden fib soon here on overheated price action. People have flocked to gold the last several months as recession fears grow. I believe the market is pricing in a 25 basis point rate cut, when we get 50, risk will increase and GLD will drop. I believe this will be a brief correction.
-Price target 223-229$

GLD - 1M - Cup and HandleGold reached a new record high this week, surging to $2,578/oz amid a weaker dollar and declining bond yields.
This spike followed economic data hinting at more aggressive action from the Federal Reserve ahead of next week’s interest rate decision.
With a decade-long cup and handle pattern forming on the monthly chart, a measured move could potentially see gold climb another 18%.
