GLD trade ideas

GLD: Bat Pattern In Motion!!!Potentially Bat Pattern at completion levels. Waiting on some confirmation signal to go long.
Note this is hourly time frame.
Green zones are you profit taking zones
Red zones are your stop losses
Looking for a 0.386 retracement as first target
Looking for a 0.618 retracement as secondary target

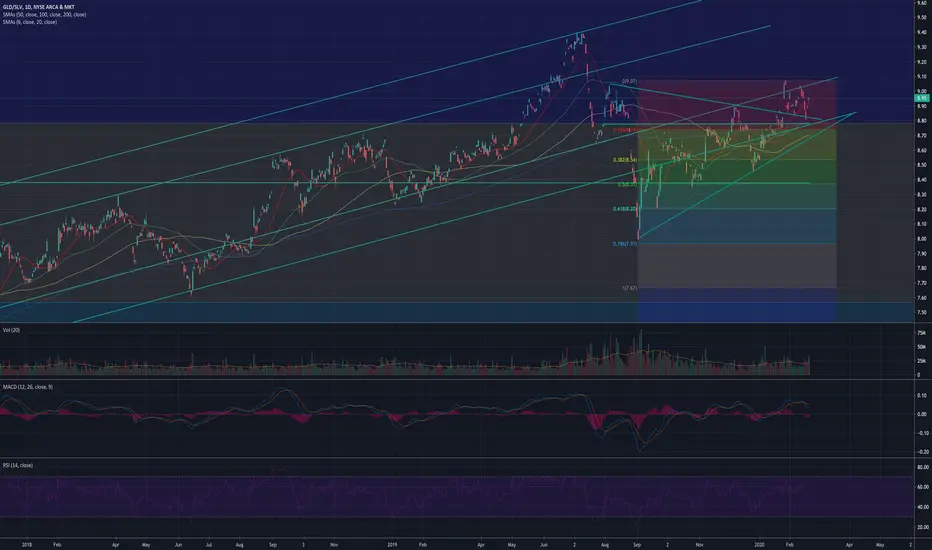
GLD/SLV RatioGold has persistently pushed higher while silver has lagged causing the gold/silver ratio to hit an ATH. This is a high that dates back a century. As you can see from the 2009 - 2001 period when gold topped this ratio hit a bottom. it's been a long time coming but silver's time to shine will be here soon enough. I expect that silver will play some catch up while gold treads water. Silver's precipitous drop last week and gold's run up has truly skewed things. Watching this carefully but its time to accumulate a silver position in size.

GLD cup and handle formationPrice target 170 imminent.
1.) Margin call sellers from 2/24-2/28 gotten out, so lesser risks in this happening again.
2.) Sanders winning super Tuesday isnt' going to be good for the market.
3.) Rate cut is good for gold.
4.) Corona virus worldwide spread has not even peaked yet.
5.) SPY will enter bear market based on broken supply chain due to corona.

Dow, gold, bonds and BTC Tracking the performance of gold, bonds and BTC vs. the Dow since the largest weekly point drop in its history.

Gold Bull TrapFor the time being I am watching GLD to see if the $148 line holds. Market devaluation could further depreciate gold if this selloff continues. Carefully watching from the sidelines for now, $GLD for low risk plays $AUY for some high risk plays.

$GLD Shakes Out Hard as Asset Managers Tap Performers for CashGLD has dropped sharply as precious metals became a source of cash during the crash last week for overleveraged asset managers. But this could be a mechanically-charged shakeout in a continuing trend.

Gold Spike Follow UpWow what a big down day! Not stocks - Gold, which was down more on 2/28/20 than any of the US stock indices.
My 2/24/20 GLD post noted Gold/GLD could have a spike top near the new moon on 02/23/20, since then in spite of the virus panic Gold is down.
The crowd buying into this "safe haven" got burned.
High probability of more downside in the coming weeks.
Stochastic has had a bearish crossover and is now in the neutral zone.
RSI has a bearish divergence vs. the 02/04/20 price bottom.
MACD has a bearish crossover.
Very good chance GLD could reach the first support area.
The vast amount of bearish evidence suggest a decline could last months and even years.
Long term minimal target is test of late 2015 major bottom.
Mark

PEAK in place for longer term reversalThis is based on my dowsing work and there's some alignment with Martin Armstrong's cycles, though he would wait for the close of February.
Regardless, I'm basing this idea on my dowsing work, which indicates this as a lower high of an important and longer term peak in in GLD, /GC and even miners (see post on GOLD).
Where it stops, I don't know, but give yourself plenty of time. If it takes out the prior peak, I'd say I'm wrong.

Gold needs to dip and resetCongrats to anyone who has been long gold and if you have now is the time to take profit. Overall I am bullish on the metal but its plain to see it needs to dip a bit and reset a base from which to continue up further. Three arrows on this chart point to a pair of highs and a low in b/w them that combined we can project Fibonacci timing points from that have served relatively well thus far as far as trend reversals are concerned and we can see that we are upon a 2.382 extension that will probably mark a dip that is already potentially happening. I would like to see pullback hold the upper 140s from which we can go long again.

Gold has Very Powerful Sell SignalMoving completely above the upper Bollinger Band is probably the strongest possible sell signal. Its the signature of a panic climax and market upside exhaustion.
Today 02/24/20 GLD moved completely beyond the daily Bollinger Band, one day after a New moon, with a daily RSI bearish divergence, Gold Commercials have their largest short interest in more than twenty years!
This is about as good as it can get for signals in any market. This type of situation occurs only about once in a year, sometimes once in two years.
Extremely high probability that a major Gold top could be in place.
Yes, I know there's lots of scary "news" about the virus. Focus on the Gold markets indicators.
The last time I had this much conviction of a market turn occurring was in late December 2018 with the US stock market.
Please see my SPX posts in December 2018 and January 2019.
Mark

Gold Could be Spiking into a Major TopMy prior GLD post noted it was nearing major Fib resistance of the 2011 to 2015 bear market. That target has been achieved on the cusp of a seasonal bearish time that lasts until April.
Additionally, Gold occasionally will peak at or near new moons. 2/23/20 is a new moon.
Gold Commercials - their the group with the most money, have the largest Gold Futures short interest for in over twenty years!
Daily RSI has a bearish divergence.
I issue Red Alerts when there's overwhelming evidence of a bearish turn.
If GLD and Gold are at a potential top, the subsequent bear market could last for years.
This is a RED ALERT!
Mark

Trading Edge 2020 Portfolio -Trade #4- GLD - Put Debit SpreadTicker: GLD
Position:
- 21st Feb 2020 Put debit spread
- Long $150 strike Put - delta 0.90 - cost = $3.65
- Short $148 strike Put - delta 0.70 - credit = $2.04
- Net cost/ spread = $1.61
- Running 5x spreads (5x of both strikes)
Net cost = $805
Profit target/ break even/ exit:
- Max profit of the spread at expiry = cost of the spread minus the width of the spread = $1.61 - $2.00 = $0.39 (24% of cost of spread)
- If GLD remains under the short leg of the spread ($148) by expiry (21st Feb 2020) then the spread will have achieved maximum profit
- Break even for the spread at expiry is the long strike minus the cost of the spread ($150 - $1.61) = $148.39 (white line)
- Exit if GLD closes just above the break even point ($149/ Purple line)
- Can also exit the spread earlier if 80% of maximum profit is realized = 0.39 (max profit) x 0.8 = 0.312 + 1.61 (cost of the spread) = $1.92 (more conservative exit price for the spread)
Rationale:
- GLD appears to be stalling around the $148- $150 range
- Stocks are still a little too extended for me to look at longs, however i realize that higher equities are on the cards for the next week or so, this is a more conservative to way to play both the stalling momentum in gold and the relative strength in equities
- The upside is capped with this strategy, however it is still a relatively good risk/ reward, particularly with the higher delta spread (short leg being delta 70)
- TradingEdge

GLD/SLV Ratio ready to fall?SLV has been quietly going higher but gold's pace has been faster as of late. I expect this to begin to fall as silver works to break out of a long standing base. Very little downside left in silver at this point. Look for silver to outpace gold's percentage gains very soon. Looking for a ratio at 7.67 or so.
Nice breakout for GOLD again and SILVER is also looking good
Gold broke out again and i also like the chart formation what silver SLV is forming it's looking like a reversed Head & Shoulder.

GLD / XAUUSD - Getting toppy?I know people are very bullish with the yellow metal, in fact, everyone i know is bullish.... but something like this is a possibility. I think the easy part of the ride up is behind me and now I am being cautious from here on.
There's a difference between the XAUUSD and I was looking for around $1640 +/- on XAUUSD but GLD looks to be pretty toppy.

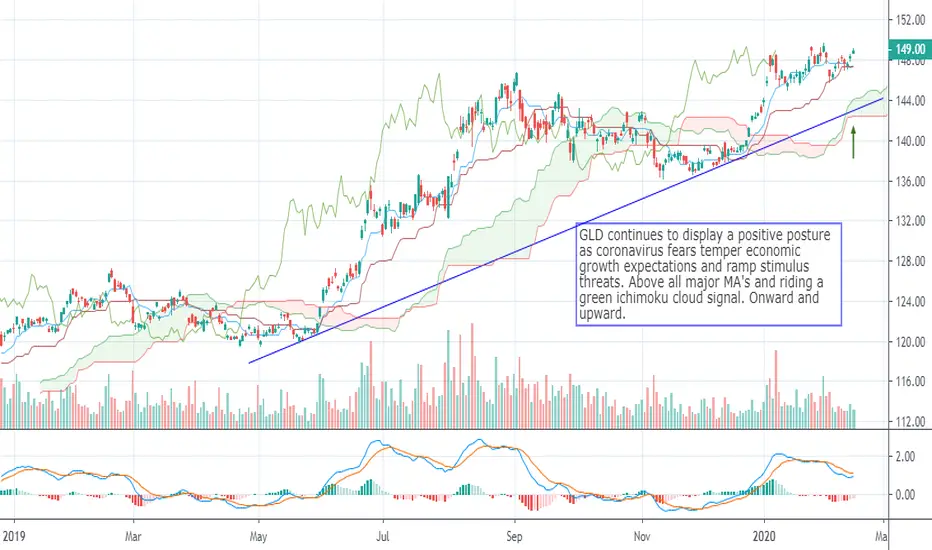
$GLD Nears Fresh Breakout on OutbreakGLD continues to display a positive posture as coronavirus fears temper economic growth expectations and ramp stimulus threats.
Above all major MA's and riding a green ichimoku cloud signal. Onward and upward.
GLDSystem T Performances: Annual Compound Profit 40%, Win Rate 55%, Risk/Reward Ratio 1:2, 20 Years of Backtesting Data, Over 100 Markets.
* Click Like and Follow to Support My Work!
---
Hi Traders,
I'd like to introduce the System T, a computerized trading system that analyzed and backtested the 20 years history data of over 100 markets.
This post is my sharing of how I think about systematic trading and the signals generated by the System T.
(This is my opinion only, NOT the financial advice.)
I think that for the system to open a trade and manage risk, it only needs a buy signal & a stop-loss signal clearly on the chart.
Once the system finds a good trend, it will ride it as long as possible. The stop-loss will be adjusted accordingly to the new price movement.
(Remember to follow this trade idea and follow my profile to get updates about the stop-loss adjustment and sell signal based on the latest price and market conditions daily.)
System T performances above will give you an idea of how it performs in the last 20 years.
Notice that this result was achieved only if I strictly followed the rule: "Only and Always Buy & Sell based on the System Signals".
Don't sell when there is no sell signal as we all want to follow the good trends til the end like everything in life does. \(^-^)/
Also, my system is extremely diversified through over 100 markets so that it only risks less than -1% of the total capital per trade.
Thank you and good luck!
---
DISCLAIMER:
I am NOT a financial advisor, and nothing I say is meant to be a recommendation to buy or sell any financial instrument.
My views are general in nature and I am not giving financial advice. You should not take my opinion as financial advice. This is my opinion only.
Do your own due diligence, and take 100% responsibility for your financial decisions.
Trading and investing are risky! Don't invest money you can't afford to lose, because many traders and investors lose money. There are no guarantees or certainties in trading.
- Content is for education purposes only, not investment advice.
- Trading involves a high degree of risk.
- We’re not investment or trading advisers.
- Nothing we say is a recommendation to buy or sell anything.
- There are no guarantees or certainties in trading.
- Many traders lose money. Don’t trade with money you can’t afford to lose.

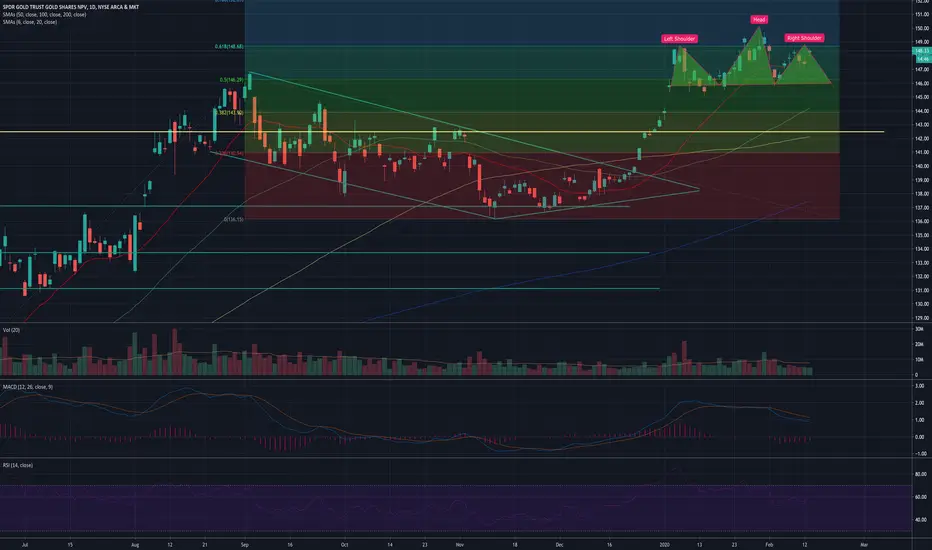
GLD - H&S pattern?Could be. Looks like there are some gaps that need to potentially be filled. RSI and MACD still not favorable but FIB support for now. I see $2-$6 of downside here with any positive news from coronavirus. Perhaps to the next fib level in the $144 range. Gold has all the reason in the world to be running away from us except for the market which continues to march higher as gold treads water. This is a tough call. Little slippage into the close for the overall market. Gold not catching any additional bid. I think the path higher for gold goes through a lower number. Bought a small amount of GDX, NEM and PAAS. No new NUGT purchases yet. Chart of GDX looks like the triangle inside the triangle will resolve to the downside.
PULLBACK FOR GOLD OR ONE MORE PUSH?The region of 152.5 and 155.5 is extreme resistance for gold.
We do have a bearish divergence and resistance as well on the RSI.
Gold can either push one more leg up to the resistance are and then drop, or its possible it drops now and gets ready for this next leg up.
Anyhow looks like soon a retracement is coming.

GLDHere is a look at gold using the GLD etf (previously posted one of XAUUSD). GLD is setting up very similarly to how it did in June of last year before running up more. Break out of the wedge to form a little handle at previous highs. Wouldn't be surprised to see another gap & go towards the 0.618 retracement.

Potential downside trade for GLD.Dollar having a beautiful breakout on the daily and the market recovering pretty well after some recent consolidation. Brings in a potential trade opportunity to take a bearish position on GLD for short term.
Possible ideas: 03/06 GLD 147P for 1.0 or the 148/146P spreads.

GLD and Gold Could be Rallying into a Very Important PeakOn 9/8/19 I posted that GLD had marginally exceeded the 50% retrace of GLD's 2011 to 2015 bear market. It looked like GLD could be in a decline down to the 130 to 134 area.
GLD made a bottom at 136 and, could within about a week - rally into .618 resistance at the 153 area.
Gold Seasonal patterns are bullish into mid-February then bearish into April.
So far weekly RSI, MACD, and Stochastic have bearish divergences.
The evidence from the Sentiment dimension for all three precious metals is very bearish.
The Commitment of Traders Report each week shows the net positions of the main trading groups; Small Traders, Large Traders, and Commercials.
The Commercials have the most knowledge and money - they are the group to follow.
Platinum is just coming off the largest Commercial net short position in 20 years!
Gold Commercials are close to their largest net short position in 20 year!
Silver Commercials are close to the largest net short position in 5 years!
Follow the money - the biggest money for precious metals are making big downside bets.
If GLD can rally into the 153 area within the next 5 to 10 trading days, it could be the best shorting opportunity since the major top made in 2011.
Mark
