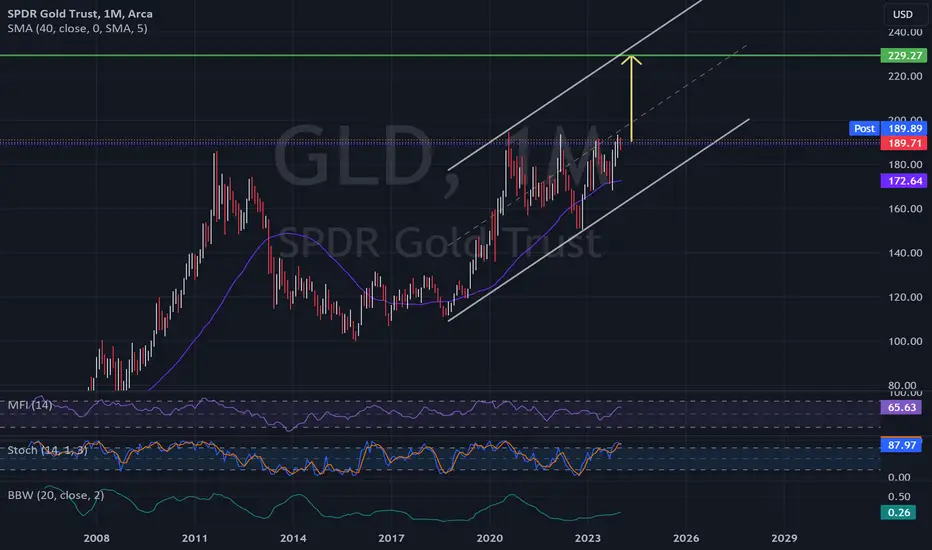
GLD - Breakout of Reverse Head and Shoulders - alertPretty distinctive Reverse Head and Shoulders look. Breakout projection points to 236.
Wave formation may be wave 3. 1.618 fib of wave 1 projects to the 236 level as well.
The neckline has been heavy resistance for years now but the wave structure points to a big 3 of 3 run that will smash through and start its run.
Physical is better for long term Cash over GLD has been steadily rising over time
GLD trade ideas

Looking for GLD to push lower to test Weekly or DailyGLD tapped off the Weekly level 185 and has held it for over a week now.
I think it could just actually hold right here or push down into the Blue line / Green highlighter level Daily level 183 and find support before moving higher.
There is a fresh Weekly Daily MTF level at the Pink highlighter 179. Which is where I would put a short Put strike trading this as a Put credit spread campaign.
I'm not sold just yet on the 185 holding so just waiting.
I like the 183 level better because it has a previous VWAP inflection there.

#GLD giving a Cup and Handle formation on the monthly chartSetting up for a breakaway move that can give us a good upside on Gold
The breakout level has been visited multiple times and getting weaker with every attempt. Should give way soon and give an explosive move.
Will need some sustained presence above the breakout price for a few weeks to be validated as a breakout. Interesting to wait and see the next moves on nthis chart

GLD to Move Above 230While my Elliott wave skills are basic at best, I predict that we are about to enter a Wave 3 move. The formation appears to be a reverse head and shoulders. A measured move above the neckline takes it to 236. Coincidentally, a 1.618 fib. One can expect that degree of a move for a wave 3. Could go higher but seems that mainstream analysts are calling for $2,300 gold this year. Just playing the fibs at best.

Wave 3 to Push GLD to New HighsWave pattern is looking fairly clear, showing that we are in a Wave 3 now. A breakout of the recent highs should push price to 230 and above. When gold starts taking off, it will be moving over 100 a day, 10 points in GLD. Target price could be achieved fairly soon, probably by the time the Fed cuts rates. Many are expecting this in March. My strategy has been buying deep in the money Jan 26 calls. Also building positions in miners and streamers. GLD, NEM, WPM, FSM and a few others
2024 Year for Gold Bulls GLD! This weekly analysis provides an update on Gold (ticker: GLD) following the last assessment in the high 170s. Notably, a bullish cup and handle pattern has emerged, taking the form of a more dynamic head & shoulders configuration within the handle.
The handle, which itself represents a bullish head and shoulder pattern, is poised for a breakout from the right shoulder on the weekly timeframe, anticipated around the $191.77 mark. This pattern suggests a strong bullish momentum, signaling a potential upward trend.
As we navigate the financial landscape in 2024, all indicators point to a promising year for Gold. Stay tuned for further insights and real-time updates as we closely monitor the charts.

GoldBullish moves from gold on the long term charts.
Cup and handle is formed and i doubt this stops and goes back down from here.

$GLD: Metals Before Rate Cuts?We're seeing a greater than 50% chance that the Fed starts cutting in March and I'm starting to wonder if we may need to start getting positioned for a possible probing higher as we look to see how many bulls are interested in gold considering the dollar's weakness.

Expired GLD Weekly outlook. 2nd WK DEC 2023Expired GLD Weekly outlook. 2nd WK DEC 2023
> NEUTRAL 📊 CORRECT
Closed Price: 185.64
Target Price: 184 | Strike Price: 183.23 DEC11
Upper Range: 188
Lower Range: 181

IT'S GLD TIME LET'S GOGold price is on the move so the time has come to buy GLD and wait for the best.

GOLD $GLD Trade Idea
Another chart that I have been following for a little bit that I wanted to share with the community. Here we have the chat of AMEX:GLD
We can see that AMEX:GLD faces strong resistance around the $190 price level. However, with that being said, we see that AMEX:GLD is on a short term uptrend.
In addition, the moving averages are all facing up and further point to short term bullish price action.
In addition, we can see that the price recently pulled back to a key support level and created the H&S Pattern. After breaking the recent diagonal resistance as we can see on the chart.
The price could reach that $190 level in the short term and provide some profits for traders. Then if it breaks resistance, we could see a much larger bullish move and momentum.
Today I entered a neutral and bullish trades on AMEX:GLD AMEX:GLD profiting in case of either scenario.
The oscillators are a little bit overbought at the moment, so I would expect a pullback at some time. Maybe at that $190 level before further advance.
Only something to consider is that AMEX:GLD can be a great way to hedge against market crashes or bearish price momentum.
Hope this was helpful for the readers, if so follow me for mroe trade ideas.
Good luck trading!

Spot Gold ETF GLD going to $270It may take a few years but GLD has formed a cup and handle over the last 12+ years. The cup was formed from 2011 to 2020 with the cup top at $185. The cup bottom is at $100 in Dec 2015.
The handle has been formed from 2020 to the present. The target for this cup and handle is:
Cup top + Cup Depth = Price Target
$185 + ($185-$100) = $185 + $85 = $270
The target price is 46% over the current price. This would be a good profit but it may take a few years to get there since the cup and handle took 12+ years to form.

90% win rate 🚀 Unveil an easy $GLD Call Play with naked #goldHey everyone, Greg is here with a quick rundown of today’s options trading play. I entered the ring with a naked call on AMEX:GLD , aiming for that sweet spot of easy returns on a maximal Pop trade. Today’s golden ticket could net me a max profit of $118 with a probability of profit (PoP) sitting pretty at 80%, all while tying up $3000 of buying power and riding on an implied volatility rank (IVR) of 20%.
The game plan was simple: watch the market, play it cool, and have a couple of scenarios up my sleeve:
(Scenario A) If the price hikes, I'll pivot to a strangle, balancing out with a sold put to accompany my call.
(Scenario B) If it looks like easy money, I’ll lock in those gains and close out the current trade, quick and clean.
The strategy is all about simplicity, with an exit plan to bow out gracefully at about 65% of the max profit. As of today, November 5, 2023, that naked call is open and I’m in the market.
To wrap it up, here’s the play-by-play for today:
Date: November 5 , 2023
Strategy: Naked Call on AMEX:GLD
Opening Credit: $118
Expected Profit: Exiting at ~65% of max profit
Probability of Profit (PoP): 80%
Required Buying Power (Req.BP): $3000
Implied Volatility Rank (IVR): 20
Current Position Balance (as of opening): $118 of credit (1.18cr)
Stay tuned to see which scenario unfolds and how the trade’s balance shifts in the coming days. Keep it easy, folks!

Gold quarterly outlookIn analyzing the gold market, I've observed a recurring pattern of ascending triangles over the past three years. Additionally, I've identified a discreet descending channel , a pattern often associated with bullish trends. Anticipating a breakout from the upper boundary of this channel by February 2024, it's noteworthy to consider the potential role of the March 2021 trendline, which may act as support in this possible scenario.

$GLD Cup & Handle Monthly Chart### Technical Analysis Update: AMEX:GLD Cup and Handle Formation on Monthly Chart
The SPDR Gold Trust ETF ( AMEX:GLD ), which tracks the price of gold, is exhibiting a notable pattern on its monthly chart known as a 'Cup and Handle' formation. This pattern is of keen interest to technical analysts and investors, as it often signals a bullish continuation trend.
#### Understanding the Cup and Handle Formation
The Cup and Handle is a bullish chart pattern that resembles the shape of a tea cup. This formation typically occurs in an uptrend and is indicative of a consolidation period followed by a breakout.
1. **The Cup**: This is formed when the price first experiences a gradual decline, followed by a stabilization and a rise back to the original starting point. The price movement during this phase should be rounded and shallow rather than a sharp V shape, and it usually spans several months to a year. For AMEX:GLD , the cup formation suggests a period of consolidation after an initial sell-off, followed by a gradual and steady recovery to the previous highs.
2. **The Handle**: Following the cup, a small downward drift in the price forms the handle. This is typically a retracement that does not go below the half-way point of the cup. The handle represents a final consolidation or a shakeout of less committed traders before a potential breakout. It's often seen as a bullish flag or pennant.
#### Implications for AMEX:GLD
For AMEX:GLD , the appearance of a Cup and Handle pattern on the monthly chart is significant. It indicates that after enduring a period of correction and consolidation, the ETF is potentially gearing up for a continuation of its prior uptrend.
#### Key Points to Watch
- **Breakout Point**: The critical level to watch is the resistance line formed at the top of the cup. A convincing breakout above this level on increased volume could signal the continuation of the bullish trend.
- **Handle Formation**: The depth and duration of the handle are crucial. It should not drop significantly into the cup and should show signs of stabilizing or minor retracement.
- **Volume**: A genuine breakout is often accompanied by higher-than-average trading volume, adding confirmation to the pattern.
#### Trading Considerations
Investors and traders considering positions in AMEX:GLD should closely monitor the completion of the handle and the subsequent price action. A breakout above the cup’s rim could offer a potential entry point, while a failure to break above or a drop below the handle might necessitate a reassessment of the bullish hypothesis.
As with any technical pattern, it's advisable to consider the Cup and Handle formation in conjunction with other fundamental and market factors. This comprehensive approach helps in making more informed investment decisions.

$GLDC&H, looks very constructive, the best way to play this is trading it in a weekly chart, trading the ETF allows to mute the noise in XAUUSD


GLD with DPO 63 Cross overOnce again, DPO leads the GLD, reinforced by a liquid options market. Review the 165 puts expiring 3/24

GLD time to flee?18 days over the 5 day MA of lows in GLD. That ratio generally indicates a high. Let’s see if Powell adds fuel to the fire tomorrow.

Long trade on GLD ETF buying the correctionAm less likely to look up a symbol of what am trading as not to build an emotional reaction to the trade. Am more concerned with the story the price chart tell me. Everything that everyone knows is reflected already on the price chart. Supply and Demand tell you a story. Learn to listen to it.
In this trade, we are looking at the most popular traded ETF for Gold. The setup is one of my best trade setups.
The long-term chart (M) is in uptrend. The current chart(W) is in a downtrend mostly a correction.
Price arrives in a Demand zone on the current-chart(W); providing a low risk entrance into the trade. the STP loss is below the Demand zone. and the trade is open. Blue arrow.
The stock market is bearish, the Gold react bullish. standard relationship as the big money withdrawal out of liquid stock into a temporarily safe haven of gold. History is predictable here.


Puts idea - GoldI think is going to pull back to the 175 support before breaking out the channel. Just bought puts exp 10/20 strike 178. Is a little risky but I'm jumping in anyway.

$GLD lower after Friday's pop, return to 180 by Oct ExpirationGLD had a nice pop this week, but overall trend and positioning remains downside. Expecting a drift lower toward 175's put support before bouncing after 9/22 expiration toward 180+ into mid-October expiration. Follows the Gann Fan perfectly.
