HYG -- PREMIUM SELLING PLAYYou know what they say, one's man's junk is another man's treasure ... . With an IVR of 100 and an IV of 18, this may be as good as junk is going to get for premium selling (don't quote me on that; further sell-off could be on the horizon ... ).
HYG Jan 29 74/84 short strangle
POP%: 75%
Max Profit: $109/contract
BPE: ~ (Undefined/After Hours)
BE's: 72.91/85.09
HYG trade ideas

HYG V SPY the tolerance for high risk HYG represents the tolerance levels for high risk investment, versus here, the stock market in general. Note the strengths and tilts of the high of the 4 indexes, us30, spy, nas100 and imw. small cap stocks suffering the most here. nas100 flying the highest, the most against the force of gravity, which is the risk off trade. Oil gapped down when the price of crude dropped below previous lows with no policy, and no support levels that are to be trusted for now. If the oil prices drops too low, it will absolutely break the backs of high debt oil producers. And with Iran oil stored supplies coming on line soon, 20's oil could be a reality, dragging down the markets with it. Watch HYG for big money risk. Lots of corporate bonds are involved in oil debt. Note the volume sell spikes in HYG and in oil. (not on this chart) note the vertical line moments of action, and which way the action changed the trends of the indexes Versus HYG. interesting.

HYG Leading SPY Lower?Junk bonds are typically just that - junk. But, the iShares High Yield Corporate has been one of those crowded trades that just do not die.
After witnessing the immaculate short squeeze from 1,864, the SPX staged an impressive rebound. But as I mentioned earlier today (on my InvestFeed - link below), the SPY is looking weak, and the ADX, which measures trend strength, is beginning to fall.
This is interesting because HYG tends to flow with the SPX (and SPY). As equities had a sharp correction so does high-yield The opposite is also true, and junk bonds rallied along side equities. SPY also acts more "violently" when prices diverge greatly.
According to ETF Daily News, roughly $10.7 billion was injected into U.S. equity ETFs last month, while $8.3 billion of inflows were seen in U.S. corporate bond ETFs - the largest monthly inflow recorded. HYG took in just over $5.5 billion.
This is important because today's trader shows the epitome of herd behavior: all cramming into a few trade ideas. So, when that idea doesn't material, traders flee and the response is not exactly orderly.
Price action is on a few minor support levels, but there is bearish EMA, RSI and DMI momentum. ADX looks to be moving upwards supporting negative price action.
If the SPY breaks down lower (I'm expecting mid-160k NFP tomorrow), this could spell trouble for HYG.
CommoditiesTrader now on InvestFeed: beta.investfeed.com
Please follow me on Twitter @Lemieux_26
Check my posts out at:
bullion.directory
www.investing.com
www.teachingcurrencytrading.com
oilpro.com

How Strong on the EM and HYG Winds from Japan's Investment?The Japanese pension fund GPIF announced on September 30 a new mandate to invest in international emerging market and high-yield securities - a risky endeavor for a pension system but necessary given the tepid returns and growing liabilities. How long does this new wind keep these assets aloft? What happens to Japan's pension fund should the markets take a deeper dive?

Play Expanded ECB Q€ w/ Long HYG above 86.50The ECB has to expand QE. We've seen:
Decelerating economic data, led by Germany
Abysmal and worsening inflation expectations
Persistently stronger Euro (ECB is VERY keen to see weaker Euro. They sold Germany on QE b/c of Euro strength)
Yesterday, we saw bleak Eurozone lending survey data, to boot
I expect Draghi to, at a minimum, hint at expanded QE - read as "yield stability". His words have been very powerful in the past, and we're likely to see an over-reaction (weaker EUR/USD - GS estimates 2 big figures) should he speak up. Such an overreaction will likely filter through to US high yield. This morning's exuberance in US and European equity markets and credit spreads, in spite of weaker oil and China's overnight tumble, smells of positioning for central bank easing.
HYG has staged an impressive rally from its October 2nd lows. It's taken out its prior low at 83.45, rebased at 84.63 and has since broken through bearish trendline resistance from late May. 86.50 provides a solid resistance level to get long above, with plenty of room to run higher.
Wave analysis points to an intermediate target at 88.51, while fib extensions are a bit higher at 89.62.
I'm poised to enter some 86 calls today as a speculative play on an EBC overreaction. Will re-evaluate the trade after hearing from Mr. Draghi.

US Junk Bonds Giving New Sell Signal Setup - see entry rulesOctober 2015 Update:
The magnitude of the decline still isn't that great here, as the trend turned down in September with HYG at a little over 91. It is down to 85.11 (and HYG has paid monthly dividends of roughly 40cents for 12 months now, so they are really at a small 1 point or a 1% loss right here). Still, when risk taking earns you a loss after 12 months, it certainly means there are no profits to distribute (and spend in the real economy) and boost the mood.
When HYG is lagging behind the return on US Treasuries (use TLT, and see link below on the ratio of HYG/TLT), then it is another sign that investors are running for safety.
Now that CCI, a simple price oscillator, is above +100, which is similar to a 1 standard deviation move above the 11-day average, it means that the price is overbought and since we are in a downtrend, you want to sell short on a violation of a previous day low. The setup is that we are overbought in a downtrend, but the ENTRY STRATEGY is that we break under a previous day low. It requires both steps to enter a trade. If the market continues higher, we are waiting to sell at higher levels.
The downtrend will take awhile to reverse since we are about 5 or so "ranges of trading" away from turning trend up. What does "Ranges Of Trading" mean? If the market traded up by an average range every day for 5 days, then the trend would turn up. That's a rough way to explain it. Either way, don't confuse a "sell set-up" with an "entry". You can certainly use your own indicators to enter the market on the short side here and I'll do my best to follow up when this signal triggers. Feel free to send your entry signal here and we can all monitor how we are doing collectively.
Lastly, if you short going under the low of the previous day, the stop is the high of the rally. The exit is when CCI reaches -100 and/or a trailing stop using the 3-day range. My latest simple method for getting out is to use the 4-day moving average of the closes and if that increases, then cover.
All the best,
Tim 8:10AM Sunday, October 10, 2015 85.11 last HYG

HYG/TLT Ratio Essential For Stock Market TrendsHYG/TLT Ratio
Is a simple ratio of Risky Bonds vs Safe Bonds
IF this ratio is declining, risk is getting punished.
Note how the stock market goes sideways if this ratio is declining.
Siamese Twins Here as Banks De-Leverage from 2007-2010.
Since then if HYG/TLT is declining - the stock market is is flat over extended periods of time. Note the red arrows marked "SPY SIDEWAYS".
Recently, there is a similar price pattern in this ratio to the low in 2012. The Ratio made a double bottom with a strong reversal off of the bottom (note the yellow circle) and then a drop again after that bounce, which we are in now.
Look for HYG to turn up relative to TLT in the coming days and weeks as a sign that the stock market can build the chance for a rally. For now, there is no signal. Rather, it is mirroring the last bottom from the summer of 2012.
Tim
3:16PM EST Sep 23, 2015

HYG TLT Breakdown being back testedThe break down in the long term trend line of HYG/TLT that occurred in December is currently being back tested. If the breakdown holds, this will mean Treasuries are set to outperform HY. Reversing the under-performance of treasuries to High Yield that started in February. A quick move to $88 from current $90.35 on HYG would not be surprising.

IBOXX high yield (Daily). Bear Trend resumed.Rebound from Dec 2014, but reversal at 2014 down trend_line, 61.8%, 200 sma.
MACD Cross_Over and turn.

High Yield - Resilient in the last few days.
This strength gave me some clues that Equities may bounce from here.
Note that the index is probably supported by lower rates.
In the next few weeks, equities rallying, and rates going down, there may be a relief rally to 93.
93 could be the point of short again..

HYG-TLT 6 Yr wedge breakdownHigh Yield corporate bonds are breaking down relative to long dated govt bonds. It appears the break down of this 6 yr wedge help accelerate the losses in HYG during last week while helping TLT add to its gains. The bottom trend line of the wedge has been an important support line for this ratio over past several years. With this break down, it seems possible for the ratio revisit the lows seen in both 2011 and possibly 2008. Most likely through more losses in HYG and more gains in TLT.
If S&P 500 is going to find a tradeable low heading into the end of the year, it would seem that this ratio will need to stabilize. As can be seen in this chart, any important previous low made by the S&P500 has also seen a corresponding low in this ratio.

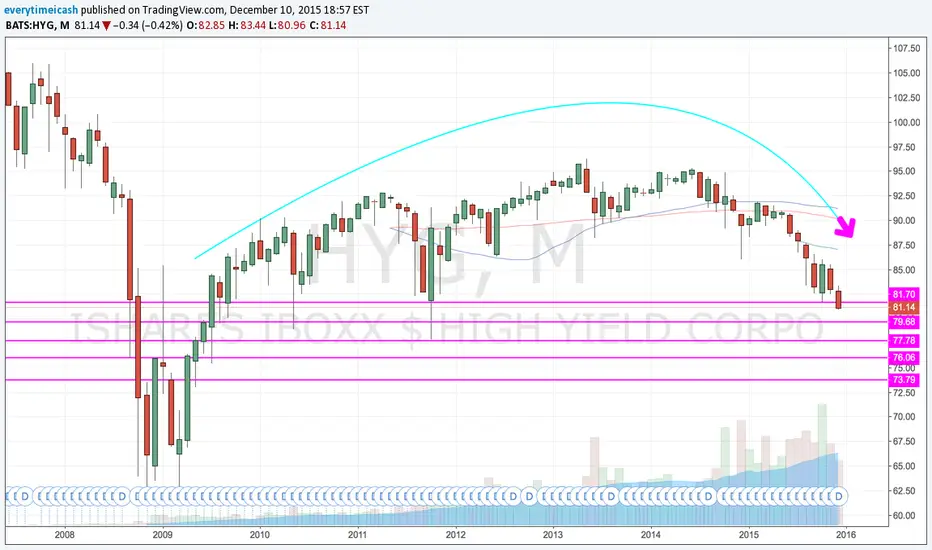
High Yield - If the slide carries on, it could reach the 80 markHigh Yield bonds had been under performing equities for a while (note, there is a ~ 6% annual coupon (dont know the exact figure) that is distributed monthly... so the chart understate the performance by 6% - Sp500 dividend...)
Now with Crude Oil falling hard, it seems as a big part of the index is related to shale gaz, there are distress situation out there...
if the slide carries on, HYG could go reach the same tension levels than in May10 or Oct11 around 80.
I would not know how to short it from here, just information, better short some toppish equity index if you believe in the short: R2K, TRAN etc..

One year of divergence between stock markets and bond marketsThis is a similar chart to that published by Technician (see related idea below) that shows a clear divergence between stock markets and bond markets. I realize after making this chart that I had identified several bearish signals in bond markets at the start of the year, and I thought that we would thereby see a stock market correction in 2014. Stocks are the only asset class that has been subject to a sort of risk-off trade this year, and one might suggest that certain factors like corporate buybacks explain the divergence we've seen between the SPX and the HYG/TLT ratio.

High Yield Corp Bonds are again flashing a warning for SPYAnother sign of caution for equity prices is the rolling over of High Yield Corp Bonds (HYG). The price of HYG does tend to alert us to the time when investors are pulling money off the table in the markets and cashing in their chips. It's not a perfect indicator, but it is an indicator that I watch, amongst many others. I have noted that IWM (Russell 2000 Index) has failed to hit a new high also, which gave us a good signal to short two times so far this year.
Note how HYG is just sliding slower at a steady pace. Clearly, investors piling into the USDollar are NOT buying High Yield Corporates, but if they are, it means that existing investors are swamping them with more supply than they can handle. In either case, this is a warning sign to pay attention to.
When this "log rolls over", there could be some fireworks.
I'll put "buy on HYG" and "sell on SPY" here.
Tim

Look at what Funds do, not what Funds sayFrom another dimension, Junk Bond (HYG) to Treasury Bond(TLT) ratio. This is a similar concept to Staples(XLP):Discretionary(XLY) i posted earlier.
HYG - the high yield bond (Junk Bond-Speculative) is the place where Fund managers wants to be when market is making uptrend, it carries high risk with it.
TLT - the treasure bond (Safe Bond) is the place where Fund managers wants to park their money when market is crashing.
As the ratio gets lower and lower, this happens when Funds are flowing into TLT.
As we can see, the Fund have indeed flow into the TLT since Jan 2014. But they did it so stealthily that it wasnt so obvious.
Now, the ratio is about to hit 0.73 which is the support for the symmetrical triangle pattern.
If it holds, then perhaps market will have some rally..
if it break down.. then i can only chant "Allelujah"

Triple DilemmaI don't have the stats, but you probably know that many S&P 500 companies are using debt as a way to finance its share buyback program. (Yes, I'm talking about you Apple)
So these companies are in a triple dilemma.
1. Investors are closely scrutinizing their bottom lines every quarter (Whatever happened to the big picture and the Oracle of Omaha, the Moses of Investing, no wonder people love to say they believe in what he believes in but actually don't give a sh!t about what he believes)
2. Considerable time or not, Fed is raising rates, spread is gonna get bigger.
3. It's midterm, the last thing that the Congress wants is, well, to actually do something. So even multinational companies have an abundance of cash, they can't bring it back without getting taxed.
I've only been trading for a little while, so all I know is drawing lines or stuff...but the chart does look dire to me. CNBC is having all sorts of clowns on today talking about this is a long secular bull market, that got me even more worried. I know my credibility just got hammered by mentioning CNBC, but please let me finish, I watch it for entertainment purpose, it's like a financial reality show+tabloid, how cool is that!

PAIRS TRADE: LONG HYG, SHORT SPYHigh Yield Corp Bonds are trying to turn
up from oversold. The recent selloff in HYG
was giving us the heads up that stocks were
vulnerable. The way to trade this setup is to
buy HYG and short SPY. $2 in HYG vs $1 in SPY.
Tim 4:32PM EST HYG 92.69 last, SPY 200.48 last.

High Yield Corp Bonds HYG Daily - Gave us an early warningI published this "late" call back in February as HYG was bottoming. The chart then was the gray triangles. At the time, we couldn't graph the DIVIDEND payments, so I painted them in blue "arcs" on the chart. The divs are on the first of every month and are roughly 45 cents each time +/-. Note that the ATR rose into "RISK" mode in mid-July as the price fell, implying that sellers were getting aggressive and prices were slipping. Typically, you will see selling in High Yield Credit first to indicate that it's time to take money off the table in equities. The current rise in "RISK" is to the same level as back in February, so it is at a key level here of 0.40 (the 10-day Average True Range).
I think a bold trade here is to buy it at 92.22 and exit and go short at 93. The stop on each trade here is 0.50 pts from entry. Target 91.50 on the short trade from 93.
Tim 9:47AM EST 8/1/2014

High Yield Corporate Bond HYG rolling overThere is a warning here for Bernanke about the market's perceptions about lending to corporate America. But for us traders, this is a decent risk-reward trade to short "junk bonds" and look for lower prices short term. It looks like buyers have stepped aside and now there is marginal selling going on in this market.
You can see the average range is picking up after a long slide. This merely points out that money is flowing into or out-of a market and in this case it is flowing OUT.
Look for short-term declines and sharp rallies to re-short.
Target and stop are posted.
Tim 10:35AM EST 2/3/2014


