One More Leg Up? Long SPXBonds are giving us the signal that good times are on the horizon. This signal (bond equity divergence) has been my favorite signal this year, and I am hoping it continues to remain fruitful. I would not fade this indicator! Going long up here seems scary, but this gives me confidence that I didn't miss the final big move down :)
HYG trade ideas

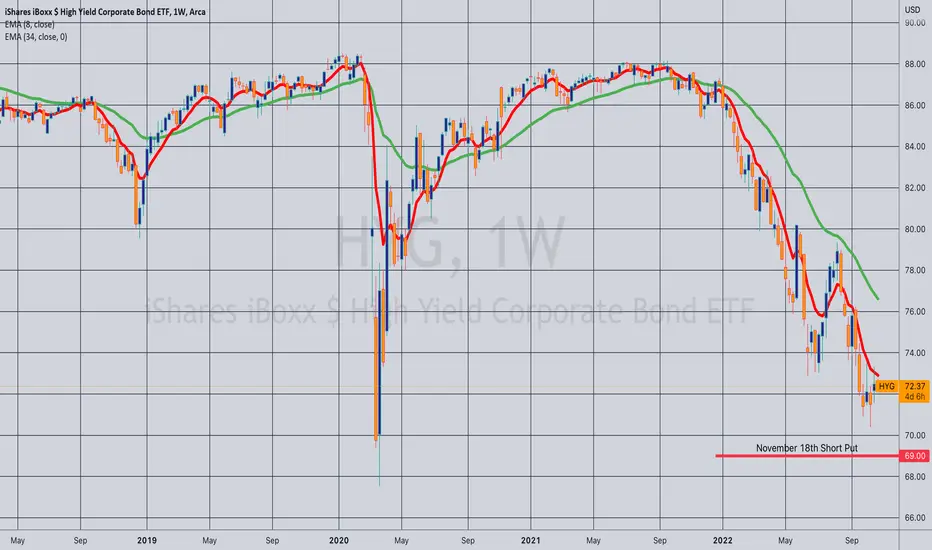
Rolling (IRA): HYG November 18th 69 to December 16th 69... for a .35/contract credit.
Comments: With the November 18th 69 converging on .10, rolling it out for a credit about equal to the monthly dividend. Total credits collected of .42 (See Post Below) plus the .35 here for .77 ($77) per contract.

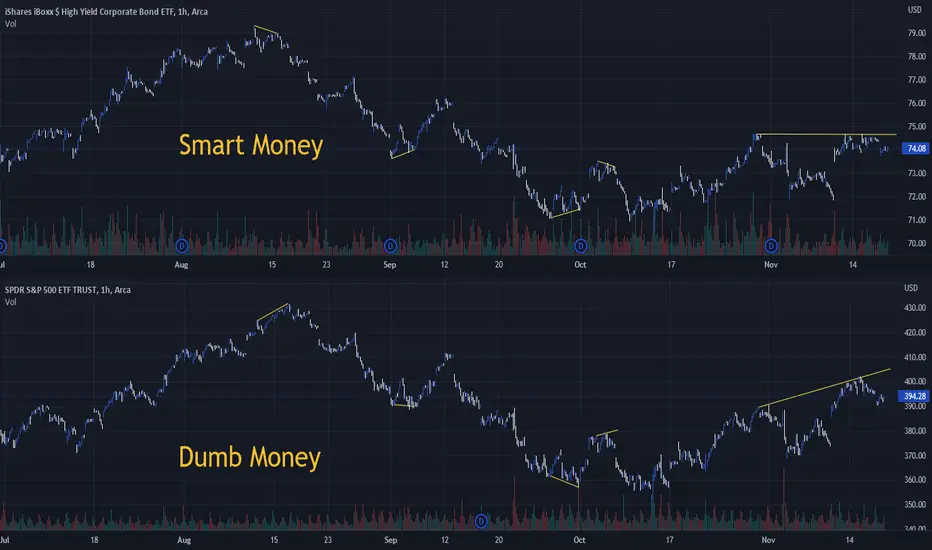
Smart money vs dumb money divergencesAs you can see, when there is a divergence between these too charts the charts tend to go the way that Smart Money predicts.
Currently we havent made a higher high on the smart money while dumb money has, this can still happen but i think caution in the market is required.
tracking fear and greed #hyg #vix #dia CNN business has a wonderful fear and greed indicator. I love it. So I made my own version to track real time sentiment. Im using junk bonds prices - vix volatility to mimic cnn's version.
DIA AAPL GOOGL MSFT TSLA

Opening (IRA): HYG November 18th 69 Short Put... for a .42/contract credit.
Comments: Targeting the strike paying around what the distribution would be were I to actually be holding shares. The last distribution was .351 per share; 5.19% annualized.
HYG chart possibly firming upHYG hasn't made lower lows as the SPX. Just decoupling because HY is cheap or maybe the foreshadow of a bottom soon.

BTC, SPX, RUT wide gap from HYG. We're up for a rude awakening dear fellows,
it came to our attention the monthly chart of HYG, BTCUSDT, SPX, RUT. they all belong to the same class of speculative assets.
of them, HYG is likely to have the greatest demand for liquidity as it lives out of refinancing its cash flow, let alone its debt.
notice how
1. they are synchronized in what concerns the bottoms
2. HYG renewed the lows at each new bottom, never the highs at each top.
3. the others did the opposite
this mismatch opened up a wide gap in the logarithmic scale of the y axis.
the logarithmic scale shows how much percentually current level still can fall.
thus, BTC, SPX and RUT still can fall more than they did already until they catch up with HYG.
that is precisely the case of FED keeping current policy "until something brakes".
that would be a rude, late, awakening for anyone not knowing where to look at for market health check.
best regards.

Short Term Bottom. Bond DivergenceGet ready for a short term reversal!
Bonds making higher lows while equities make lower lows has been a tell tale sign of a short term bottom so far this year.
As long as we see some follow through early next week, we should get a bounce lasting for at least a week.

Divergence Between $HYG and $SPXHere we have a study between the resulting move from a divergence between High Yield Corporate bonds ($HYG) and SPX. The bond market seems to be ahead of every move when compared to the broader market and hints at strong reversals when divergencies emerge. If we look at every big reversal the last few weeks, $HYG divergencies when compared to SPX have led to a strong reversal; whether $HYG is making higher lows while $SPX makes lower lows (bullish reversal on equities incoming) or $HYG makes lower highs while $SPX makes higher highs (bearish reversal on equities incoming). This is a great study to look at ahead of data as the bond market front runs the market!
What is a High Yield Corporate Bond? A HYCB is a type of corporate bond that offers a higher rate of interest because of its higher risk of default. When companies with a greater estimated default risk issue bonds, they may be unable to obtain an investment-grade bond credit rating- sec.gov
And in an environment where growth stocks have an obscure future given inflation and high interests rates which equates to drastic drops in consumer spending and economic strength, this is definitely something the market responds to quickly and swiftly.
OptionsSwing Analyst
Daniel Betancourt

Bullish Ascending TriangleHere is a nice example of a bullish Ascending Triangle.
Put/Call ration is 4.31 and Open Interest in top 10 for Sept 16 expiry
After that it's quad witching and FOMC so anything goes.
Volatility I'm sure it's getting tightly wound for quad witching and Powell.
Volatility gained strength today despite indexes being higher.
My overall outlook for volatility is more compression into 4XOPEX & FOMC.
CPI in AM could change outcome significantly to the up or down side.
My idea is long 9/16 and short to end of Oct.

HYG vs QQQStarting to see some short term deviation between Q's and HYG. So far this year bonds have been a leading indicator, with equities and tech following behind it. It led the bounce in June and hinted at the drop again mid august. Let's see if we can get some conformation here and hopefully some lower lows.
Hint: look at when they cross

U.S. INTEREST RATES IN THE 2 YR 5 YR 10 YR HAVE TOPPEDTOP WAVE STRUCTURE the chart posted a week ago is very clear we have peaked in ALL interest rates and A major I..T. top in U.S. $ Iam 75 % net short the DXY at 109 I stated the alt target was 110.25 the original projection was 114/116 DO NOT BE LONG THE US $ THIS SHOULD BE A STRONG POSITIVE FOR BONDS STOCKS and ALL Metals move to a net long Silver copper gold platinum NOW rally to start or has begun .best of trades WAVETIMER
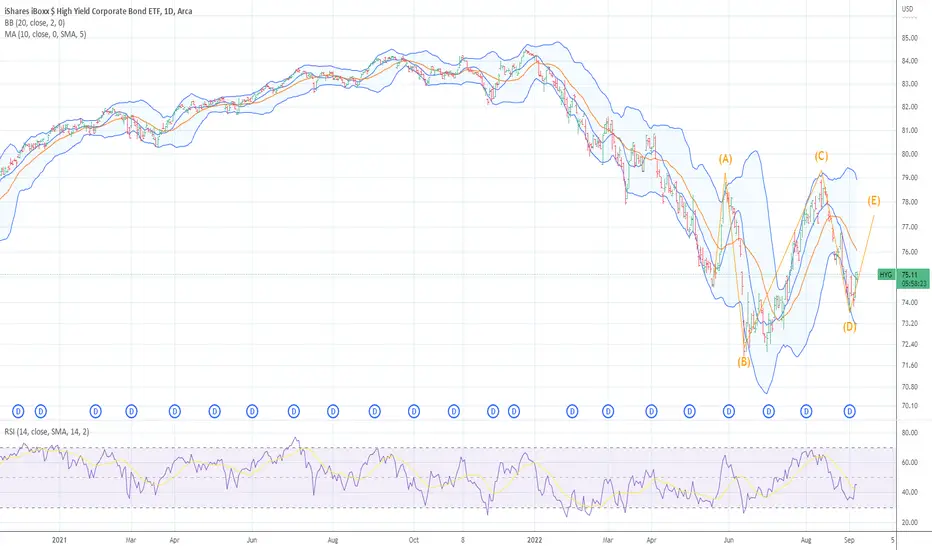
JUNK BONDS HYG WAVE D .887 The chart posted is that of hyg the junk bond market . so far we all three waves within the structure . if we hold here at a .887 golden ration we would then see the last rally this market will see for years to come we would then see wave E UP THIS WOULD BE WAVE B TOP

A bullish scenario for HYGThe iShares iBoxx $ High Yield Corporate Bond ETF seeks to track the investment results of an index composed of U.S. dollar-denominated, high yield corporate bonds.

A bullish scenario for HYGTake profit level: $80
HYG tracks a market-weighted index of US high-yield corporate debt.
In general terms, HYG is a perfectly adequate high-yield corporate bond index ETF, with a reasonably good yield. Adequate does not mean good, as the fund compares unfavorably to most of its peers in three key metrics: expense ratio, dividend yield, and total shareholder returns.

Looking for Short HYGHi Everyone,
I'm waiting for Short if the break break the trend-line.
Signals:
- Price in Resistance.
- Main Trend, Bearish.
- Close to The top of the Bearish-Channel.
Good Bye & Good Trading!!!

Short @ 77 Lately there's been a short covering rally in high yield/junk but I think that ends soon with big tech earnings, FOMC and all of the other economic data releases this week. Macroeconomic picture has not changed.
Don't think we break this downward trend line that's been in place all year. I'll also take a long position in TLT to offset exposure.
*Not financial advice.

Junk Bonds are testing a 7 month old downward trendline!If you’re chasing portfolio income, you may be eyeing high-yield bonds, also known as junk bonds, which typically pay more interest but carry greater risk.
Since interest rates and bond prices move in opposite directions, U.S. junk bond values have dipped to the lowest levels since May 2020. But yields are at 7.5% as of May 17, up from 4.42% since the beginning of January, according to the ICE Bank of America U.S. High-Yield Index.
However, high-yield bonds have greater default risk than their investment-grade counterparts, meaning issuers may be less likely to cover interest payments and loans by the maturity date.

A bearlish scenario for HYGThere are no bad bonds, only bad prices. So Dan Fuss, Loomis Sayles’ vice chairman, has often observed—a lesson gleaned from more than six decades of experience managing corporate bond portfolios. After what seems likely to go into the books as the worst first half of the year for fixed-income markets on record, prices now look a lot better from the standpoint of investors aiming to buy low.
The savvy ones that sold high were major corporations that issued bonds at record-low yields in the past two years. Bond prices move inversely to their yields. So, with benchmark 10-year Treasury yields roughly doubling since the start of the year, to over 3%, and corporate-credit yield spreads increasing over risk-free government securities, corporate bond prices have fallen sharply.

Spotted a correlation between High Yield Bonds and oilThey almost always trade exactly the same.
And HYG has NEVER gone down without oil going down.
Until right now.
Wonder how long it will take to correct.

iShares iBoxx $ High Yield Corporate Bond bullishThis is an opinion from space view. (Monthly charts since inception)
HYG bounced off massive down trend line. Its sleeping just under the support line off all previous down turn in SP500 since 2009. Are we out of the woods? Is there a liquidity a problem? Stores are packed and prices are going down and stabilizing. I think oil is the last thing to stand in the way of global restart.

Market has bottom according to HYG This is a monthly chart of the HYG with RSI. It hit an extreme low level on RSI only a few times in the last 12-13 years. The other times are March 2009, January 2016, December 2018 and March 2020. During these times, the equity market had rallied back up to all-time high after a correction or bear market. This could be a potential market bottom again and a buying opportunity. Remember it was gloom and doom in the news everywhere during all these instances. It looks the same this time. Remember trade what the chart tells you not the news.

Risk-offWhenever HYG is moving down, it is telling us that the risk is off in the equity market. It is true for the current market condition.
When this bottoms, then the market will bottom.
