IBB trade ideas

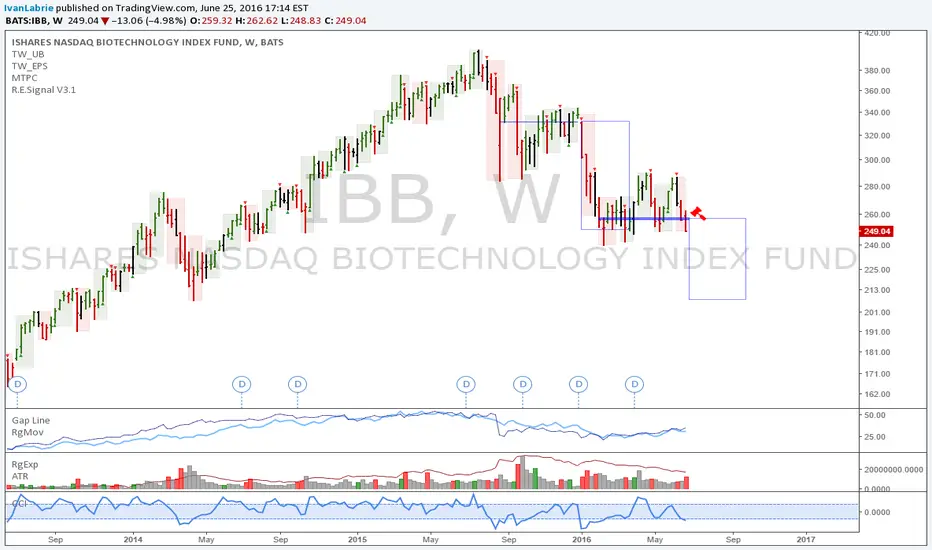
IBB: Short IBB at market openIBB is potentially a giant weekly short. I'd like to go short at the open, or if we get a slight retrace, with stops at 257.58.
Target is as low as 207.70, at the ver least. You can see the previous weekly signal on chart to the left, it hit the target and even exceeded it after confirming the decline as per the 'Time at mode' method.
You may pick your preferred bearish strategy, feel free to comment too.
Check out my updated track record here: pastebin.com
If interested in my trading signals, or in personal tuition, contact me privately. I'm offering a considerable discount on a packaged course which includes access to my private trading signals list for a year.
Cheers!
Ivan Labrie
Link to Tim West's chatroom: www.tradingview.com
We discuss setups like this often there. Feel free to stop by and subscribe to his indicator pack. If you have any questions ask.
Risk disclaimer: My analysis is provided as general market commentary and does not constitute investment advice. I will not accept liability for any loss or damage including, without limitation, to any loss of profit which may arise directly or indirectly from use of or reliance on such information.


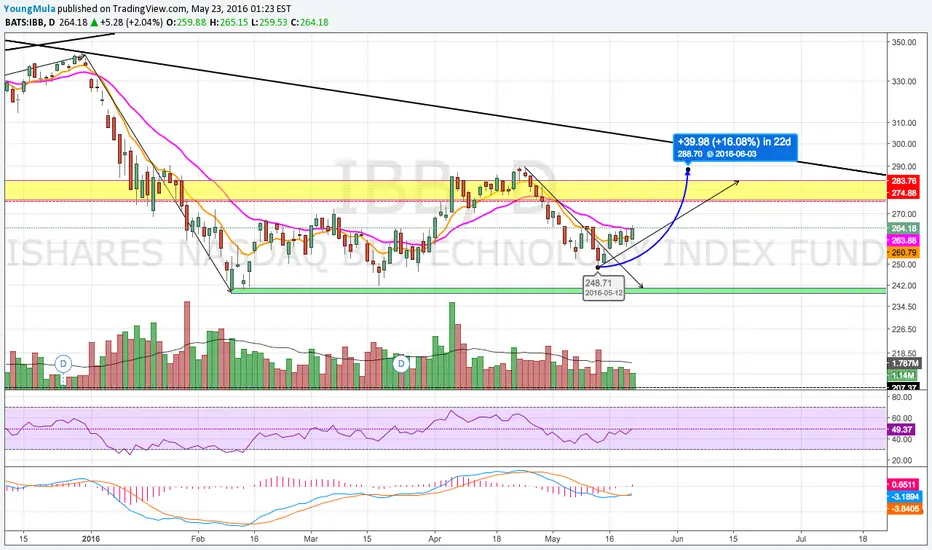
IBB MIGHT RETRACE TO 237.88A potential AB=CD pattern and butterfly pattern , I won't buy until 246 and 237.88.
Stoploss should be around 232.


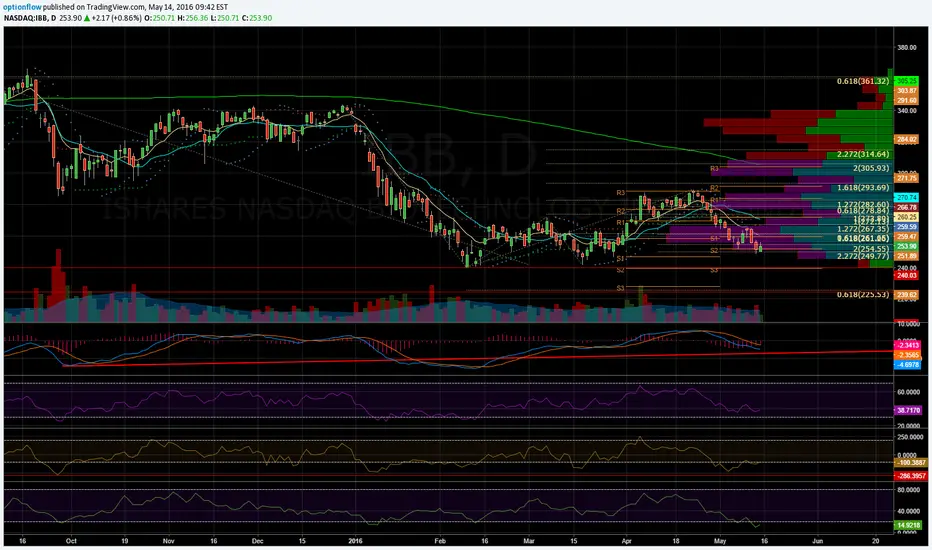
$IBB Daily Chart & AnalysisIBB touched close to my 255.69 target AH on Friday. My belief is we have a sector rotation upon us. I anticipate weakness in SPY and a move into beaten up bio's through October.
Last time macd at same level, Px was 397.58 where an open gap remains. It's possible we see some more weakness before the rotation. $234.96 would provide a secondary test to take out the low and S2 + 1.272 fib ext.
Some bullish divergences in momentum, but can argue in a triangle. Regardless, ATR is relatively low and if you look at past precedent, these lows have been accompanied by a move higher.
Px is below developing VA and top end is $374 Lots of gaps open above at some key fib levels.
I have no position, but watching closely. ( Only bio exposure is VRX in full disclosure)

IBB long at HVN With a lack of confirmation here, I will take a .5% long with an ATR from entry stop.

Weekly chart finding support a 50% retracementWe are seeing organized accumulation at the 50% retracement which mean the overall trend for IBB remains intact and bullish. Failure to hold the 50% threshold would suggest that prices could breakdown to $200. In the meantime demand is contracting on this smaller timeframe rally. This will likely result in a re-test and confirmation of this level following any potential break. If a re-test happens on light volume this is an ideal long entry. If the re-test is on greater than average selling volume watch out below.

Showing signs of accumlation but has to close above $290Bullish above $290. Buyer of $270 as risk is well defined
IBB has been under accumulation for most of 2016. This is try because both the monthly and weekly vertical bar/candle stick charts are in distribution. In other words this smaller timeframe is in accumulation and upon testing $320 will likely encounter longer timeframe supply and continue to break down and test $240.
We can see selling volume contract on the re-test of lows followed by an increase in buying demand. Note; however, they buying volume is contracting into resistance of $290. It is reasonable to anticipate that prices will pullback and test $270 where I suspect strong hands will resume control and push price discovery higher.
Good Luck


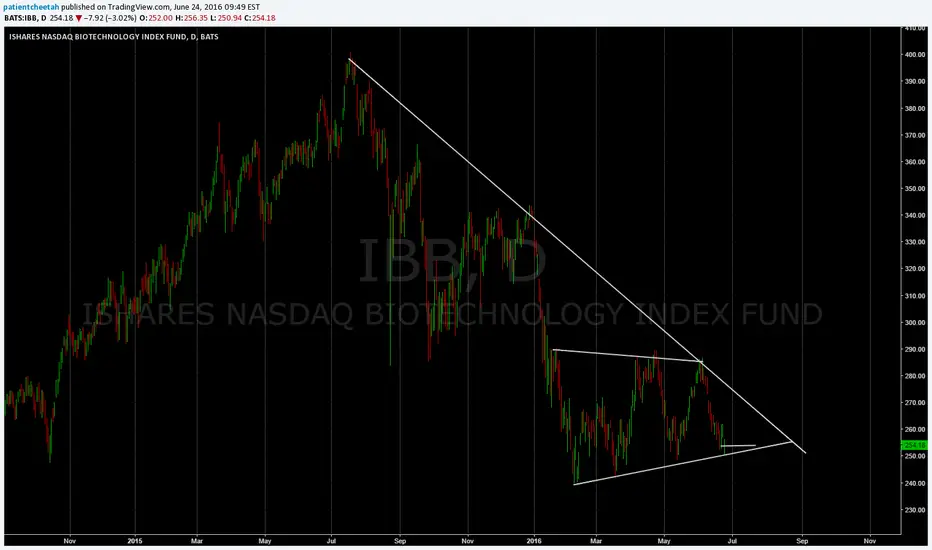
IBB Bright future for biotech industry?Bio tech industries are supposed to have a bright future. Technical analysis also supports this view.
IBB is hitting almost 52-week low with very strong support in place since early 2010s.
Careful for structure and 0.2 Fib (0.3 short term) at 278-279.
GL


$IBB - Daily chartIBB completing ST (10) in accumulation pattern. Selling climax completed and weak hands shaken out. Lots of gaps open above. Watching Monday for clues, because if 249.77 holds, time to get long. If not, will look for long entry at 225.53.
Waiting for entry.. Lots of good bio names set up for short squeeze. Not long yet, but bullish