IBB trade ideas

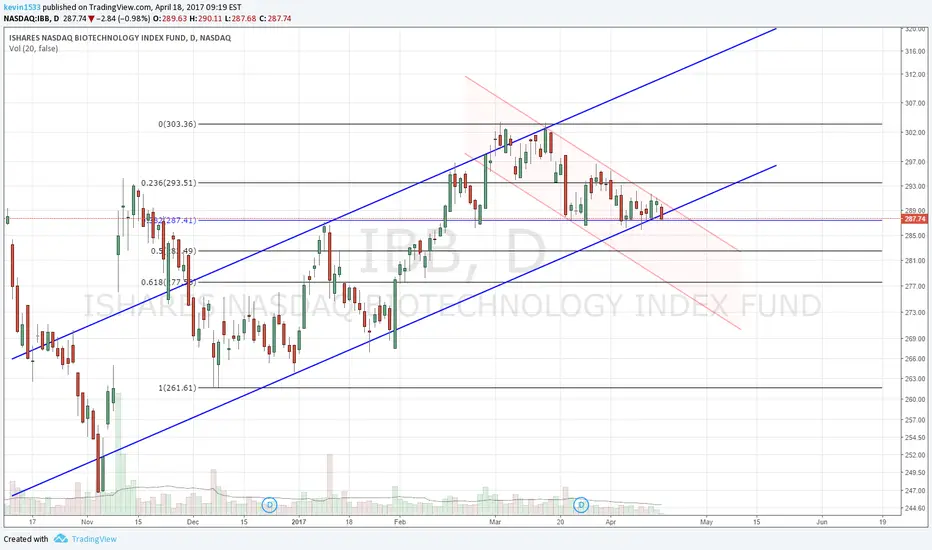
IBB "5-0 Pattern" formation. Bounce from 303 level very likelyNASDAQ:IBB reversing from 2.24 AB extension and should find some strong support at 50% retracement of 303. This is potential reversal zone upward for this pattern. It also marks the channel low. If it does not bounce from as per 5-0 pattern. Then it falls super fast to 0.886 retracement. of


First idea, with Elliott Wave on IBB long term. This is my first foray into Elliott Wave counting. Feedback and comments welcome.
The move up from 2016 is very choppy and so I believe the correction from 2015 top is ongoing. For the red Y (primary) to end in green 4 (lower degree cycle), Y must be at least 90% of red W. Hence we have a little more upside before we have a major leg down.


$IBB Remains in a Channel With Some Momentum to DownsideBiotech Sector ($IBB) Weekly: Biotech $IBB appears to continue to remain in a channel since beginning of 2016. One may even interpret this as an bearish pennant, but it’s too early too tell as it may get support from the 50 Week moving average and move out of the channel to the upside. RSI appears to support an upward trend in the longer term, but for now, it appears it will test the 50 Week – and failing to hold that, the bottom of the channel at around 260. MACD seems to be rolling over to the downside for now so advise caution buying on dips until a meaningful support can be confirmed at a later date.


Right Triangle Formation (Bearish)Right Triangle Bearish, Direction (Down) Prediction Range: 278.97 - 284.56 Prediction Period: 5/17/17 to 6/10/17


Biotech in a squeeze ready to moveLooking at IBB , XLV, and AMGN to the long side over the next few days. Consider the daily Squeeze ready, and the 4 hour already firing long. Also look at ADX on those same charts.

IBB - Confirmation of Bottom signal10.04.17
Both of my dBFIs (Bottom Fisher Indicators) gave multiple signals of a potential bottom.
Awaiting confirmation (close above sma14).
25.04.17
Confirmation of our recent signal

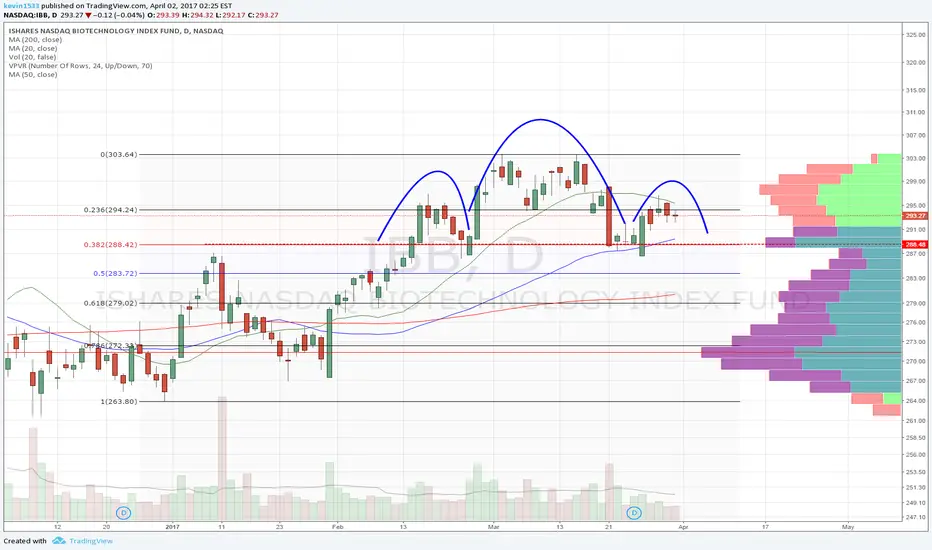
$IBB strategy for next week I think you can be long early next week on a retest of the 50d. I think too many expect the inverse head and shoulders to send it lower.
I am long via deep in the money LEAPS and recommend writing weekly calls against long at $295 (top of right shoulder). Below the 50d at $286 be careful..
I think there is long term support at $280 and would be adding to position if it got that low

IBB shedding IBB (and possibly one of its components) heading downhill, and forming a nice H&S pattern. There's been a confirmed pennant formed in the hourly (1, 2, & 4) TFs.

time and mode application it si a try to see the résult in juneYou know thw time mode technique of Sir Tim West ? i try this and make a publication with it to validate my understand of it. It seem a good way to invest and minimise your risque .

$IBB bearish flag, lower continuation.Completed .618 flag retracement. Will move lower now.
It has a nice double-top big bearish candle rejection if you zoom into the daily that confirms start of down move.
