IEF trade ideas

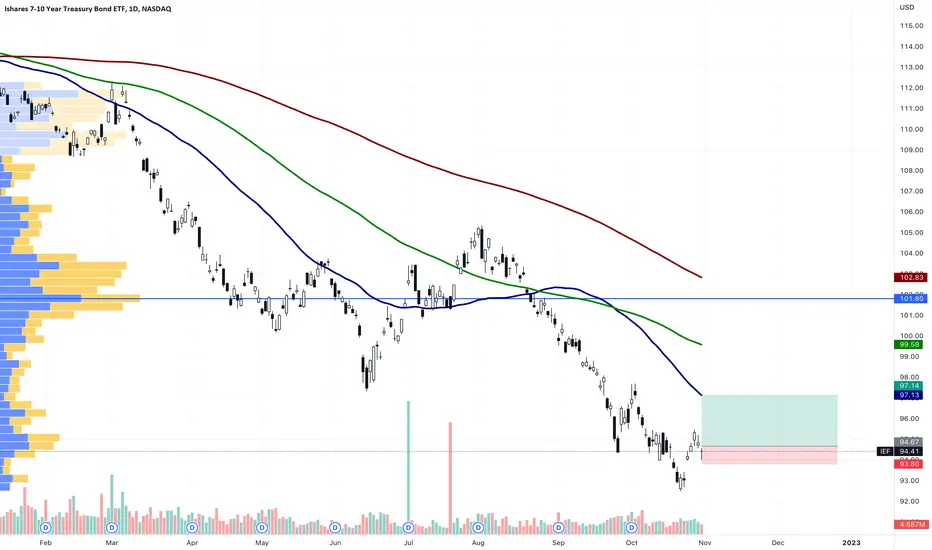
IEF - bullish
IEF is about to go in the strongest phase E (wyckoff) and giving the investors the last chance to by in the next days, for the next weeks or months to come.
S&P500 is still stronger but to see both strong is a starting signal for a worldwide bull market
good trading :)

Hmm... Something Interesting & Sweet is Brewing in T-Bond MarketIEF is a longer maturity, longer duration play on the US Intermediate Treasury segment. The fund focuses on Treasury notes expiring 7-10 years from now, which have significantly higher yield and interest rate sensitivity than the notes that make up our broader 1-10 year benchmark.
IEF`s average YTM is significantly higher than US-T Aggregated benchmark's. Of course, the higher yield comes with significantly higher sensitivity to changes in rates, particularly those at the longer end of the yield curve (10-year key rate duration).
The fund changed its index from the Barclays US Treasury Bond 7-10 Year Term Index to the ICE US Treasury 7-10 Year Bond Index on March 31, 2016. This change created no significant change in exposure.
IEF's narrow focus and concentrated portfolio have been popular, so the fund is stable and easy to trade.
The main technical graph represents IEF' Total return (div-adjusted) format, and indicates on developing H&S structure, as US Federal Reserve tight monetary policy seems is near to ease.


IEF: Holding on to an Established Trendline at the 0.382 RetraceThe IEF (US 7-10 year Treasury ETF), has held on to the 0.382 Fibonacci Retrace aligning with a Long-term and Established Trend line and the 200-Month Simple Moving Average with high amounts of MACD Bullish Divergence and a move above the 0 line on the Oscillators. All of these factors point towards lower yields in the 7-10 Year Treasuries and an increase in par value on the bonds themselves. Bullish setups can also be found in other duration ETFs such as the TLT and SHY representing the 20 Year and the 1-3 Year Bonds.
I suspect that all this Bullishness on Bonds will come with the Uninverting of the Yield Curve, which may align in commodities blasting off much higher in the short term, but in the long term could result in the resetting of the Bullish Cycle in Equities and Commodities alike.

US OR EUROPEAN BONDS? SCENARIO ANALYSISGood morning everyone. Today, through a scenario analysis and the creation of a bond sentiment index, we will try to determine which between US or European bonds represent the best choice.
1. TECHNICAL ANALYSIS OF IBGM AND IEF
The ETFs at the center of our analysis are the iShares € Govt Bond 7-10 yr (IBGM) and the iShares 7-10 Year Treasury Bond (IEF). The IBGM, as illustrated in the following chart, reflects the price movement of government bonds from the five main European countries by GDP (Germany, France, Italy, Spain, and the Netherlands) with maturities between 7 and 10 years and a duration of 7.79 years.
Ishares € Govt Bond 7-10yr. Weekly chart
Holdings. Source: iShares.com
The IEF, presented in the following figure, replicates the price changes of US treasury bonds with maturities between 7 and 10 years and a duration of 7.32 years.
Ishares 7-10 Year Treasury Bond. Weekly chart
Let’s start the technical analysis of the two ETFs, starting with IBGM. Since May 11, 2023, the ETF has not recorded significant price changes. However, it is interesting to observe the formation of two contrasting technical figures: a descending triangle followed by an ascending triangle, both with breakout. The ETF has shown an uptrend since the beginning of the fourth quarter.
Technical analysis IBGM. Daily Chart
As for the IEF, the situation is different. This ETF has shown a more bearish trend compared to the IBGM: from May 4, 2023, to the minimum of October 19, at $88.86, it recorded a negative performance of -11.84%. In the last sessions, the price has made a bullish impulse, catalyzed by Powell’s statements (interpreted positively by the market) and a weakening of the US labor market (unemployment rate rose to 3.9% from the previous 3.8% and non-agricultural payrolls at 150K compared to the previous 297K).
Technical analysis IEF. Daily Chart
To determine which of the two ETFs is stronger, it is necessary to create a strength index between the two and observe the trend. We obtain the index by dividing the price of the IEF by that of the IBGM, as shown in the following chart. The trend of the IBGM/IEF index is strongly bullish since the end of April 2023, indicating greater strength of the IBGM (dividend) compared to the IEF (divisor).
The IBGM/IEF strenght index. Daily chart
This means that the European government bond market has been stronger than the US one since April 2023. But why?
2. MONETARY POLICY AND INTEREST RATES
The outperformance of European bonds compared to US ones is linked to the monetary policy expectations of the ECB and the FED. Starting from July, the market began to price a more restrictive FED compared to the ECB, as shown by the two following charts. It is known that the 2-year maturities of the yield curve are the ones most influenced by monetary policy expectations. As can be seen in the following chart, the 2-year yield of the US government bond shows an upward trend (despite the bearish breakout of the dynamic trendline after Powell’s statements), while the 2-year yield of the German bond is falling.
Differences in monetary policy expectations. Daily chart
This suggests that the more the US 2-year yield outperforms the German one at the same maturity, the more the market prices a more restrictive monetary policy in the US. In the following chart, we build a spread between the two yields (with US02Y as minuend and DE02Y as subtrahend) to highlight the differences between the monetary policy expectations of the two central banks. By correlating this spread with the previously created IBGM/IEF index, we can confirm what has been said: the IBGM appears stronger than the IEF because it is expected that European monetary policy will be more expansive compared to the US one.
The positive correlation between IBGM/IEF and US02Y-DE02Y. Daily chart
"The US02Y-DE02Y index proves to be an excellent sentiment indicator to monitor in the near future, given its function as a ‘leading indicator’ on monetary policy expectations. But what does the future hold for us?3
3. US AND EUROPEAN BONDS IN THE NEAR FUTURE
Which bonds should we focus on in the near future? Would it be better to focus on US or European government bonds? Let’s start from a premise: the price of bonds tends to increase when interest rates are cut. So, the key questions to ask are:
‘Which of the two central banks will cut interest rates first? Which of the two has more incentives to keep rates higher for a longer period?’
The answer is simple: it will depend on the current and future macroeconomic conditions of the two countries. Considering the current data, the United States has shown a quarterly GDP growth higher than that of Europe for the first, second and third quarter of the current year, as illustrated in the following chart:
United States and European gross domestic product. 3-Month chart
The American economy seems to show greater resilience. This is also highlighted in the following chart, which calculates the strength index between the manufacturing and service PMIs of the two countries. The two US PMIs have outperformed the European ones since the beginning of the year, indicating greater resilience of the sectors.
The manufacturing and service sectors in the United States are more resilient than those in Europe. Monthly chart
In the following figure, we consider retail sales data, which are an excellent indicator of the level of consumer spending in both the United States and Europe (considering also that consumption represents a significant part of the gross domestic product.
Retail sales data. Source: Trading Economics
The situation is positive for the United States, but much less promising for Europe. In the latter case, one could even argue that the data indicates a sort of “recession,” with two consecutive negative readings, and the last one, with a -1.2%, decidedly more negative than the previous one. We conclude with the analysis of industrial production data, as illustrated in the graph below. In the United States, we have noticed a trend of progressively lower readings compared to the previous year, with a single contraction recorded in June. Instead, as far as Europe is concerned, we have witnessed a drastic drop, with readings in contraction from March until the last available data.
Industrial production data. Source: Trading Economics
From the graphs in this paragraph, it is clear that Europe seems to be closer to a recession than the United States. As a result, at the moment, the FED has more incentives to keep rates higher for a longer period, while the ECB could be the first to cut interest rates (in fact, we must not forget that phase 1 of the economic cycle is characterized by expansive monetary policies). If this scenario were to occur, we could see an increase in purchases of European government bonds (particularly German ones, considered safe havens given Germany’s high AAA rating), greater than those of the United States. But will this be the case next year? It’s hard to predict. The macroeconomic picture is and will always be influenced by the trend of macroeconomic data. In this regard, I recommend keeping an eye on leading data, capable of anticipating future economic trends, including certainly the PMIs, without forgetting US02Y-DE02Y. To date, however, it seems that European bonds may have a higher competitive advantage. See you soon!

W.D. Gann IEF low . 75 % W.D Gann came right into the Gann date 10 yr cycle low . I will now look for a very choppy rally back up into 98.2 to 99.7 in the etf

IEF trade plan based on AMEX option traders' activityIMPORTANT! Based on our team's research of the options market, we expect buy activity at the support level or sell activity at the resistance.
We primarily consider levels to be activity zones, but not to be a super-fine level for establishing a limit order. Use them in combination with our own strategy, not in alone.

Short $IEF at $101?I think a lot of people are thinking that yields will head lower from here, just like they have previously, but I think that bonds will follow the trend that they did last year (which is down), rather than move higher going forward.
If you look at the chart, we're in a bearish trend. We're currently below the key support of $101.58. What looks most likely to me is that we move up to retest that support as resistance, and if we can't break above it, then the most likely path is further down.
If you look at the chart we have a long way lower to go. I think we're in a new trading environment. We have ended the 40 year trend of the long bond and now we're going to reverse the other direction for a sustained trend.

Treasuries (IEF) vs Sub-Investment Grade (JNK) Treasuries (IEF) relative to Sub-Investment Grade (JNK) | Weekly Chart | Similar to Jan-March 2020, a larger spike in the ratio could suggest higher levels of stress. Note the +2% move so far this week.
For more research insights, including trade ideas, get in touch today.

IEF/LQD -Daily, Inverted (Financial Conditions) 01/23/2023This chart shows IEF/LQD ratio (Inverted) With the SPY overlayed so you can compare how when financial conditions ease (as they are) then the SPY will react as it is, positively.

IEF ShortTo begin, I am not a Seasoned Trader; I use this blog for:
1. Record keeping; &
2. Formalizing my thoughts
a. If I can't explain simply here, I shldn't engage
To begin, my Rules of Engagement ( RoE ) to identify an upside of +3 to 1 Risk to Reward ( “R/R” ); in this case it may yield a 3.1- 3.94 R/R.
• Asset | IEF ( iShares 7-20 Year US Gov’t Bond )
• Type | Equity
o Alt. Type 1 | Option
• Position | Short
• Entry | $ 100.46
• Stop Loss ( SL ) | $ 102.05
• Bring SL to Zero | n/a
• Target | $ 94.19(-)
• Exp. Time Horizon | ~ x2 FED meetings so Mar-end
• Allocation | 5.00%
• R/R | 3.1- 3.94(+)
To begin, I will highlight the reasons why I am apprehensive about the trade ( the Con’s ) & finish up with the reasons why I’m interested in the position ( the Pro’s ). The issues / thoughts that make me uneasy ( the Con’s ) are:
• I structured it to allow for further moderate appreciation
o I “may” miss hitting the top but I have 1.5 wk’s for that too play out
Now, the reasons I am interested in this position ( the Pro’s ):
• In my blog, you can see the appendix whereby the 10Y can hover lower than the Fed Funds Rate (Upper) by 100 bps before it turns; we are there now
• The FED is either going to raise (25 – 50 bps) or stay fixed in 1.5 wk’s
o I believe they will raise; thus pushing the market down
• Although the date range for the 10Yr Yield goes further, I am playing with the IEF (ETF) so only goes back to July 2002. Nevertheless, that posts a 1.95 standard deviated move which I’ll see as ~2 if it hits my entry & thus happy with that
To summarize, the Tea Leaves & history is telling me to short albeit I may miss it.
Financial Disclaimer | To reiterate, I’m not a Financial Advisor. If you engage based on the contents herein, you will lose money. If you interpret that mean by doing the opposite you will make money, that’s incorrect; you will also lose money.
Thanks for your time; I hope you have a lovely day.
IEF/LQD Ratio (Financial Conditions) Daily - EasingThis chart is an inverted chart of the IEF/LQD ratio with a SPX (SP500) overlay line chart Not Inverted . This shows the corrrelation to easing conditions and the S&P500. This is what the FOMC is failing at fighting. With QT and rate hikes, this has only had pullbacks. Jawboning too.

IEF daily hammer wave 3 of wave 1 uptrendOrder BUY IEF NASDAQ.NMS Stop 94.67 LMT 94.67 will be automatically canceled at 20230401 01:00:00 EST
IEF daily hammer wave 3 of wave 1 uptrend ABC correction is complete at the bottom of mean reversal channel
7-10 Year Bonds May be Ready To Go Up due to the FOMC ActionsI will be buying bullish exposure to 7 and 10 year treasuries as a result of topping out inflation and the fed's aggressive actions to kerep it down.

Credit SpreadsA slide from today's research report, published to clients yesterday evening:
Credit Spreads: US Treasuries (IEF ETF) vs Sub-Investment Grade Debt (JNK ETF): Credit spreads have remained subdued however traders should be monitoring the 1.08-1.09 level (pivot zone) for evidence of increased stress which may ultimately be reflected via further moves lower in the equity market.
For more research insights, get in touch today.

IEF/LQD (INVERTED) With SP500 overlain in a line chartAs you can see the inverted IEF/LQD is a great correlation to the SPX (SP500 market). Makes sense as the fed is failing to tighten financial conditions, actually LOOSENING them somehow. This not only sent equities racing up but also helped set up the conditions to invert the 10-2. The 10-3mo is close behind. Those are sending recession signals even if equities are diverging.

CREDIT SPREADS: IEF vs JNKCREDIT SPREADS: IEF vs JNK - In my view, one of the most important charts when considering your risk appetite for equities. Notes on chart.

IEF Long IdeaIEF (7-10 Year Treasury Bond ETF ) is hitting a monthly uptrend line which is very likely to cause a short term bounce. On almost all time frames, IEF looks oversold. We are long EIF. - HH

IEF Healthy DumpIEF on this ascending scallop has undergone many dumps along the scallops history
This is just another one
Added a falling wedge pattern for a little flare

IEF - Long bonds/yields - How the yield curve invertsThis is an elliot wave count of IEF which is the long dated bonds and shows a roadmap for how the long bonds yield will drop below the short term bonds causing a yield curve inversion, signalling a recession (which is already well anticipated by now to those paying attention).
When bonds rally in wave 2 it will be violent and fast and will send yields down below the short term yields. i believe we have one more final 5th wave of sub degree before that rally begins and it could be that the decline is in sync with the stock market decline. Once the sentiment finally turns bearish and all of those dip buyers who are overexposed at the most overvalued time in history, then the capital will search for safety and a rotation to long bonds makes sense fundamentally which would explain this wave 2 rally.
After wave 2 completes we will see the evidence of the long term 35+ year interest rate cycle that has been down but is transitioning upwards. When wave 3 down on this chart is underway we will see a consistent increase in rates for many, many years. Wave 2 is where you lock in a 30 year fixed mortgage.
The next phase of the bear market in stocks and cypto will take many by surprise, be cautious.

US Treasuries (IEF ETF) vs Sub-Investment Grade Debt (JNK ETF)US Treasuries (IEF ETF) vs Sub-Investment Grade Debt (JNK ETF): Credit spreads have remained subdued however traders should be monitoring the 1.08-1.09 level (pivot zone) for evidence of increased stress which may ultimately be reflected in the equity market.

A bit of positive divergence in the Bond market.It would be quite a surprise if the next big move in Bonds was PRICE higher, not RATES higher.
