$IWM Trading Range for 7.15.25 and everything in it for CPI Tomorrow’s Trading range for CPI inflation data and everything in it. How are you playing it?
IWM trade ideas
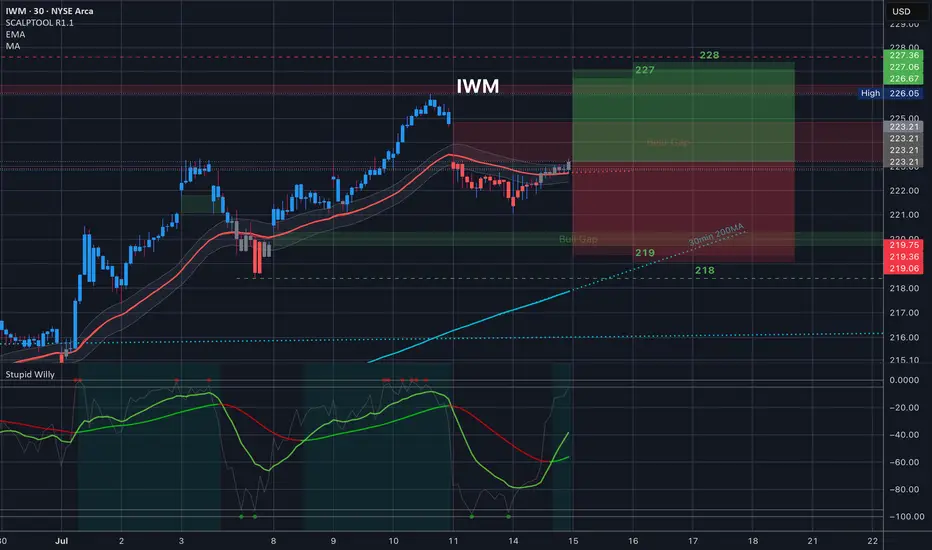
$IWM Tomorrow’s Trading Range and everything in it /// 7.14.25Tomorrow’s Trading range and everything in it. How are you playing it?
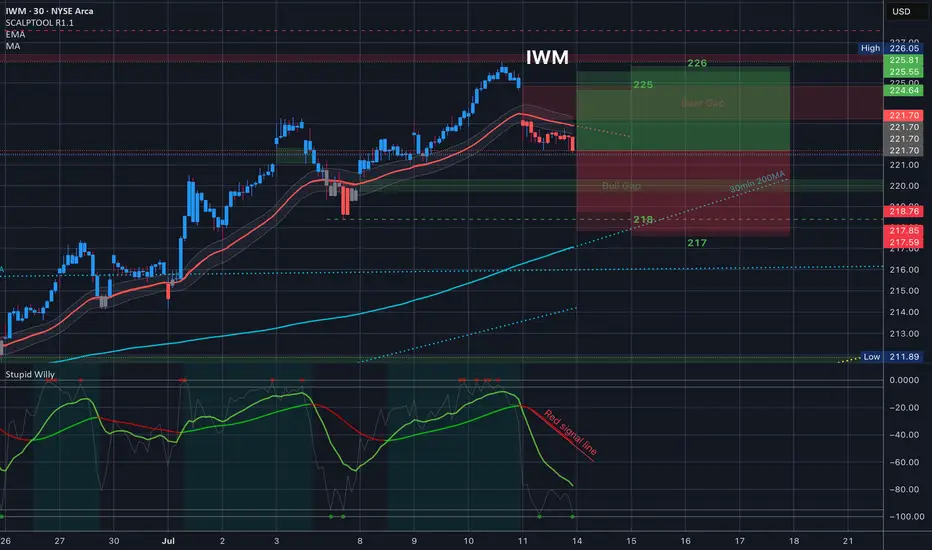
$IWM Tomorrow’s Trading Range and everything in it /// 7.10.25
Today’s Trading range and everything in it. How are you playing it?
Really the only thing in the trading range is a bear gap and 35EMA. Easy Trading Range

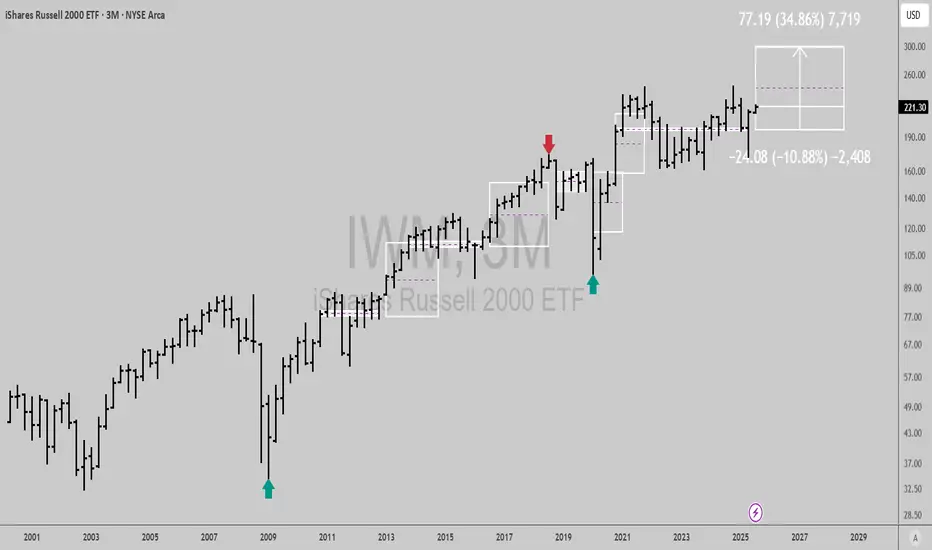
$IWM: Quarterly signal and Fundamental CatalystsQuarterly chart signals from time@mode show AMEX:IWM is bullish, with just 10% downside risk and over 34% upside potential into Q3 2028 or sooner.
Let's break down the key catalysts for the year ahead:
Fed rate cuts are expected to boost small cap stocks by lowering borrowing costs.
Small business sentiment is at multi year highs, supporting Russell 2000 earnings growth.
Valuations remain attractive: AMEX:IWM trades at a discount to large caps, with room for mean reversion.
Sector rotation: Money is flowing into industrials, financials, and cyclicals, core IWM sectors.
Risk reward is compelling: Upside vs risk and strong macro and earnings tailwinds make this a high conviction long idea for the next 12 months and beyond.
Best of luck!
Cheers,
Ivan Labrie.
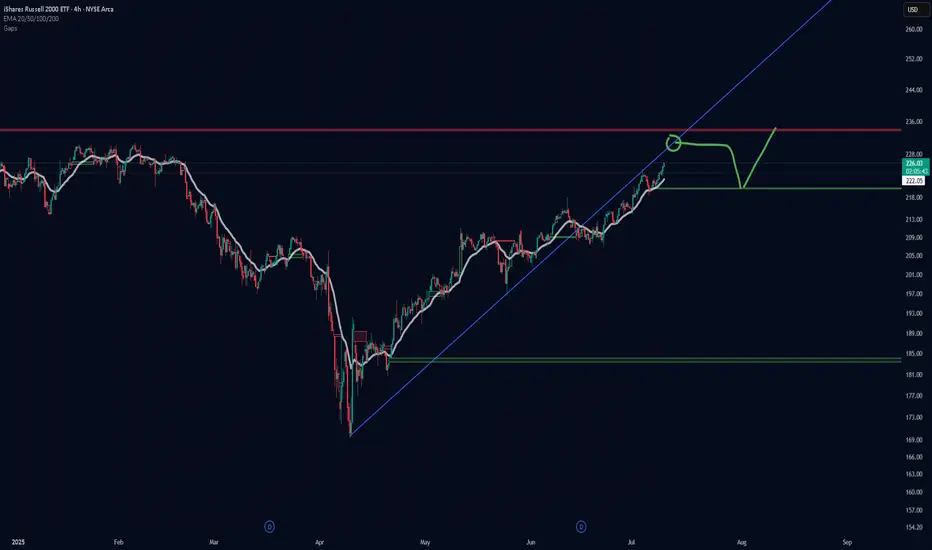
IWM projected pathI have three rooms full of supercomputers and then a few laptops in a spare bathroom plus a refrigerator in my wife's cardboard box running simulations 24/7 about the projected path of the Russell. Based on their findings I have determined that our previous support is now the resistance. When we come into contact with this resistance we will begin to work our way back down to fill the gap before continuing up to achieve a new all time high. When we hit resistance I have prophesized that will go mostly sideways for a numbers of days before we drop down to fill the gap. Thank you. Praise the Lord.
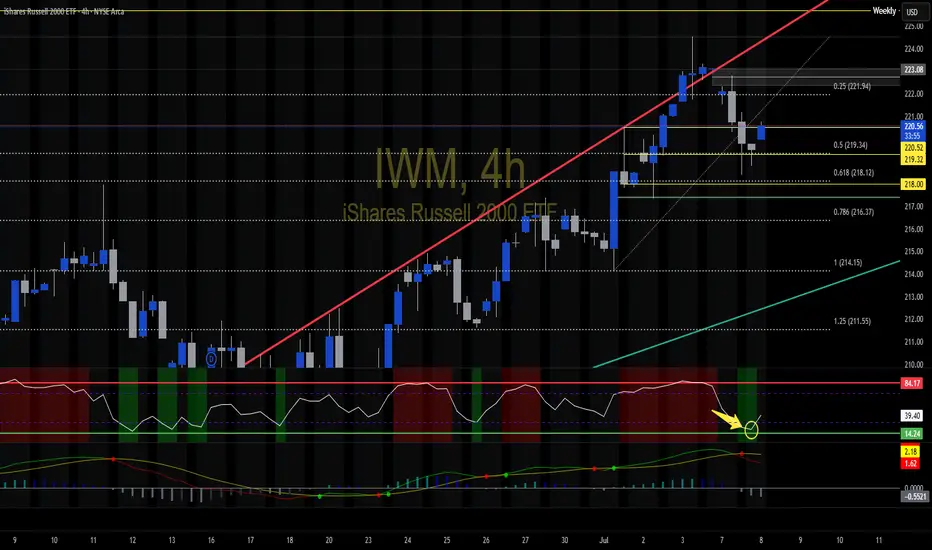
IWM 4hr chart cannot tell a FIBIWM bouncing out of the FIB golden pocket.... With the daily and this I like the odds of upside continuation..
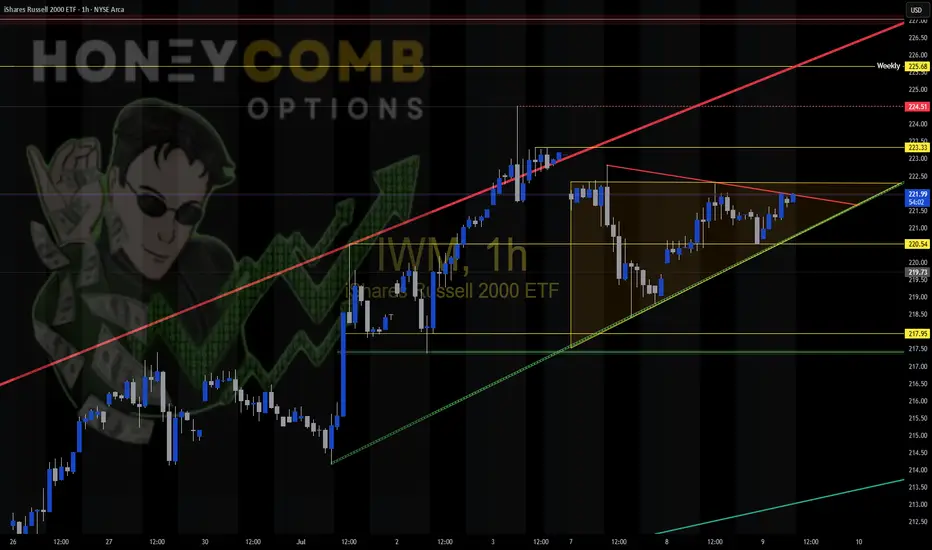
$IWM 4 hour cup and handleLooks like a cup and handle pattern formed with a retest of the neck line.
A break above $215.53 would confirm bullish momentum back in. A break and hold below the neckline would invalidate the pattern.
Happy hunting!


$IWM is set for a Blow-Off Top - 34% UpsdieAMEX:IWM is about to have a blow-off top moment!
Catch up mode engaged...
- Breakout of downward trend
- Volume shelf launch
- Rate cuts inbound
- Suppressed for 4 years
PTs: $244/ 259/ 276 (MM)

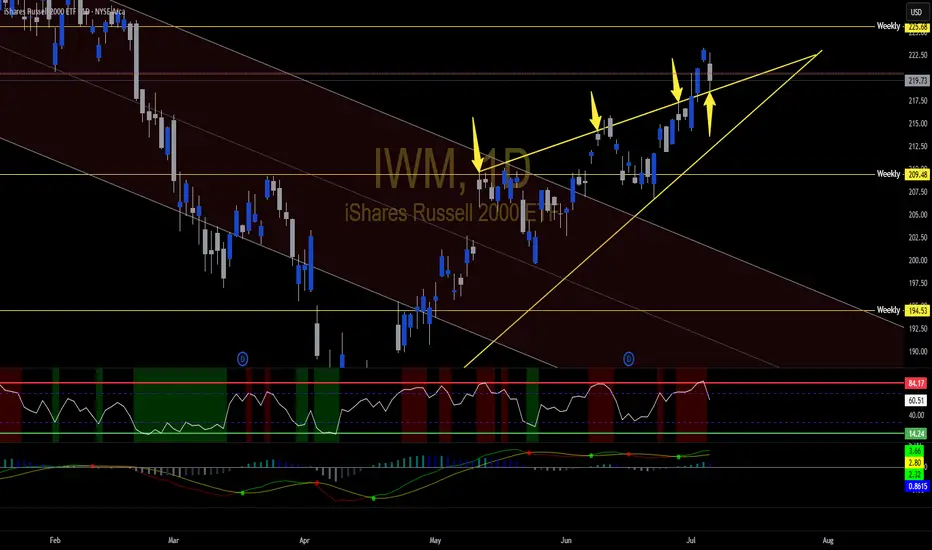
IWM Showing rising wedge with DivergencePay attention to the outside trendlines. Holding 214.40ish area is really bullish

Preponderance of (or Preposterous?) Evidence
I was just proposing yesterday staying neutral in SPY (the S&P 500 ETF). The FOMC meeting today (Jun 18th) was a big-nothing burger (so far), which supports my (non)position, but we'll see. I will update that post when the time is right (ATH, 200dma, or bust).
Today, though, the IWM (the Russell 2000 Small Cap Index ETF) and, surprisingly, a potential short position.
First, the IWM (see below) is overbought on a weekly chart, with the Stochastics being above 80 (more on Stochastics and weekly charts at a later date). For now, let's go with IWM being a little overbought, in the longer-term view.
Now, let's switch to the big daily chart at the top and look at the evidence for going short;
- IWM never really got above it's 200-day moving average (purple line),
- That same level was consistent with a lot of resistance ~213 (yellow circles),
- IWM has trailed this whole rally.
- It has broken and somewhat retested a trendline (light blue) from this most recent rally,
- It bounced off it's 61.8% Fibonacci level (orange line, not my favorite indicator for ETFs, but I often sneak a peek),
- It's at its previous resistance high around 209 (blue circles).
On the not-bearish side;
- The daily chart is less overbought (this has to happen on weakness, though),
- There's (a little) support at 199 but not really again until 172,
- I still feel like the All-Time-High (ATH) is a magnet for the S&P (but IWM has trailed).
That's (a lot) more (and better) points for being bearish.
I'll go short (via a ~90 day ITM put position*) if IWM breaks below 207.50, between that and 202. If it opens lower than 202, I'll wait for a pull-up.
The stop will be a close above the 200 day.
The target is 172 (the previous tariff low), but I will lighten/tighten up (by selling OTM puts* and/or moving stop down) as IWM drops (if it drops).
It may seem a bit duplicitous to be neutral on SPY while being bearish on IWM.
But sometimes you have to go with the Preponderance of Evidence (or will it prove Preposterous Evidence?)
An update will be coming.
*Sorry for bringing up options. One can just go short IWM. I will explain my option choice one day.
My ideas here on TradingView are for educational purposes only. It is NOT trading advice. I often lose money and you would be a fool to follow me blindly.

Market Update - 6/29/2025- Strong close on Friday especially in consumer related names
- Most excited about retail/consumer/DTC names, especialy NASDAQ:ODD , NASDAQ:NAGE , $YSG.
- AI names are back on the radar, and quantum computing has been for a while -> speculation money is back
- Breadth and market in general looks very constructive, so we will likely continue going higher
- Been very protective with my account, keeping losses below 0.1% as the market has been choppy since May 12
- However, if we start another leg higher, I'll go much more aggressive, maybe 0.5-1% of my account in strong names

$IWM Look at that moveThe bottom of the implied move today was 212, and look where we closed? 211.97. That was beautiful.

The Ghost of 1986-1987 Stock Market Overlay onto $IWMThe 1986-1987 stock market advance was 48% as measured by the S&P500 Index SP:SPX from the low in late 1986 which peaked in August 1987 and crashed into October 19th's spectacular 20% decline in one day.
The advance in the Russell 2000 Index from the low in 2023 to the high in 2024 was 51%, topping the 48% gain in the SP:SPX and the meltdown wasn't as spectacular, but it was similar.
There were similar patterns in fears of trade wars, US dollar declines, new tax laws going into effect back then and tax laws sunsetting this time. Those you can go into by reviewing my other charts I have published over the years here.
I stretched the 1987 pattern to fit the low to the high, so it isn't "exactly" the same time day-to-day for this pattern.
I found it interesting because the chart of AMEX:IWM all by itself had the same "look" to me as the 1987 bull market and crash so I decided to put it together for you all here to see.
I would expect a choppy market from here on as people adjust to the new uncertainties. Sellers of this decline will be shy to reinvest anytime soon and buyers are likely afraid to step up and get aggressive with so much uncertainty.
Sentiment as measured by AAII shows an extremely fearful and reluctant investor class, which is typical to see at major market bottoms.
Wishing everyone peace and prosperity!
Tim West
11:17AM EST April 24, 2025

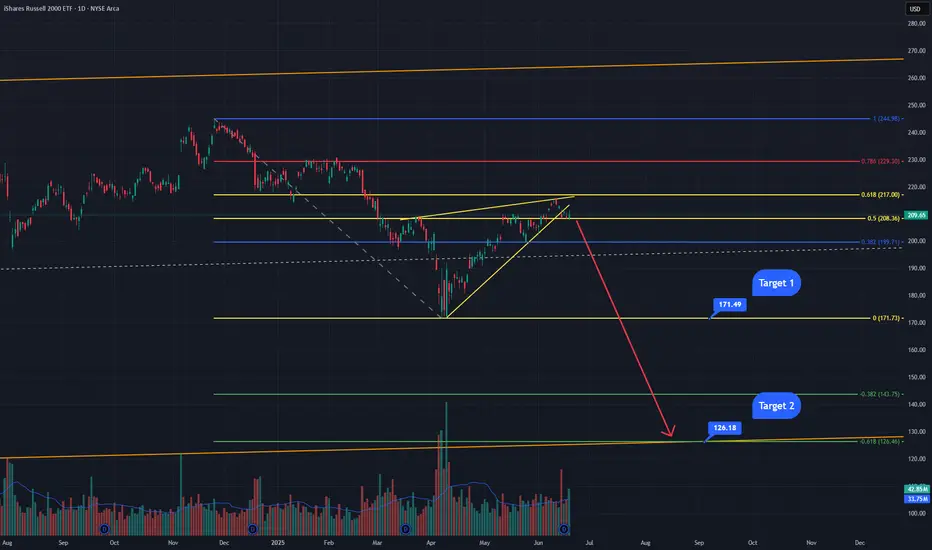
Small Caps about to get SlammedThe IWM has been trading inside this upward sloping wedge/bear flag for a few months. It just broke the bear flag this week and then tested the underside of it as resistance before getting rejected. This area also happens to be a golden pocket retracement zone from a Fibonacci I have drawn from the all-time highs made in November of last year to the lows made 2 months ago in April. The next probable move is back down to target 1 at the bottom of the Fibonacci retracement at $171. These golden pocket retracements have a very high probability of moving back down to the bottom of the retracement, sometimes breaking lower. This area at $171 has a lot of support but if it breaks, I expect it to come down to the orange line which is an upward sloping paralell channel that the IWM has been trading in since the financial crisis of 2008. The bottom of said channel connects the 2009 lows through the covid lows of 2020. This area also happens to be the -0.618 Fibonacci retracement area, it would be the 3rd hit of the bottom this major weekly channel and would very likely contain the lows for the current bear market.
IwmInteresting spot here ...
Bulls see Inverted H&S
Bears see , rising wedge
I see an inflection point.
We are sitting at the bottom of a wedge.. depending on what happens the next 2 days
We either test 204 or 217
Below 208.00 and iwm goes straight to 204.00
Above 212.00 and 217 comes ...
209 is daily 200ema
216 is daily 200sma and weekly 50ma
So 209-216 is chop....

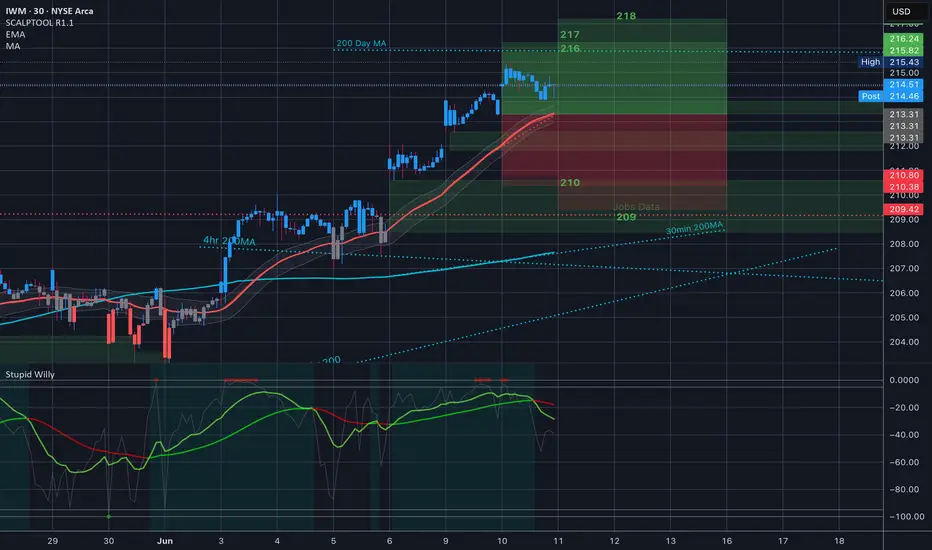
$IWM // June 17 2025 // CPI Analysis & Targets for Day TradersAMEX:IWM // June 17 2025 // CPI Analysis & Targets for Day Traders

IWM TOMORROWI think we continue to see the 20ema on the 1hr as resistance. I think we might get a slight pump on michigan report or maybe the michigan report will be the reason it drops. either way i think we hit the bottom of the channel at some point friday and for there to be some strong ups and downs after we do.

IWM: The Rotation Rocket? Waiting at the ShoulderIWM: The Rotation Rocket? Waiting at the Shoulder
The market is flirting with new highs—and you know how this game goes. If the S&P breaks out clean, expect the "rotation to small caps" narrative to come flying in right on cue. Rinse and repeat. We've seen this before.
📈 Chartwise, IWM is either:
Breaking out from a complex inverse head and shoulders, or...
We’re seeing the formation of a final right shoulder just above $198–$200.
That red zone is key. A retest of the shoulder trendline near $200 could offer a sweet spot for re-entry.
My Position:
Started with 10 June 30 $220 calls back in the April flush
Sold 8 contracts to lock in profit and now holding 2 runners free and clear
Watching price action near the neckline/shoulder zone—may reload if we dip with volume drying up.
Macro Context:
The tape has been dull.
VIX is dropping.
Summer float season is coming.
The Fed and Wall Street crew might just levitate this market while the banksters summer in Europe on their yachts.
Trade Setup Logic:
Breakout = rocket fuel. IWM has lagged hard—it may finally play catch-up.
Pullback to $200 = re-entry zone.
Over $220 = squeeze territory. Targeting a move to $233 (top of the range from late 2023).

$IWM // June 10 2025 // Analysis & Targets for Day Traders
IWM gapped up for the third trading session in a row. That 200Day Moving average is clearly the target.
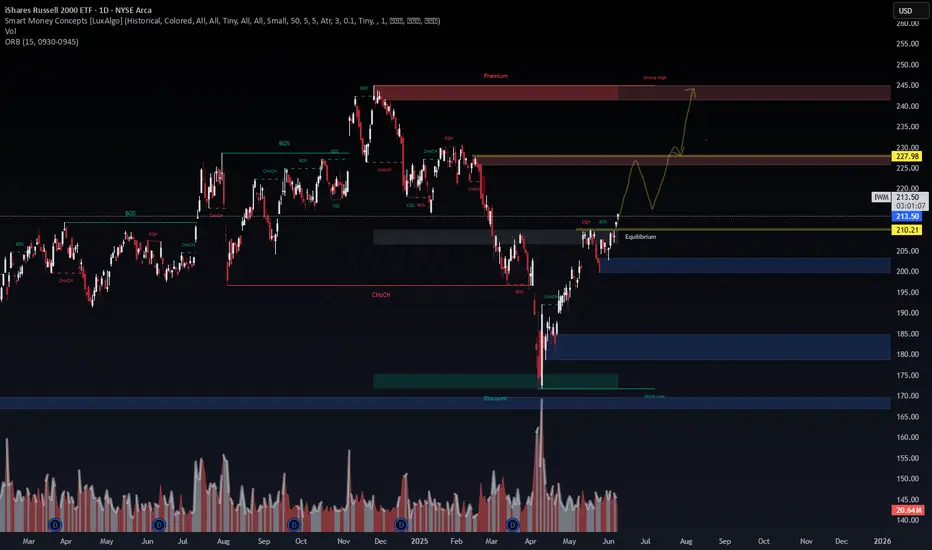
IWM Technical Outlook: Small Caps Poised for Ascent?📅 1D Chart | SMC | BOS/CHoCH | FVG Zones | ORB (0930–0945)
Price: $213.50 | Volume: 20.64M
The Russell 2000 ETF (IWM) is pushing into the equilibrium zone after a clean Break of Structure (BOS) from the mid-May lows. This rally signals regained bullish intent, but macro and liquidity overhead remain the key challenges.
🔍 Technical Breakdown:
🟩 Current Zone: Sitting at $213.50 near equilibrium
🟨 First Supply Zone (Reaction Expected): ~$227.98–$230
🟥 Strong High/Final Target Zone: $243–$250 (Premium)
Key Confluence:
CHoCH into BOS confirms structure shift
Volume decreasing slightly—awaiting re-accumulation before next leg
🧠 Probabilistic Positioning:
📈 Bullish Continuation (65%):
Pullback toward $210–213 zone (equilibrium) before reclaiming higher resistance. Strong move likely if macro sentiment aligns (Fed pause, rate-cut optimism).
📉 Bearish Rejection (35%):
Failure to hold $210 leads to re-tests of:
$200 zone (OB/FVG)
Extended: $186–$175
🌐 Macro Context:
Small-caps are interest rate-sensitive. With markets pricing fewer hikes and potential cuts into late 2025, capital rotation into risk assets may continue.
GDP revision and ISM Services softness support risk-on flows. However, real yields remain sticky, capping aggressive upside.
🎯 Trade Setup:
Entry Zone: $210–213.50
Target 1: $227.98
Target 2: $243+
Invalidation: Close below $210 (re-enter lower OBs)
🔒 Risk-to-Reward: ~1:3 on breakout retest scenario
📌 Conclusion:
IWM is climbing the risk ladder with structure and volume backing it. Watch for reaction at the mid-supply zone ($228–230). A clean break above could validate a move toward the premium zone.
#IWM #Russell2000 #SmartMoneyConcepts #TechnicalAnalysis #VolumeProfile #FVG #MarketStructure #TradingView #MacroOutlook #BOS #SMC #Equilibrium #RiskReward