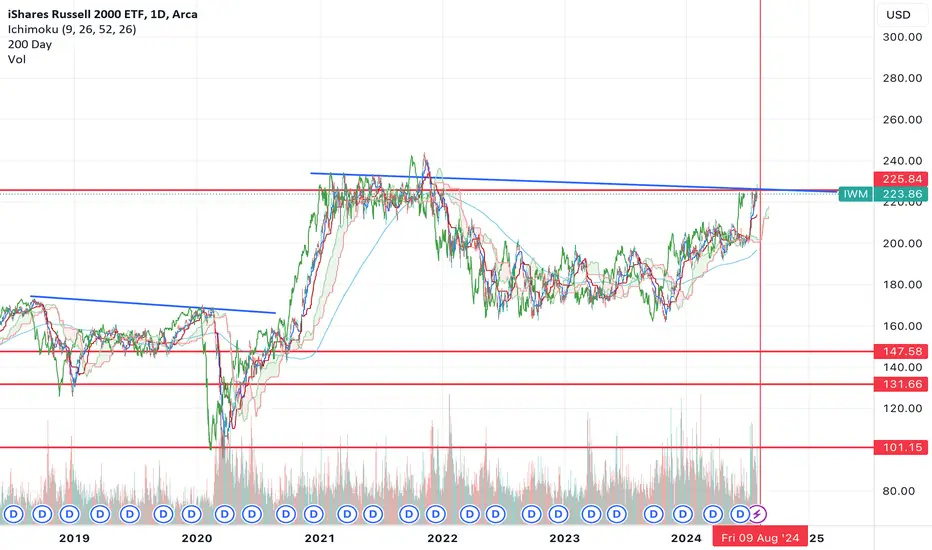
More Downside for IWM or Is This a Rescue Operation?Let's kick off Tuesday morning by breaking down IWM:
First and foremost, on a daily chart, it appears to be in a freefall and this slight recovery is just a bounce along the ride down, complimented by the rising wedge pattern on a 1H chart.
I'd like to sit back and say, "well the markets recovering, so IWM should too". However, experience has taught me to trust the chart and not my heart. Keep in mind, the bottom also appears to be near so be cautious.
Other thoughts. We did see this ETF take a rip roar towards the upside about 3-4 weeks ago while the rest of the market trailed, so that's no real indication of what could happen in the upcoming days.
Conclusion: I'd be looking to day trade this, leaning towards a short-term slide towards the gutter in the region of 197. The sticky note region at the top, around 206.75 - 211.12 would indicate overhead resistance and a good place to lay groundwork.
Anyway, I'll be paper trading this out of curiosity. Market is volatile this week.
Trade accordingly.
IWM trade ideas

$IWM Trading Range for Tuesday August 6thAMEX:IWM Trading Range for Tuesday August 6th
3.01% expected move for tomorrow. ooooh eeee...

IWM Time To Go Long Until The End Of YearIts Here get into small caps before they actually explode to the upside you all have been notified to get in early I've been in since $212ish

Crypto and Alts: time to be bullish . . IWM vs SPX will confirm?more confirmation of liquidity cycles repeating.. chart of IWM vs SPX ...
U can see that a trendline usually starts right when BTC is leaving its lows
And breaks during halving year with a RETEST before taking off
ALL OF THIS HAS JUST HAPPENED.
This comes at the same time with several bullish catalyst
- increased liquidity from US FED
- slow down in large cap stocks after giant rally
- upcoming Fed Cuts
the cuts themselves aren't bullish but as people expect this to happen they may front run and begin to position early (aka over the next 6 months)
this creates a risk on environment
This trend has happened in all the prior halving years and BTC especially Altcoins has positive movement into the end of the year.
worth also noting that there is a serious risk off period after this brief bullish .. will keep an eye out if we see euphoria type action into the end of the year.

IWM vs SPX: Bullish Breakout= Risk On..BTC & Crypto Rally Q3+Q4?more confirmation of liquidity cycles repeating.. chart of IWM vs SPX ...
U can see that a trendline usually starts right when BTC is leaving its lows
And breaks during halving year with a RETEST before taking off
ALL OF THIS HAS JUST HAPPENED.
This comes at the same time with several bullish catalyst
- increased liquidity from US FED
- slow down in large cap stocks after giant rally
- upcoming Fed Cuts
the cuts themselves aren't bullish but as people expect this to happen they may front run and begin to position early (aka over the next 6 months)
this creates a risk on environment
This trend has happened in all the prior halving years and BTC especially Altcoins has positive movement into the end of the year.
worth also noting that there is a serious risk off period after this brief bullish .. will keep an eye out if we see euphoria type action into the end of the year.

IWM Long 6/23/24Looking for a break through the wave D high of 209.77 and towards 227.13 against the wave C low of 191.34 in wave (C) of {B}.

$IWM - Delayed shooting start effect!AMEX:IWM Remember the July 21 post where I mentioned we might check back to the $210 area, and then a week later, I thought the shooting star was invalidated? Well, guess what? It even dropped below $210. It was just delayed by a week. 😂
$200 or below could be a good reload area.

Was that it for $IWM? Do we correct before the real run?While I do think that IWM is the place to be over QQQ , I think this run has gotten a little ahead of itself.
I noticed something interesting today on the chart, if you look at it on the 6hr or 4hr, you'll noticed we tried to break above resistance on the 9am candle, and rejected hard back below it.
This leads me to believe that the next move from here is actually down, not up.
If we zoom out, the chart looks extremely similar to how it did before the covid crash. We formed a high, went down and v bottomed up into what looked like a breakout (Feb 2020), but instead formed a double top and then rolled over hard.
Now we've pretty much made the same move, we formed a high in 2021, corrected, v bottomed in Oct 2023 and now we're at the exact level where a double top could take place from the high that was formed in Jan 2022 before price broke down.
So will we have another covid style crash that brings price back to $150 or lower? TBD, but I have that feeling...
$IWM Daily Trading Range for Friday August 2ndIWM took a beatdown yesterday and again today in premarket. It is just a little after 8:30 AM this morning, and IWM is down about 3.5%. It is now underneath the two gaps that we saw above the previous long-time resistance at 211. It will be interesting to see if that 211 level remains as resistance, or if we can get back above it and try again to fill those gaps from underneath.

IWM Breakout FailureI admit, AMEX:IWM was looking fantastic but the weight of the markets are much heavier right now and causing this one to decline. This a clear breakout failure and prices are likely to trade lower next.

$IMW setting new high this week.Get on board AMEX:IWM before the ship sails. AMEX:IWM is at resistance, trendline, and all the good-good. Get on board before the 230.00s are passed. Next week will be a doozy

Is the market crashing? The SPY and IWM have completely diverged.
On the back of rate cut expectations, many investors are piling back into the junk and high beta names.
A clear relative strength move has occurred in small caps: IWM
Whilst the megacap stocks have been sold off.
The SPY sliced through the 50 MA yesterday and cofirmed the break below.
Although this is typically bearish, we are getting into an area of oversold support.
If the SPY gaps down tomorrow, I think traders will be buying the dip with both hands.
The IWM has blasted above the 50MA, basically moving the exact opposite of the S&P500.
The question remains....are small caps going to hold their gains inside of the weekly topping tail?

IWM/SPX spread - Long smallcapsBeen watching for a reversal of the trend between the 2 indexes and a breakout of this bullish falling wedge for a while.
Fundamentally it made sense to look for this breakout result because of the looming interest rate cuts and frothy bond yields since the start of the year. Small caps are highly sensitive to such things.
Long IWM or TNA is the play on this breakout. But the best value will be found in heavily beaten down individual small caps.
If you want to hedge against a market correction long small caps short large would be the other play.

Russell 2000 I'm expecting russell 2000 to go up in the 190s and early 2024 after retesting in the 170s and going to 210s supported by lower rates.

IWM Pitchfan - Early - Low TimeframeI've been really happy with levels produced using the pitchfan tool. I typically place the left anchor on the local high and the bottom anchor near the local low, then adjust slightly until it looks correct. The best fans tend to 'drop' into the pattern, i.e. it enters the pitchfan drawing on a descent.
I will update or repost this chart as it plays out.

I shorted IWM @ 225.25Daily stock rolling over daily. candle rallied up shorts dropped it. Target 207-209

IWM - Penny to PennyLook how these algos pulled the IWM in a very specific range. the skew is saying the IWM will rise again.

iShares Russell 2000 ETF (IWM)IWM breaks out of short-term ascending triangle late last week into early this week. Now working its way towards completing a two-and-a-half-year cup pattern. The pivot is currently the left side apex of the developing cup. Should a handle develop at some time soon, the pivot will shift from that left side peak to the apex of the right side of the cup. A take and hold of pivot would put a conservative target at $276. I am long this ETF.

IWM Explosive!AMEX:IWM has to be one of the most explosive look stock ever! I'm talking about a small cap "index" being this parabolic to the upside. Seems like we are going to have quite the bull market in 2025 maybe.

Small 'n Furious. Early 2020's Signaling A Big Midcap Run AheadThe Russell 2000 trailed the S&P 500 significantly in 2023, gaining about 17% compared to a gain of about 24% for the large cap index. That underperformance has spilled over into 2024. Year-to-date, the Russell 2000 is about 2% compared to a 7% gain in the S&P 500.
By the way, that valuation measures make the small cap Russell 2000 index much more compelling when compared to the S&P 500.
Small caps relative to the S&P 500 on a price-to-book basis is back to where it was in 1999, which was the absolute low and was a launch point of 12 years of outperformance for small caps.
As of January 31, 2024 small caps price-to-book ratio is 2.01, as it described on FTSE Russell 2000 Index Factsheet.
Like a sensationally increased shares of Supermicro NASDAQ:SMCI or e.l.f. Beauty Inc NYSE:ELF , I believe many other small cap stocks can be the best ideas for 2024, in part because of that participation in the ongoing stock market rally is improving and is no longer concentrated in just ultra-mega-cap tech stocks, like it was in 2023.
If so-called breadth improves in the stock market, then small cap stocks will catch a bid.
There are three factors will help to boost small-cap stocks in 2024.
First, fund flows into the stock market are necessary for small cap stocks to outperform. If retail funds aren't flowing into the stock market, then funds likely aren't flowing into small cap stocks.
That have changed already in late 2023 as investors start to warm up the stock market.
To be clear, let's take a look at lower technical graph, so-called "AUM", or AMEX:IWM assets under management chart, that is one of the most important ETFs metrics. While it's been correlated pretty well with IWM price action over the past two years, last December has changed the rule, as managed assets smartly jumped to almost historical highs.
Second, small cap stocks are highly levered and tend to have a higher cost of capital, so a decline or no more hikes in interest rates should benefit small cap stocks much more than large cap stocks.
To be clear, let's compare two graphs: for actual U.S. Interest Rate and Expected on Dec, 2024 Interest Rate.
Finally, an expansion in economic growth could be a "huge tailwind" for small cap stocks as they are highly exposed to the domestic economy.
An overlooked area of the stock market is set to soar in 2024 after significantly underperforming the S&P 500 last year.
In technical terms, AMEX:IWM graph is near to break its 52- and 104-weeks highs, to deliver the price 50 percent higher after a breakthrough, like it did it before, on the hottest ever edge of 2020 and 2021.

Did a bearish D leg just complete? Today I have decided that I, like everyone else, will be an IWM expert!
Everyone is talking about how impressive the spike was. Not a lot of people talking about the ABC structure before it and the fact when we have a spike out of there - that can be trouble.
Here's a little bit of trivia for anyone who wasn't paying attention to it in 2021. During 2021 everything ripped - except this. It traded flat in a range. Ironic, given the meme mania was mainly in this index.
Then it did this;
And that was the end of the 2021 bull market.
This spike also brings us to the zone of a typical bull trap. Something I've been waiting months for.
Very interested in fading this RUT spike.
And if the harmonic reversal failed - would be incredibly bullish.

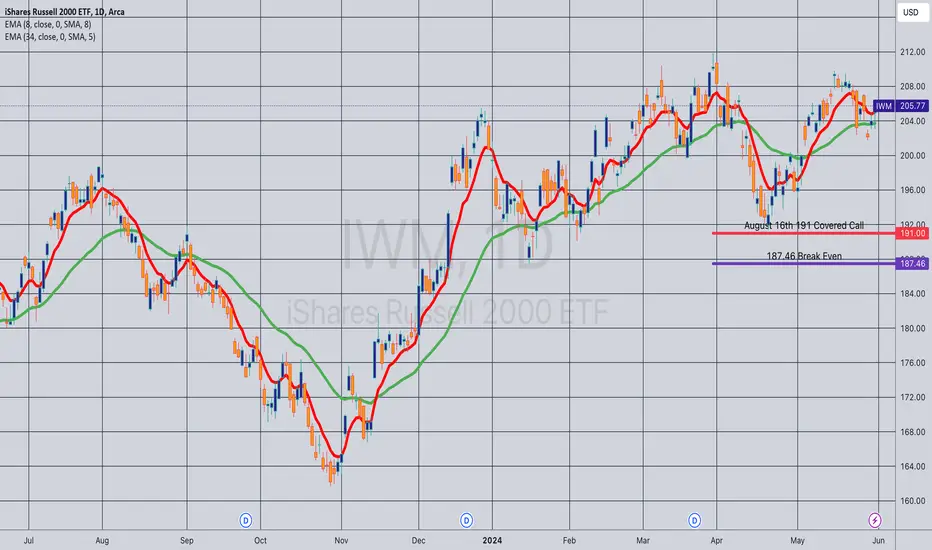
Opened (IRA): IWM August 16th 191 Monied Covered Call... for a 187.46 debit.
Comments: (Late Post). Sold the -75 call against a one lot to emulate the delta metrics of a 25 delta short put, but with built-in short call defense.
Metrics:
Buying Power Effect/Break Even: 187.46.
Max Profit: 3.54 ($354)
ROC at Max: 1.89%
ROC at 50% Max: .94%
Will generally look to take profit at 50% max on the entire setup (stock + short call) as a unit, but won't hesitate to roll out the short call if in profit to keep my break even at or near where the underlying is currently trading.
Golden Fibonacci Sequence Target (Bullish)Impulse wave up, with a 38.2 percent retracement, which usually causes a 161.8 percent extension off the bullish reversal's bounce. Long Posiition tool set for Trade
