Rolling (IRA): IWM February 18th 194 Short Put to March 25th 178... for an .83 credit.
Comments: With only 7 days to go, rolling down and out to the strike paying at least 1% of the strike price in credit. Total credits collected of 3.53 (See Post Below) + .83 = 4.36 relative to the March 25th 178's current value of 1.80, so I've realized gains of 2.56 ($256) so far.
IWM trade ideas

$IWM Russel 2000 - Small caps previous support now resistance?Small caps tend to lead the market. Not a great picture as we saw a strong reversal off previous support yesterday. Technically we have the 50dma trading below both the declining 200day sma and emas. The moving averages are pointing down and we are still under the anchored vwaps from the previous highs. We also seem to be forming a rising wedge formation which are usually continuation patterns in the direction of the previous trend (currently down). Not much to be bullish about in this chart, so odds are in favour of further downside, unless we can climb above a mountain of significant resistance levels above (something which seems unlikely at this stage).

IWM: Handoff RejectionIWM rejected a crucial AVWAP handoff and appears to be giving us a low risk short entry. Notice how price action gave us a repetition of the previous distribution pattern before moving to the downside. That quick fake above the handoff should add fuel to the flame.

IWM MAJOR UPSWING THE BEAR ENDED The wave structure has dropped in a perfect A=C From the Peak to the low 2020 . and has dropped also a near perfect FIB .382 LOOK FOR BIG RALLY IT HAS STARTED . It dropped to the panic cycle fore cast date jan 27 +or - 1

Bearish SharkI have been following this bearish Shark forming on the 2hr chart for a bit. I think there is a great shorting opportunity that will presents itself soon. Understanding the market structure and the macro environment, there is no rush to take bearish trade, but one should be ready as tightening cycle starts to become reality. Should be an interesting next few weeks. All the best!

IWM at critical resistance before reversal or next levelWill it go up or down? IWM at critical resistance before reversal or next level.

$IWM — Market Forecast UpdateThe Russell2000 needs to be stopped; the small cap index is filled with flaky names that have yet to make profit.
These companies, for the most part, don't earn money.
This index will continue to get crushed.
We played the upside breakout to 240s, and we also played the downside break to 190s.
I called the top on this index at 225.
I am forecasting lower.
The CCI is egregiously overextended, we have pitiful volume on strong moves to the upside, and we just created a gap from today's strong move higher.
We have a recipe for a 500% trade with put options.

IWM 180/175 SpreadThis idea is related to my earlier idea. Check it out there for logic as the logic for this trade was essentially the same. In addition to the logic:
1. The return profile was there 10% Return on Margin
2. Appropriate Delta
3. Lovely Cushion / Level for the trade.
See linked idea for technical logic

IWM 184/179 Mar 4th Put SpreadTrade entered today based on my thinking that
1. This is our second green bar in a row, and I believe that either we have found a new range in the 190-200 range or we are headed back up. Which leads me to point number two
2. If we are in fact in a range then the 184 short strike is outside of that range and then some, providing a decent margin of error.
184 was also the 16 delta short strike at the time, and met the return metrics for the trade (10% return on margin required - AKA Max loss). The plan will remain with these trades to close at -200% or take profit at +50%.
Fill on these was -0.57 on average after commissions.
That is it, mechanical and S/R based. Sorry there isnt more secret sauce!

Russell 2000 (IWM) Breaks Major 1-Year Support, More DownsideRussell 2000 represented by its ETF counterpart IWM has now broken a major 1-year support level. This level has provided support (with only minor breaks that ended up reversing) since approximately February 2021.
Interestingly, IWM had a failed breakout / rally back in early November 2021. After about 12 trading sessions, the breakout completely collapsed and price re-entered the trading range (shown in the chart above as a yellow-tinted trading channel).
Moreover, Stochastics and ADX/DMI confirm that a downtrend is well underway in the short term (and perhaps the intermediate term). ADX / DMI shows trend levels rising on the daily chart with ADX at 29.70 and -DI rising well above +DI at approx. 36.9. On the weekly chart (not shown above), the ADX / DMI shows even strong downtrend levels at 30.47. The Awesome Oscillator shows increasing downward momentum on the daily chart as well as the weekly chart. And the Fast Stochastics Oscillator (13/1/3) shows oversold readings, but oversold readings in a downtrend tend to confirm the trend and can remain oversold (i.e., not a buy signal in a downtrend). On the weekly chart, my Fast Stochastic shows a pattern characteristic of a downtrend as %D has been printing for the most part under the 30 level for about 8 weeks, with the week of January 3, 2022 rising to 32, barely above the 30 level before turning lower gain. (Note that January 3, 2022 was the end of the year-end Santa Claus rally.)
With this breakdown, what happens next? Nothing is certain, but technical analysis yields reasonable estimates. A bounce is likely given that Stochastics are quite oversold on all time frames. Even though oversold levels may persist, a better risk-reward entry may be provided when and if IWM bounces (perhaps tomorrow). The bounce could retrace a portion of the recent downward move. I might consider a bounce worth selling between 208-210.
I am trading this cautiously (smaller position) with IWM call credit spread. I chose an OTM call credit spread today as a way of keeping risk smaller (i.e., more premium collected = lower capital risk). But OTM call credit spreads also increase the risk of failure because they are OTM. A higher probability play may be an ITM call credit spread (i.e., around 210-215 strikes)—but because the premium collected will be much lower, the risk is higher and the risk reward ratio is worse.
Near-term target : Approximately 190-195. There could be a bounce as described above.
Stop : A close above 211-212. (If IWM starts dropping like a rock tomorrow, it might be better to avoid chasing and wait for the next bounce if there is one.) A better entry would occur after an overbought signal on the Fast Stochastics using shorter term timeframes intraday.
DISCLAIMER: Please do not trade options or IWM securities unless you understand risk, position sizing, and the security product being traded. And please do your own research. I cannot provide financial advice and am not licensed nor offering services as a financial advisor.

IWM time to look upIWM from 244 to 187. That's a fall.
Ok let's see how fib levels are set up at the moment, 209 is monthly fib resistance, I like abc pattern, so let's consider the low is in place and next stop loss is 195 and take profit is monthly fib 209. Once that's confirmed the next target is 50% to 61.8% that gives us 200-222. Once we are there, we will see how it goes. Please do your analysis as well and if your opinion does not match mine then good luck to you.

IVM death cross, waiting price to challenge supply zoneI wonder if we will se a continuation of a downtrend or we will resume uptrend.
Please do not short, if short please set stop loss

$IWM likely retest the low range of January$IWM the small-cap index ETF, which broke down its 1 year-long distribution area, is looking like the second weakest index in terms of structure (still hasn't made past the fib 0.382 level which indicates weakness)
- With 2 weekly rejection candles, the index is looking like it will inevitably test the bottom of the trading range, there's around a 4% downside from the current level.
Personal trade:
Taken short position from the 0.382 level
- Entry 201
- first take profit 194, second take profit 191.
- Stop-loss 205.

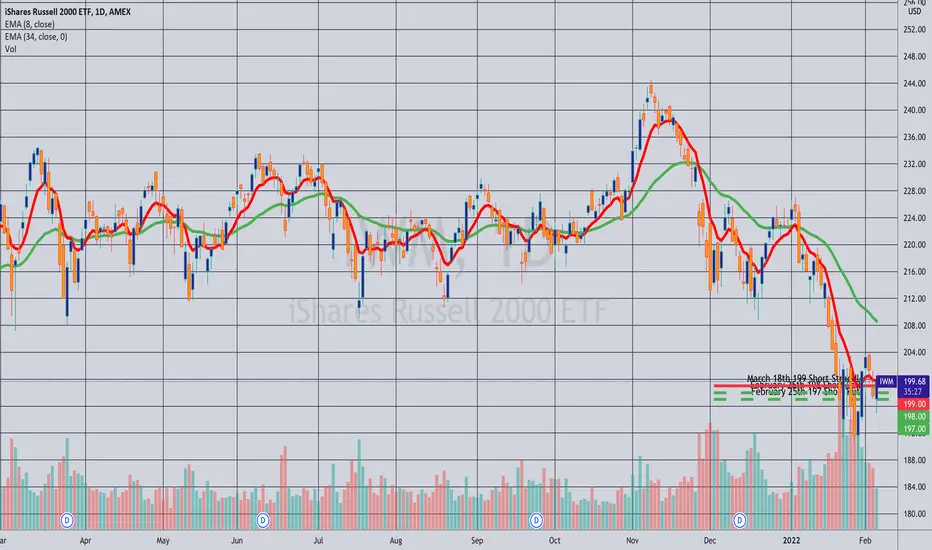
Rolling: IWM February 25th 197/198 Short Strangle to March 18th... 199 short straddle.
Comments: As with my February 18th IWM tight short strangle, rolling out my February 25th to the March 18th 199 short straddle for a 4.24 credit. Total credits collected of 12.80 relative to the March 18th 199 short straddle price of 14.46, so also still slightly underwater. I'll continue naturally continue to do defensive adjustments as necessary to keep these setups from getting too directional.
Rolling: IWM February 18th 198/197 Short Strangle to March 11th ... 199 short straddle for a 4.24 credit.
Comments: Locking in some realized gains by rolling the tight short strangle out to the March 11th 199 short straddle with 14 days to go. Total credits collected of 12.10 relative to the March 18th 199 short straddle price of 13.01, so it's still slightly underwater (credits collected are less than the current price of the setup).

Opening (IRA): IWM April 14th 160 Short Put... for a 1.73 credit.
Comments: Adding a rung out in the April monthly as part of a longer-dated strategy to emulate dollar cost averaging into the broad market using SPY, IWM, and QQQ. Targeting the strike paying at least 1% of the strike price in credit. Will generally look to roll at 50% max.

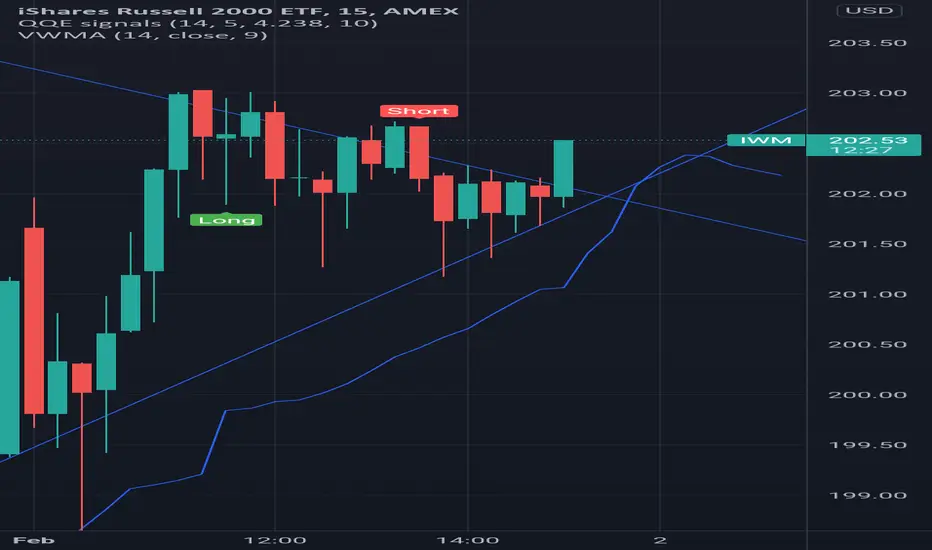
IWM Testing Descending Channel IWM is testing a descending channel.
The flattening/pancaking of heikin ashi signals an aggressive impending move (up or down, who knows really).
Odds are actually in favour of a move up, tbh.
Probability of low less than or equal to 200 is 14% (Based on past 2 months of performance data).
Probability of a high greater than or equal to 200 is 97% (Based on past 2 months performance of data).
My recommendation, if you want the odds in your favour:
If you wanna go long: Aim to go long below 200 (if we test below again), odds will be in your favour for a move to the upside in the coming 1 to 2 weeks.
If you wanna go short: Aim to go short above 202/203 (if we test that high) but be careful because if we break that descending channel, we may see an aggressive pop.
The lines in green are realistic price targets for a short position. However, I have already closed out my short position at 199 this morning.
I am leaning towards a potential long entry personally, but waiting to see if we get an EOD sell off and aiming long below 200 if we can see that.
My focus is actually on XOM right now, but hoping to add an IWM position by EOD if market permits :).
Best of luck!
DISCLAIMER:
Not financial advice. Not a financial advisor. Just an ex-epidemiologist who enjoys mathematical modeling.
At the end of the day, I trade price action. I use regression analysis to plan my entries and exits and chart support and resistance levels (I find it more accurate than looking at the chart). However, its not always correct and I am sometimes wrong.
Manage your risk! Its okay to be wrong, and you will be wrong, just manage your risk and you will live to see another day. Its not the end of the world :).
My linear regression models are done in SPSS. I can't share pictures, but am happy to answer your questions.

Rolled (IRA): IWM March 11th 171 Short Put to March 18th 181... for a 1.24 credit.
Comments: After a few short days, this one's already at 50% max, so I rolled it out to 16 delta strike in the expiry nearest 45 days. Total credits collected of 2.59 (See Post Below) plus the 1.24 here or 3.83 relative to the 181 short put price of 2.13, so I've realized gains of 1.70 ($170) by rolling here.

tightening range small caps broke bull (IWM)the tightening range broke to the upside. if we can treat the area as support we could continue higher into upper 202s
IWM Iron Condor 183/212 Video says it all, two part trade which started as a put credit spread. Added call side for some P/L offset if we continue to move downwards.

Russell 2K (IWM) showing Wyckoff Distribution?Richard Wyckoff theorized that one could understand the market and its movement through analysis of supply and demand, which can be ascertained from studying price action, volume, and time. According to Wyckoff, the market moves in cycles. First, there is a period of accumulation followed by a mark up period. Then there is a period of distribution followed by a mark down period. The cycle then repeats itself. Seeking to improve efficiency when trading, Wyckoff created the Wyckoff schematics which depict trading ranges of accumulation and distribution by smart money.
In 2020, we saw a major market crash as COVID caused the world to shut down. Once the F.U.D. diminished, the Wyckoff accumulation cycle began and the Russell was quickly marked up in a matter of months. In 2021, the Russell has traded mostly sideways. Following Wyckoff's cycle, one could presume that this is the Wyckoff distribution pattern which can take up to a year to fulfill.
The Wyckoff Distribution Pattern is split into phases. I have outlined each phase on the chart to provide clarity. The distribution is broken down as such:
Phase A:
The Preliminary Supply (PSY) is established. This is where big money begins to offload some of their accumulated position. It is bought up by retail traders and sent to new highs. Big money then offloads a larger portion of their position at the Buying Climax (BC). This causes a massive wave of selling as supply significantly outweighs demand. Panic selling ensues and stop losses are triggered. An Automatic Reaction (AR) occurs as the supply and demand balance out. The low of the AR and high of the BC establish a trading range for the rest of the distribution.
Phase B:
This phase consists of supply and demand testing. Buyers will attempt to reclaim the trend through upthrusts (UT) but big money meets this demand with more supply and sends shares back into the trading range. Big money will then perform secondary tests (ST) and look for signs of weakness (SOW) to assess the remaining supply and demand imbalances. This results in a long period of consolidation. Not that we should see low volume in the middle of the range and volume spikes toward the boundaries.
Phase C (Optional):
This phase is characterized as a false breakout. It is used to trick traders out of their positions so big money can offload more supply, sending shares lower in one final push. Upthrust after Distribution (UTAD)
Phase D:
This phase will often illustrate a clear imbalance between supply and demand. Price will show large volume and price declines toward the lower boundary of the trading range. At this point, big money has little to no long position left and has likely initiated a short position. The market will begin to make a down-trending structure of lower highs and lower lows. I believe we are currently at this phase of the cycle.
Phase E:
The mark down period begins. There are several possible catalysts to trigger phase E. The most obvious is the anticipation of rate hikes from the Fed. From here, we will begin to look for the start of the next accumulation period.
**It is important to note that the Wyckoff Distribution Pattern is only a model and that the chart wont match it perfectly. As long as the fundamental concepts of the model hold true, the pattern should work. I will be looking for short signals and confirmations via market structure and volume.
Let me know your thoughts on this unusually long explanation. Happy trading!

IWM indicates a stock market collapse is incoming in 2022South Africa has since detected B.1.1.529 (Omicron Variant) in specimens collected on November 8, 2021 - CDC
Funny how we tagged the 1.618 fib on the same day the Omicron Variant was discovered.
- Weekly Bearish Divergence playing out
- The pump to 243 resembles a UT or UTAD of a Wycoff Distribution pattern
- Target: 137

Time to Long IWM? Is it time to long IWM after today's bul run?
To get to the point, IMO, No.
Here is my analysis and plan with IWM:
Fundamentally:
Some of the biggest stocks with the most growth of 2021 were small cap stocks, which IWM tracks.
These are the stocks that are being hit the hardest with this market correction. *cough* AMC *cough*.
Historically:
IWM has surpassed SPY and DIA in correction/sell off during rough market times.
It has lost between 64% on the high end and 24% on the low end in these market down turns (looking at data from 2008, 2018, COVID).
From its ATH high in November, we are currently at around 22% (rounded up). There is a possible 2% to 44% left of correction.
Chart Trend:
Obviously, we are in a down trend. (No! Really?! ;) )
SPY and DIA are appearing in a flattened, pancake pattern (usually indicating an impending aggressive move coming). However, ARKK and IWM have re-established the bearish flat top indicating a strong down-trend, even after today's EOD bull-run.
Mathematical Modeling:
IWM has been on-point in regression analysis these past 2 weeks.
Today, regression models I have made of IWM predicted a possible low of 189.06 (with SD=9). We made a low of 188.09, a 0.97 point difference and well within the SD variance.
I had predicted a possible high of 193.58 (SD=9), with an actual high of 195.31, a 1.73 point difference and well within the SD variance.
Even after adjusting the model with today's variables, the model still predicts a continuation of lower highs and lower lows in the coming week.
Furthermore, there has been no invalidation of the regression model, even with the bull run at EOD. The stock still performed within accepted limits of the regression model. For an invalidation to have occurred, the stock would have to have at least tested 201.58 on the high end or 180.06 on the low end. This would indicate a change in sentiment and a call to re-look at the stock's behaviour. This was not the case today.
Probability:
I don't like communicating probability to other people, I simply use this as my own gauge to set realistic price targets. But I will share my thoughts,
The probability favours a move to the upside here. However, keep in mind that probability in trading is highly biased. Its biased because it does not take into account time (so there is generally a favourable probability to the upside vs the downside, but no indication of when that is and this is true for truly any stock, stocks in general are long biased).
The other bias is that this data is based only on January data and probability favors where most values fall. In this case, most values fall above 200 points for January and thus, as far as probability is concerned, there is more likely a chance of reaching a value in the 200s because that is where most values fall.
Yet still, probability is a powerful tool (IMO) to use and its worth mentioning. The probability that we reach a value between 196 and 200 is roughly 5%.
However, the probability we have a low of less that 200 points is actually fairly high by trading standards, its 27.45%. Not bad!
Possible outcome next week:
The market wants to make a big move. I mean, those of you who actively trade in the market every day can see it. With these huge bull runs followed by huge bear runs, this bouncing everywhere, the market is itching to make a huge move in some direction.
Heikin Ashi on DIA and Spy are pancaking indicating a build up and desire to break out in some direction.
LR Forecasting for Monday are positive, with slightly higher highs than today. However, this is followed by a decline in highs and lows with a move to the downside.
In the past, during sustained selling off, IWM likes to do bounces on the way down that stretch about 8% on average. So it may not be unreasonable to observe a bounce in the market tomorrow. This would put IWM at a price of around $204.
From there, it is possible we go lower. Much lower.
Forecasting shows lows could be as low at 175 next week (however, I never trust data more than 1 or 2 days out, without correcting with previous day data, so I would wait for Monday data before doing anything with this information).
My Outlook:
I tend to be short biased.
I am going to be looking for a break of 196.07 with good volume and bullsih appearance on hekin ashi to POSSIBLY go long up to around 200.
I will be looking at around 200-204 (if we do that high) to short, provided I see this in the price action.
I think we need a bit of a bounce to stabilize the market. The RSI on IWM is stabilizing out from being oversold to being in an area where it could make a bit of a move lower.
To be honest, I have no idea where we are heading. I tend to think we are heading to the short side. If I have to put money on it, I would bet the short side. However, I am not swinging any position period in this current market. My trades are intraday and that's it (aside from a short position I currently hold with BA).
Today I played IWM on both the short and the long side. And plan for that to be the case next week as well.
DISCLAIMER:
Not financial advice. Not a financial advisor. Just an ex-epidemiologist who enjoys mathematical modeling.
At the end of the day, I trade price action. I use regression analysis to plan my entries and exits and chart support and resistance levels (I find it more accurate than looking at the chart). However, its not always correct and I am sometimes wrong.
Manage your risk! Its okay to be wrong, and you will be wrong, just manage your risk and you will live to see another day. Its not the end of the world :).
My linear regression models are done in SPSS. I can't share pictures, but am happy to answer your questions.
Have a great weekend!
