MastercardFalling Wedge Breakout
Formation of HH and HL
Aggressive Entry @ current Level (360.06)
Conservative Entry @ formation of HL, confluence with trendline support (355)
Trade with specified Stop Loss
TP levels are specified
Ride the trend with trailing stop Loss
MA trade ideas

W Pattern Formation (Double Bottom)Master Card is Forming the Double Bottom Pattern on the Hour TimeFrame After the Breakout of the 200days Plus Trend Line. First Target Should be $348.92 and seconf target should be $352 Around. Good Short Term Long Trade we can take. Please Take a look at the Chart.

MA: End of bearmarket rally?!Mastercard
Intraday - We look to Sell a break of 338.10 (stop at 362.71)
The primary trend remains bearish. Trading within the Wedge formation. A move higher faces tough resistance and we remain cautious on upside potential. Further downside is expected. A clear break of 338.10 and we would look for further gains to 276.50.
Our profit targets will be 276.50 and 260.00
Resistance: 343.00 / 380.00 / 420.00
Support: 280.00 / 230.00 / 160.00
Please be advised that the information presented on TradingView is provided to Vantage (‘Vantage Global Limited’, ‘we’) by a third-party provider (‘Signal Centre’) . Please be reminded that you are solely responsible for the trading decisions on your account. There is a very high degree of risk involved in trading. Any information and/or content is intended entirely for research, educational and informational purposes only and does not constitute investment or consultation advice or investment strategy. The information is not tailored to the investment needs of any specific person and therefore does not involve a consideration of any of the investment objectives, financial situation or needs of any viewer that may receive it. Kindly also note that past performance is not a reliable indicator of future results. Actual results may differ materially from those anticipated in forward-looking or past performance statements. We assume no liability as to the accuracy or completeness of any of the information and/or content provided herein and the Company cannot be held responsible for any omission, mistake nor for any loss or damage including without limitation to any loss of profit which may arise from reliance on any information supplied by Signal Centre.

Buying Mastercard on dips.Mastercard - 30d expiry - We look to Buy at 309.51 (stop at 297.77)
The primary trend remains bullish.
Support is located at 310 and should stem dips to this area.
Short term momentum is bullish.
A lower correction is expected.
308.8 has been pivotal.
Short term bias has turned positive.
This stock has seen good sales growth.
Our profit targets will be 338.38 and 347.38
Resistance: 325 / 340 / 360
Support: 320 / 310 / 300
Disclaimer – Saxo Bank Group.
Please be reminded – you alone are responsible for your trading – both gains and losses. There is a very high degree of risk involved in trading. The technical analysis , like any and all indicators, strategies, columns, articles and other features accessible on/though this site (including those from Signal Centre) are for informational purposes only and should not be construed as investment advice by you. Such technical analysis are believed to be obtained from sources believed to be reliable, but not warrant their respective completeness or accuracy, or warrant any results from the use of the information. Your use of the technical analysis , as would also your use of any and all mentioned indicators, strategies, columns, articles and all other features, is entirely at your own risk and it is your sole responsibility to evaluate the accuracy, completeness and usefulness (including suitability) of the information. You should assess the risk of any trade with your financial adviser and make your own independent decision(s) regarding any tradable products which may be the subject matter of the technical analysis or any of the said indicators, strategies, columns, articles and all other features.
Please also be reminded that if despite the above, any of the said technical analysis (or any of the said indicators, strategies, columns, articles and other features accessible on/through this site) is found to be advisory or a recommendation; and not merely informational in nature, the same is in any event provided with the intention of being for general circulation and availability only. As such it is not intended to and does not form part of any offer or recommendation directed at you specifically, or have any regard to the investment objectives, financial situation or needs of yourself or any other specific person. Before committing to a trade or investment therefore, please seek advice from a financial or other professional adviser regarding the suitability of the product for you and (where available) read the relevant product offer/description documents, including the risk disclosures. If you do not wish to seek such financial advice, please still exercise your mind and consider carefully whether the product is suitable for you because you alone remain responsible for your trading – both gains and losses.

Short $MA from 3444th test on top range and this channel is starting to look really strong and trustworthy. With last week's crazy pump, I think we are in for a beautiful entry early next week. Let's see how it opens and if we can get filled at 344. Otherwise I might chase price a little, as this setup looks too good to miss.
Ps. Price is also breaking out of 300-400 range where it has been since mid 2020.
The risk/reward on this is very nice I think.
Entry: 344
SL: 362.5
TP: 284

$MA with a Bullish outlook following its earnings #Stocks The PEAD projected a Bullish outlook for $MA after a Negative over reaction following its earnings release placing the stock in drift C with an expected accuracy of 50%.

mastercard to 329.20$Hello ladies and gentlemen, according to my chart analysis and the earnings of mastercard , there is a high probability of an increase towards over 329.20$

MANot financial advice. The essence of investing & trading is the intelligent and patient preying on the greed, fear, impatience, addiction and ignorance of the majority. It's definitionally Darwinian.

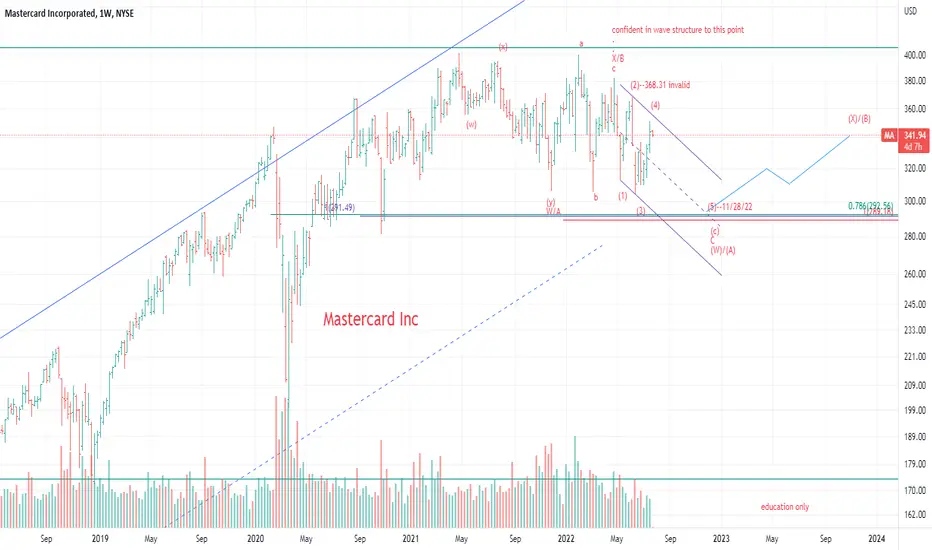
MA daily frame (ending diagonal in C wave support 261 11/22/22)just an update on this mastercard chart...looks like a final fifth / C/ (A)/(W)

MASTERCARD ......... Looks BearishLooks bearish......... ad if Mastercard looks bearish, the whole economy is in bad conditions

Um... Why Is There A Dinosaur Staring At Me? 😄Yes, found it a little amusing and decided to share it with whomever chooses to look 🤷
If you know what it means specifically let me know
Take care 🦚
#25SIGMA

Mastercard flailing in the waves.Another bearish pattern here.
We are not in the business of getting every prediction right, no one ever does and that is not the aim of the game. The Fibonacci targets are highlighted in purple with invalidation in red. Confirmation level, where relevant, is a pink dotted, finite line. Fibonacci goals, it is prudent to suggest, are nothing more than mere fractally evident and therefore statistically likely levels that the market will go to. Having said that, the market will always do what it wants and always has a mind of its own. Therefore, none of this is financial advice, so do your own research and rely only on your own analysis. Trading is a true one man sport. Good luck out there and stay safe.

An Masterbuy!Mastercard - Intraday - We look to Buy at 309.31 (stop at 301.98)
Support is located at 310.00 and should stem dips to this area.
Weekly pivot is at 304.71.
Weekly pivot is at 303.19.
Dips continue to attract buyers.
The primary trend remains bullish.
The RSI is trending lower.
We look for a temporary move lower.
Our profit targets will be 329.69 and 336.69
Resistance: 330.00 / 335.00 / 340.00
Support: 320.00 / 315.00 / 310.00
Weekly chart for context
Disclaimer – Saxo Bank Group. Please be reminded – you alone are responsible for your trading – both gains and losses.
There is a very high degree of risk involved in trading. The technical analysis , like any and all indicators, strategies, columns, articles and other features accessible on/though this site (including those from Signal Centre) are for informational purposes only and should not be construed as investment advice by you. Such technical analysis are believed to be obtained from sources believed to be reliable, but not warrant their respective completeness or accuracy, or warrant any results from the use of the information. Your use of the technical analysis , as would also your use of any and all mentioned indicators, strategies, columns, articles and all other features, is entirely at your own risk and it is your sole responsibility to evaluate the accuracy, completeness and usefulness (including suitability) of the information. You should assess the risk of any trade with your financial adviser and make your own independent decision(s) regarding any tradable products which may be the subject matter of the technical analysis or any of the said indicators, strategies, columns, articles and all other features.
Please also be reminded that if despite the above, any of the said technical analysis (or any of the said indicators, strategies, columns, articles and other features accessible on/through this site) is found to be advisory or a recommendation; and not merely informational in nature, the same is in any event provided with the intention of being for general circulation and availability only. As such it is not intended to and does not form part of any offer or recommendation directed at you specifically, or have any regard to the investment objectives, financial situation or needs of yourself or any other specific person. Before committing to a trade or investment therefore, please seek advice from a financial or other professional adviser regarding the suitability of the product for you and (where available) read the relevant product offer/description documents, including the risk disclosures. If you do not wish to seek such financial advice, please still exercise your mind and consider carefully whether the product is suitable for you because you alone remain responsible for your trading – both gains and losses.

MA Shortweekly Trendline break + retest
Earning: 7/28/2022 Est. 2.35
Short 333
Stop 350
Target 280, 250
Risk management is much more important than a good entry point.
I am not a PRO trader.
In my trading plan, the Max Risk of each short term trade should be less than 1% of an account.

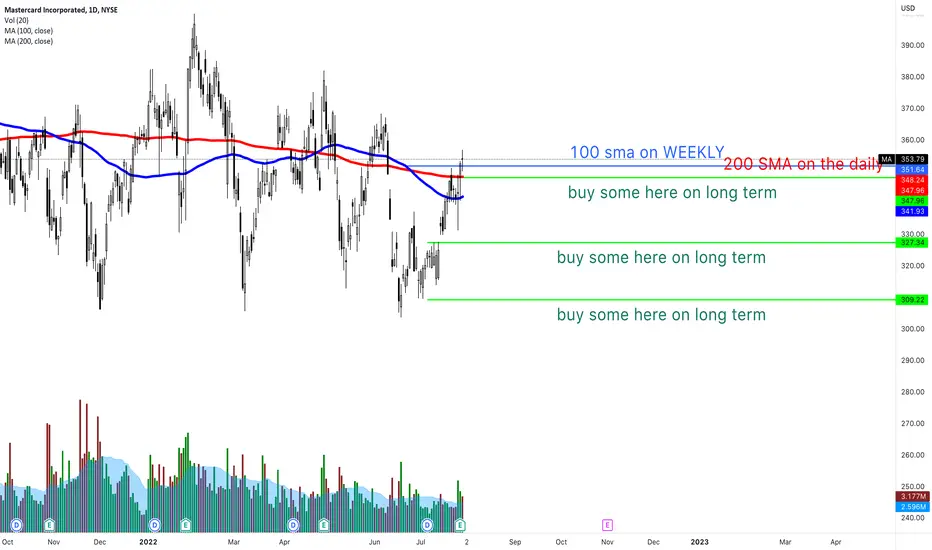
MA buying locations Long term, a company that's going no where. Really good levels to add to a position if you wanted one.
MA weekly frame (end diagonal in the C wave)the rarest of rare ending diagonal in the wave c position...its actually a crap trade imo

Rectangle/Descending TrianglePrice barely broke the bottom trendline of both structures which share the same bottom trendline. 2 Candle shadows/tails broke the trendline and price has recovered and is back inside. Perhaps MA was saved by the rally!
MA has been making lower highs which formed the descending triangle. The bottom trendline is flattish with multiple bottoms.
This pattern and a Rectangle are both neutral patterns unless a trendline is broken with a trend in that direction. If price were to break the upper trendline of the triangle, there is the rectangle upper trendline to contend with.
No recommendation//be safe

$MA with a Bullish outlook following its earnings #Stocks The PEAD projected a Bullish outlook for $MA after a Positive over reaction following its earnings release placing the stock in drift B with an expected accuracy of 50%.

Mastercard - Time to Prepare for Deep Correction up to 50%?Is there much left to squeeze out of the never ending bull run on Mastercard ?
Fundamental indicators: for the long time Visa and Mastercard were undefeated corporate giants with unbelievable circa 40% profit margins and growing exponentially since 2008 crisis. Let's look at some factors, if any, that may break this trend
Recession - warning macro signals suggest that world economies are slowing down and recession is possible within a year, this may be reflected in the forecast of the company
Eastern Europe conflict - ban on use of Visa and Mastercard in Russia will certainly have an impact on earnings
P/E - is quite high at 39x and possible correction may let some steam out of the overpriced stock
Technically:
Following the correction of 2020 which took a form of Running Flat (ABC, 3-3-5) it is very visible that the price is moving very choppy which usually suggests that there is not much energy left in the bull run and Ending Diagonal is developing
The Ending Diagonal takes structure of 3-3-3-3-3 and the current proposed idea indicates that waves 1-4 have completed and wave C of 5 is about to begin to update the high of $402
What's next - given that the last correction was nearly 540 days, the next one will be even longer once the Diagonal is completed. The shape and depth will be clear during the development but it's likely for the price to test levels of 250 (0.382x Fibonacci retracement) or even $200 which is 0.5x.
It will be clear what scenario is developing following the upcoming earnings report.
Please share your thoughts in the comments and like this idea if you would like to see more stocks analysed using Elliott Waves.
Thanks


RectangleTargets for a break to the upside in green over the resistance line and targets for a break to the downside in orange below the bottom support line.
This pattern is neutral until a trendline is broken with a confirmed trend in that direction. There are patterns inside a rectangle that is large like this one that can be traded, but the rectangle is the primary pattern that I see.
This rectangle has been going on for quite a while. There are patterns inside the rectangle including a small Bullish Butterfly. MA was unable to complete an entire upswing so far after hitting the potential reversal zone of 1.272 which was close to the support line of the rectangle. A Bullish Butterfly has a 2nd leg that retraces to the .786/or close/of XA and a final leg that completes at, or close to the 1.272 of XA. MA did make it to the 2nd peak so far which would be target 1 for many who trade this pattern.
Short interest is low at 0.61%. Earnings are 4-28 BMO.
Negative volume remains high on MA.
No recommendation

Mastercard Inc Fractal MapRate of change as delta in price and time in terms of fibonacci shows the safest levels to invest. Usually opportunity comes inside coldest colors. Green is considered as ALL IN.
Crossing black fib lines confirms a signal.
