Micron, getting ready to explode?Is Micron is getting ready for a big move? Double bottom price target $137. Falling wedge price target $170
MU trade ideas

MU - Micron TechnologyReuters
Micron
CEO Sanjay Mehrotra said last year that the U.S. memory chip maker's planned $2.7 billion testing and packaging unit in Gujarat would help create about 5,000 jobs in the state.

Double Bottom Is Forming on MicronMicron is in an interesting position after shedding a great amount of value in the last 3 months. The Fundamentals are great and Microns Balance Sheet has very few problems! with the double bottom forming this could be signaling a very bullish sentiment with a possible reversal towards the upside. Micron is currently being forecasted with Revenue and EPS Growth.
----------------------------------------------------------------------------------------------------------------
Balance Sheet: Micron has a decent Debt to Equity Ratio while having more then 3 Assets for every 1 Liability which is personally important to me when looking at stocks, Debt is Manageable especially should Micron beat all forcasts
Cash: US$8.38b
Debt: US$11.33b
Total Liability: US$22.03b
Total Assets: US$66.26b
Debt to Equity Ratio is: 25.6%
----------------------------------------------------------------------------------------------------------------
Resumed its Share Buy-Back Program
----------------------------------------------------------------------------------------------------------------
Highly Important Industry Supplier and Affiliates: Being Extremely Important with Industry Titans like Nvidia, Apple, Intel, MPS/Monolithic Power Systems, AMD, Texas Instruments, Microsoft, Gigabyte, Broadcom.
----------------------------------------------------------------------------------------------------------------
Diversified Business Model: Micron is not just a memory business its highly Diversified in
23.46% of there Revenue is derived from Microns -> "Mobile Business Unit"
23.4% of there Revenue is derived from microns -> "Embedded Business Unit"
36.74% of there Revenue is derived from Microns -> "Networking and Business Unit"
16.43% of there Revenue is derived from Microns -> "Storage Unit Business"
----------------------------------------------------------------------------------------------------------------
While Micron is in another uptrend in Revenue growth I think personally this time it could be more permanent growth, Micron is Extremely Undervalued compared to market peers such as Nvidia, and Micron with PE Ratios being well above 50 while Micron is extremely important within the Artificial Intelligence industry it benefits from a wide range of industries such as Artificial intelligence, Automotive, Computers, Memory, ETC.
----------------------------------------------------------------------------------------------------------------
Disclaimer: I am not a financial expert or have any certifications I just trade stocks as a personal hobby and I greatly encourage you to do your own research and not just take words at face value to make extremely risky investments. Please do your own Research I am not giving Buy, Sell or Hold Signals, This is just for healthy conversation and nothing else.
----------------------------------------------------------------------------------------------------------------
Idea:

I'm betting for a double-bottom formation from $MUAreas of AI outside of HBM continue to be strong, but there are important caveats to consider. In contrast to HBM where bits and pricing are committed through next calendar year eSSD and 128GB RDIMMs are likley to see narrowing margins from here given higher levels of competition in the second half. For high capacity memory modules SK Hynix had a monopoly for most of last year, but as Micron and Samsung have entered the market with non TSV based solutions MS Research Analysts expect the price premium to shrink materially from here even as volumes continue to rise. Something MS Research Analysts are hearing about now from our recent checks. Despite the underhyped nature of high capacity RDIMM demand Micron's guidance is that those products will contribute a similar "several hundred million" of revenue this FY, so that does matter when thinking about MUs overall AI exposure.
In NAND weakness in consumer and mobile markets should be pushing more bits towards datacenter applications, at the same time WDC plans to have a more material presence in the DC market in the second half where they have traditionally had well below their overall market share. MS Research Analysts expect all the AI products to continue to be margin accretive for some time, but in some areas that degree does seem likely to become smaller by year end.
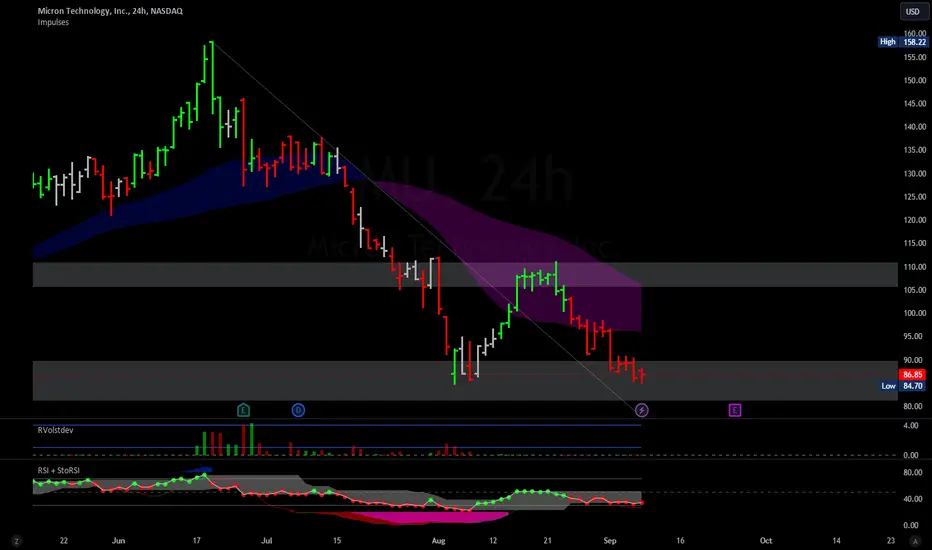

$MU - Just watch for nowNASDAQ:MU The stock has pulled back 33% since the July 2nd post. It’s currently sitting on support at a critical juncture that could determine a breakdown or a bullish reversal.
Reclaiming the $99 to $100 area would be bullish, while losing the $94 area would be bearish.
I’ll be watching this one closely and might be interested in taking a position around $90 and below. 👀

Micron Technology Inc: massive growth and massive retreatMicron holds a track record of an extremely volatile stock (Beta 2.7) in a history of past 30 years. Having analyzed all the instances when the stock had massive growth followed with similar retreat, there have been few of them (no matter what were macro/ micro causes):
1995 it saw a 12 fold, 2000 – 10 fold, 2014 – 7 fold, 2018 – 7 fold, by early ’22 – 3.5 and finally by mid’24 – 3,25 GROWTH
*Zoom in the attached monthly chat too see actual price swings and length of impulse, corrective waves. Remember, I used those impulse waves resulting in RSI to be extremely overbought (i.e. red bars on RSI chart
If in 90s/ early 2000s it retreated fibo .9, .9, 1.04 - in other words it practically gave up all the massive gains after RSI was in overbought, Then last 10 years the stock held more relative strength, less volatility and retreats were: in ’14 - .87; ’18 - .67; 22 - .7 & mid ’24 - .67
It indicates, that the recent June – August retracement of .67 is generally in line with the latest decade cases (the length of the last upward wave was 109 and a correction wave to August low was 73. Out of the local low, if the history doesn’t fail us, I would consider a 3-fold growth is possible. 85 to 255 on a horizon of the next two years or so. GLTAL!

MU - Micron Technology Stock #13-Monthly Chart: There is a strong pullback and has reached the low of the last 3 monthly candle.
Monthly Chart: A strong rejection at the resistance level and shows a bullish signal on the RSI.
Weekly Chart: The chart shows several bullish signals on the RSI and indicates bullish pressure from the monthly resistance level.
Daily Chart: Only a small pullback, hitting the Fibonacci level

MU: This is a decisive moment! |1H & D charts|1-Hour Chart (Left Side)
On the 1-hour chart, the price formed a strong uptrend followed by a consolidation pattern, identified as a flag. This pattern typically indicates a continuation of the previous trend, meaning that a breakout above the flag's resistance could lead to further gains. However, the price is currently testing the lower boundary of the flag, which is aligned with the 21-period EMA. If the price breaks below this level, it may invalidate the bullish flag, leading to potential downside pressure.
Daily Chart (Right Side)
On the daily chart, the price is approaching resistance around $127.24, which aligns with an open gap. The gap closure often acts as a resistance level, and the price action around this area could determine the next move. If MU's price loses the lower support of its flag pattern seen on the 1h chart, its price could seek its next Fibonacci's Retracements, which are now our next support levels.
Only a clear bullish reaction, breaking (and closing) above the 109.47 would trigger tthis bullish flag upwards, starting a new bullish rally to its gap. For now, MU's price looks weak.
Key Levels to Watch
Resistance: $109.47 is the immediate resistance, with a potential breakout indicating further upside.
Support: The $104.77 level.
Summary
MU is at a crossroads where the resolution of the flag pattern on the 1-hour chart will likely dictate the next significant move on the daily chart. A breakout could lead to continued upward momentum, while a failure might result in a retracement towards lower support levels.
For more detailed technical analyses and insights like this, be sure to follow my account. Your support helps me continue providing valuable content to help you make informed trading decisions.
Remember, real trading is reactive, not predictive, so let's stay focused on the key points described above and only trade when there is confirmation.
“To anticipate the market is to gamble. To be patient and react only when the market gives the signal is to speculate.” — Jesse Lauriston Livermore
All the best,
Nathan.

$MU Call momentum short dated and going ABOVE ASK Someone's sweeping up some serious gains with that big broom on NASDAQ:MU 🧹💰
Buying above ask and going short-dated? That's a bold move!
Let's see where this ride takes us!
NASDAQ:MU Call momentum! 💾
$97C Aug 16, 24 (4d)
ASK: 3171 @ $1.21 ($244K)
Vol/OI Ratio: 3K/664 (4.78)
Date: 08/12/2024 @ 11:30am
%OTM: 2.53%
🚨#YUSUKE_ALERT🚨
#StockSweeper #BoldMoves #OptionsTrading

Breakout imminent a few areas keyAfter the selloff, the disappointing earnings, and the guidance, it still seems Wall Street is on its tail. see this as a potential strength, not a weakness. Over 100+ possible.

MU: This is a Critical Support Level (GAP) | (D / W Charts).The MU chart analysis from both daily and weekly perspectives reveals significant technical dynamics affecting the stock's price trajectory.
Daily Chart Analysis:
The daily chart showcases a completed head and shoulders pattern, a classic bearish reversal indicator. The neckline of this pattern was decisively broken, and subsequent price action continued downward, confirming the bearish outlook suggested by this formation. We did warn about this pattern in our previous public analysis, here on TradingView, and the link to it is below this post, as usual.
This bearish trend was further validated by the price falling below the 21-day exponential moving average (EMA) and finding a resistance there, reinforcing the strength of the downtrend. Recent trading sessions depict attempts at stabilization, with the stock managing to close a prior gap, signaling some buying interest at these lower levels. However, the sustainability of this support is yet to be confirmed as the price seeks a new equilibrium.
Weekly Chart Analysis:
On the weekly timeframe, the broader view into MU's price action shows a consistent downward movement post the head and shoulders pattern visible on the daily chart. The significant drop beneath the 21-week EMA underscores a strong bearish momentum.
Moreover, the gap at 86.82 is visible in this time frame as well, and it is acting as a mid-term support level for MU, which dropped significantly in the past few weeks. The proximity to gap support around $86.82 will be critical to watch, as a sustained break below could accelerate further declines towards lower support levels. On the other hand, if we see a confirmed bottom in this area, the timing would be perfect for a bounce.
Overall Outlook:
Both charts align to paint a bearish picture in the short to medium term, driven by key technical patterns and breaks below essential moving averages. The closing of gap on both charts suggests that the market is attempting to stabilize around a support level. For now, we should monitor these developments closely, as the ability of the stock to hold above recent lows or breach them could dictate the next major movement direction for Micron's shares.

MU Trend BreakMU had a lot of hype earlier in the year, but it led to a big fakeout and it has been extremely weak since topping out at ATH. It is well below its major uptrend and I think it has farther to go. The gap fill below is my first target.

$MU Gamma level at 100, with trend line match upNASDAQ:MU Gamma level at 100, with trend line matching up.
Looking for a move back to 115.

Micron Technology - Patience and price action!NASDAQ:MU is literally creating so clear and repetitive market structure, this is textbook.
Bullish break and retest, cycle and correction. Micron Technology has been repeating this price action for over a decade and is about to enter another correction phase. If you don't want to trade this anticipated correction, you can instead wait for another retest of previous resistance, bullish confirmation and a rejection. Following the cycles, a bullish move there is quite likely.
Levels to watch: $140, $95
Keep your long term vision,
Philip - BasicTrading

Micron Micro ManagementBig potential influence red zone lurking above (had this project designed before the two inflections at the red and stop at first pink rectangle. Looking forward to see if it continues to flirt with the red under it, or if it starts to weaken following the path of the rectangles. In other scenarios any of the rectangle zones waiting below in the future could also become support to trigger more bullish tones.
Will provide comments in the future with price action updates or even added zones of interest.
Not overly attracted to the grey scenario that propels the stock higher after exiting the red, but earnings report might spoil the whole setup with a jump and penetration of the red kind of cancelling the whole concept for the potential future.

MU: A Dangerous Bearish Reversal Structure! (D&W charts)The chart for MU displays a significant head and shoulders pattern on the daily timeframe, a classic technical formation that often precedes a reversal.
The left shoulder formed in mid-May, followed by a peak to create the head in mid-June, and the right shoulder developed by early July. This pattern suggests a potential reversal in the prevailing uptrend. The neckline support, around 121.01, is a critical level to watch. A break below this level, as observed, typically confirms the completion of the head and shoulders pattern, indicating a possible shift in market sentiment.
On the weekly chart, MU shows a broader perspective of its price movements, highlighting the importance of the 21-week EMA, which coincides with the neckline seen on the daily chart, making the $120 a double support area. However, the recent price action suggests a test of this support. If the price sustains below this level, it could signify a more extended correction or potential trend change.
If MU misses this support level, then it could seek the next support, which is around 105.72. Therefore, if we were to see a bullish reaction, the timing is perfect. For now, there isn’t any bottom signal here.
Overall, the interaction between these patterns and key support levels suggests that MU is at a pivotal point. The completion of the head and shoulders pattern on the daily chart aligns with the test of the 21-week EMA on the weekly chart, emphasizing the importance of these levels in determining the next phase of MU's price action.
For more detailed technical analyses and insights like this, be sure to follow my account. Your support helps me continue providing valuable content to help you make informed trading decisions.
Remember, real trading is reactive, not predictive, so let's stay focused on the key points described above and only trade when there is confirmation.
“To anticipate the market is to gamble. To be patient and react only when the market gives the signal is to speculate.” — Jesse Lauriston Livermore
All the best,
Nathan.

MUmu has received a weekly purchase request, taking into account not breaking the expected target area, area 130

MU Bear Flag Before Earnings MU has a nice bear flag here going into earnings. It's been a strong name and it exploded after the last earnings. I see a bearish pattern, but that's not always useful when it comes to earnings. Important to watch moving forward.

Come on Micron!! MU Daily Trading Analysis. MU – Fridays close erased all of Wednesday’s gains ending the day down 3.82% (-1 ATR) with the most volume of the week. With 1M in premium on 6/12 132C, 133C & 135C I will look to take longs if 131 can hold.
*This is my opinion and is not financial advice. Please use due diligence before placing any trades*

MU - Two scenarios here MU bouncing on 50MA and anchored VWAP from the last wave.
Bounce here can be a possibility with upside target of 150.
Target 1 - 150
Stop loss - 120
We’ll revisit this later.

Micron Pulls BackMicron Technology has rallied as AI fuels demand for high-bandwidth memory, and some traders may see opportunities in its latest pullback.
The first pattern on today’s chart is the breakout to record highs on March 21 after results beat estimates. MU continued higher over the next three months before stalling and retracing half the rally. That could suggest its uptrend remains in effect.
Second, the chip stock bounced on Tuesday after forming a hammer candlestick on Monday. That may suggest its recent pullback is ending.
Third, the current price zone is near the highs from early April. Will old resistance become new support?
Next, the most recent slide could be viewed as an A-B-C correction pattern.
Fifth, MU is near its rising 50-day simple moving average. That may reflect a bullish intermediate-term trend.
Finally, stochastics have reached an oversold condition.
TradeStation has, for decades, advanced the trading industry, providing access to stocks, options and futures. See our Overview for more.
Past performance, whether actual or indicated by historical tests of strategies, is no guarantee of future performance or success. There is a possibility that you may sustain a loss equal to or greater than your entire investment regardless of which asset class you trade (equities, options or futures); therefore, you should not invest or risk money that you cannot afford to lose. Online trading is not suitable for all investors. View the document titled Characteristics and Risks of Standardized Options at www.TradeStation.com . Before trading any asset class, customers must read the relevant risk disclosure statements on www.TradeStation.com . System access and trade placement and execution may be delayed or fail due to market volatility and volume, quote delays, system and software errors, Internet traffic, outages and other factors.
Securities and futures trading is offered to self-directed customers by TradeStation Securities, Inc., a broker-dealer registered with the Securities and Exchange Commission and a futures commission merchant licensed with the Commodity Futures Trading Commission). TradeStation Securities is a member of the Financial Industry Regulatory Authority, the National Futures Association, and a number of exchanges.
TradeStation Securities, Inc. and TradeStation Technologies, Inc. are each wholly owned subsidiaries of TradeStation Group, Inc., both operating, and providing products and services, under the TradeStation brand and trademark. When applying for, or purchasing, accounts, subscriptions, products and services, it is important that you know which company you will be dealing with. Visit www.TradeStation.com for further important information explaining what this means.

MICRON GOING TO CONTINUE MARK UP
Continuing from my previous analysis of Micron (Refer to the link below)
i noticed the spring which formed @ 31/5/2024
Spring in an uptrend, is a very strong indicator in wyckoff methode
Plus, the depth of penetration was just a 'fine penetration' in which exactly suit the characteristic of A Genuine Spring
With that informations, i added position @ $128 today
Pure Wyckoff
