PLTR | Neutral-to-Short | Overvaluation | (May 2025)PLTR | Neutral-to-Short | Overvaluation + Hype Exhaustion Risk | (May 2025)
1️⃣ Short Insight Summary:
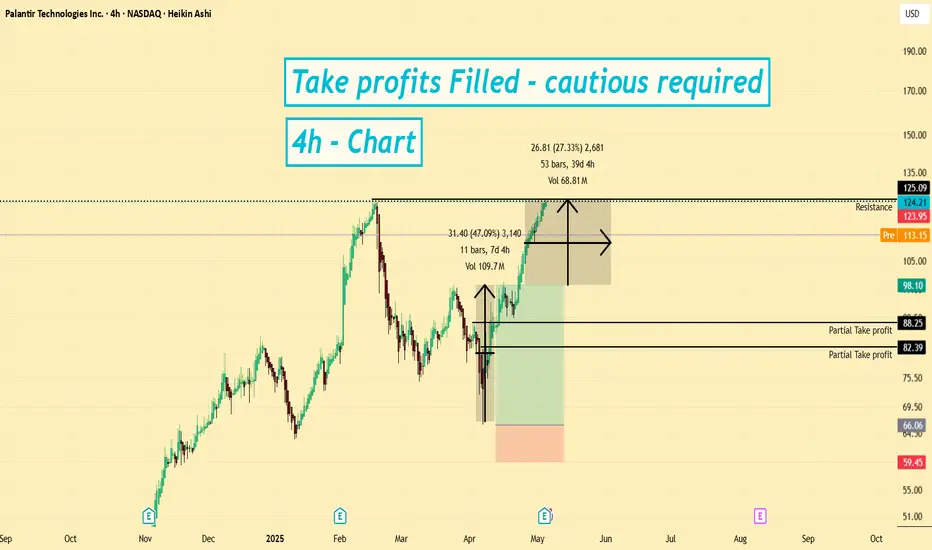
Palantir has been riding the AI hype wave, but valuations are extremely stretched. Despite strong growth, price action shows signs of slowing — making this a "watch closely" rather than "chase blindly" setup.
2️⃣ Trade Parameters:
Bias: Watching for short setup — not entering yet
Entry Zone: If price retests $19–20 and stalls again
Stop Loss: Above $121.50 (breakout continuation risk)
TP1 (potential short): $117.00 — minor structure support
TP2: $15.50 — deeper pullback zone
TP3 (optional): $113.90 — if broader correction plays out
3️⃣ Key Notes:
✅ Fundamentals at a Glance:
Revenue: $2.87B | Net Income: ~$460M
Market Cap: $291B (!) — over 10x revenue, signals extreme overvaluation
P/S Ratio: 19x
Price to Cash Flow: 272x — typical range for healthy companies is 20–40
EPS and Book Value: Weak vs market cap (Tangible BV: $2.13)
Beta: 2.45 — very volatile
✅ Business Model:
Palantir builds AI-driven software for government and commercial use. Notably, government revenue and commercial segments both grew ~40% YoY — great performance, but possibly priced in already.
❌ Current Market Behavior:
Everyone's talking about PLTR — hype levels are extremely high
Price currently sitting near previous all-time highs
Technicals show signs of exhaustion — money is slightly flowing out on 30min charts
Daily chart still bullish, but 4H shows price stalling — a correction seems likely
A dip to ~$19 or lower (4–5% pullback) would be normal, even healthy
❌ Short Setup Caution:
Although the chart leans bearish short term, this is a hype-driven stock. Fighting it blindly with a short could be risky. If a correction does set in, it's more likely to be a measured move rather than a full trend reversal — for now.
4️⃣ Follow-up Note:
I’ll be watching for a short opportunity if rejection confirms near $20–21. No position for now — observing price behavior closely as hype may still carry it higher in the short term.
Please LIKE 👍, FOLLOW ✅, SHARE 🙌 and COMMENT ✍ if you enjoy this idea! Also share your ideas and charts in the comments section below! This is best way to keep it relevant, support us, keep the content here free and allow the idea to reach as many people as possible.
Disclaimer: This is not financial advice. Always conduct your own research. This content may include enhancements made using AI.
PLTR trade ideas
Down to 70$ ?The quarterly report just above expectations
P/E ratio over 600
The double top on the chart
The spending cuts by the US government, which is the main client
All the ingredients are there for a significant decline that could go down to the blue support where the 200-day SMA (blue line) will be located, around $70.

Pltr $151 🧠 Palantir Bull Thesis: $136–$150 Short-Term Target (Post-Earnings)
Price Target Range:
Base Target: $136
Stretch Target: $150 (if momentum breakout + macro align)
Catalyst 1: AI/Defense Earnings Blowout
Expected EPS: $0.13 → if actual EPS surprises (e.g., $0.15+), it signals significant operating leverage from AI/Foundry.
Recent Government Deals: NATO, U.S. military, and foreign defense contracts bolster revenue visibility.
Commercial Growth Spike: Analysts expect over 60% YoY growth in commercial sector revenue — if confirmed, valuation multiple expansion becomes justified.
Catalyst 2:
Cup & Handle breakout formed over the last 6 weeks
Break above $124 (previous high) triggers bullish continuation
RSI is resetting from mid-60s — giving room for a momentum ignition
Golden cross: 50EMA crossing above 200EMA last week
📊 If earnings gap the stock above $128, short-covering + AI momentum chase can push a rapid breakout to $136–$150.
Catalyst 3: Options Flow + IV Crush Setup
Implied Volatility > 95% pre-earnings → massive call open interest buildup at $130–$150
Call/Put ratio above 2.3 (bullish skew)
If IV collapses post-earnings and the move is directional, market makers will need to hedge deep OTM calls → gamma squeeze potential
Catalyst 4: Sentiment + Social/Institutional Attention
Palantir trending on Reddit, Twitter, and TikTok
Citadel and BlackRock increased positions in Q1
High institutional ownership (~40%) with increasing fund inflows into AI/Defense names
Quantum Forecast & AI Narrative Momentum
AI stocks (NVDA, SMCI) have led market-wide rallies
Palantir being seen as the “AI software layer for government + enterprise”
CEO Alex Karp has already hinted at "transformational government contracts" and new AI modules — this creates anticipation buying even before guidance is raised
Risk-Reward Snapshot
Case Price Range Probability
Base Bull Case $136 55%
Stretch Case (Gamma Squeeze + Beat + Upgraded Guidance) $150+ 30%
Neutral Post-Earnings Drift $118–124 15%
Risk Factors:
Market-wide risk-off event (Fed, macro surprise)
AI rotation cools off
EPS beats but guidance disappoints
IV crush limits upside unless price gaps violently
If Palantir beats EPS by >15%, raises guidance, and gaps over $128 post-earnings, a momentum/gamma squeeze could push it toward $136–$150, fueled by AI mania, defense exposure, and short positioning.
Want a matching chart or visual post for this thesis?
as always safe Trades

into the close May 5Some possible Bearish implications, but still the bias is up and another move higher can occur into tomorrow.

TD 9 Sell Setup almost cooked High of today's candle gonna be a setup trendline for current sequence. Doesn't guarantee price drop but at least it may end up with 1-4 candle correction. As I post before I've already took some short position last Friday.

$PLTR Possible bullish setup targeting 102 and 112 by earning!High volume with green candles, RSI breakout, still facing strong resistance at 94-95 , if breakout then targets are 102 and 112 before coming earning report. stop loss at 76 . Good luck!

Good PalantirianNoticed recently there is very few NASDAQ:PLTR stock for sale on the market. As a good and kind trader I decide to borrow ad sell couple of NASDAQ:PLTR like a good move to provide liquidity to the market and help other traders to obtain so passionately desired Palantir stock.
Dear Palatirians pls don't get me wrong. I'm not betraying our faith, just need to step back for a while

SHORT AGAIN 100 95run it back they still dont make enough money for this valuation risky short yet again. grabbed may 23 100 90P

White ripster chart ideas copy chart settins publicshWhite ripster chart ideas copy chart settins publicsh public share

$PLTR Update: New Long Entry at $82 in a Strong Uptrend!Palantir Technologies Inc. ( NASDAQ:PLTR ) continues its “Strong Uptrend” on a 1-week chart. 📈 We bought at $21.84 and sold at $121.81 previously. Now at $114.65, we’ve entered a new long position at $82. The Trend Score is 8/8, but a short-term projected price of $123.2 ( -9.1% ) and bearish MACD suggest a potential pullback.
How to Trade This Setup:
• Monitor the Trend: The uptrend is strong with high volume, but bearish signals indicate caution—watch for momentum shifts.
• Set Targets: Resistance 1 at $137.66 is a target; Support 1 at $75.65 is key if a pullback happens.
• Adjust Risk: With bearish MACD, consider tightening stops or taking partial profits from $82.
What’s your next move on NASDAQ:PLTR ? Let’s discuss in the comments! 💡 #Trading #PLTR #Analysis

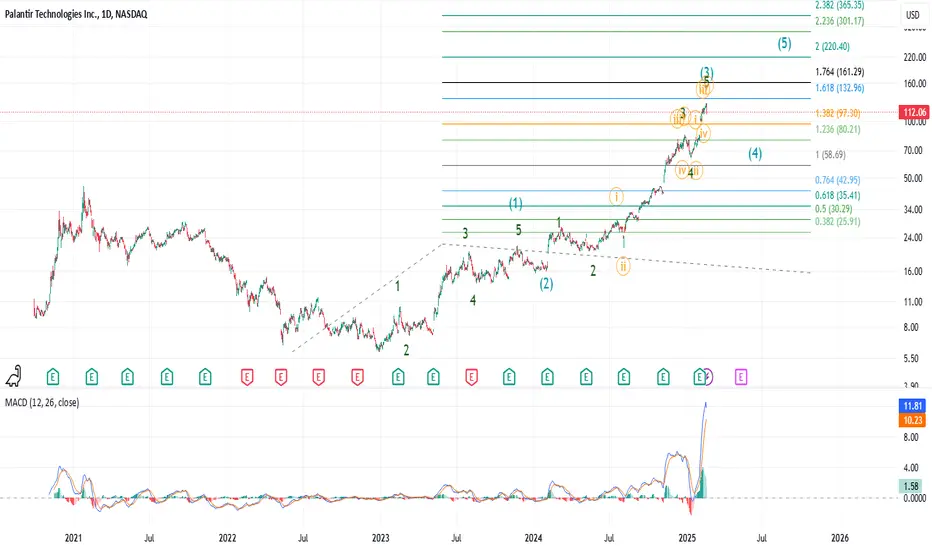
PalantirPalantir has continued to push higher, but if you look at MACD, it is running into resistance. Also, it is within the white target box for an impulsive wave, and has officially hit the yellow 1.0 if it is to be an abc pattern for the (a) of minor B. Due to the impulsive looking structure it seems to be turning into, and the duration/level of this move higher, I am officially making the bullish count my primary. That being said, the yellow count can still play out, but given the current price action and time duration, I find the white count most plausible.
We're due for a consolidation lower regardless of what count comes to fruition. Both patterns point to an abc move next to the $80 area if it is to be standard. The part that comes after that is what will answer the question of which count is correct. Once we get that move lower, if it is in the form of an abc, I will try to enter into a long position around the 0.618 retracement fib. That will be the least risky place to enter.
If the white count is what is playing out, then a minor wave 3 will come after the consolidation lower. If the yellow count is to play out, then it will be a minor C wave that takes us to the $120's. Either way you look at it, I am forecasting price to move significantly higher after our next move lower.
Let me know if any questions linger. I have added an orange label above the white box to signify we can still very easily get another high for minor wave 1. Once we do have a top in, I will add some retracement fibs to track the move lower.

back to 100 if it doesn't break resistence Good catalyst, but needs to break the high; looking for a reversal at 115.

$PLTR - breaking out above $110PLTR - Stock breaking out above $100 resistance level approaching $110 resistance. above $110 we can see $125 which is around all time highs. Stock is strong and set to report early next month. looking for pre earnings run.

PLTR eyes on $109.xx: Possible End of bounce wave to Dip next?PLTR coming back strong after the tariff tantrum.
Now approaching a key resistance at $108.52-109.02.
Elliott Waves also point to a completed 5-wave structure.
Looking for a dip here, to either $103 or $96, will post updates.

$PLTR momentum is heating up - ATH's INBOUND!🔥 NASDAQ:PLTR momentum is heating up!
All-time highs on the horizon! 🎯
✅ Indicators curling bullish
✅ Volume Shelf ready to launch 🚀
✅ Wr% pendulum swinging in favor
Big move incoming—are you in? 👀
Not Financial Advice

Potential Breakout in PalantirPalantir Technologies has been consolidating as the broader market struggled, and some traders may look for its uptrend to continue.
The first pattern on today’s chart is the February 24 high of $99.01. PLTR peaked near that level in late March and again last week. However the stock cleared the resistance yesterday, which may signal a breakout.
Second, prices consolidated at the 50-day simple moving average but have now escaped from it. Is the intermediate-term trend getting more bullish?
Third, the 8-day exponential moving average (EMA) is above the 21-day EMA. MACD is also rising. Those patterns may reflect bullish short-term momentum.
Finally, the software company is a highly active underlier in the options market, averaging more than 700,000 contracts per session in the last month. (It ranks in the top five of the S&P 500, according to TradeStation data.) That could help traders take positions with calls and puts.
TradeStation has, for decades, advanced the trading industry, providing access to stocks, options and futures. If you're born to trade, we could be for you. See our Overview for more.
Past performance, whether actual or indicated by historical tests of strategies, is no guarantee of future performance or success. There is a possibility that you may sustain a loss equal to or greater than your entire investment regardless of which asset class you trade (equities, options or futures); therefore, you should not invest or risk money that you cannot afford to lose. Online trading is not suitable for all investors. View the document titled Characteristics and Risks of Standardized Options at www.TradeStation.com . Before trading any asset class, customers must read the relevant risk disclosure statements on www.TradeStation.com . System access and trade placement and execution may be delayed or fail due to market volatility and volume, quote delays, system and software errors, Internet traffic, outages and other factors.
Securities and futures trading is offered to self-directed customers by TradeStation Securities, Inc., a broker-dealer registered with the Securities and Exchange Commission and a futures commission merchant licensed with the Commodity Futures Trading Commission). TradeStation Securities is a member of the Financial Industry Regulatory Authority, the National Futures Association, and a number of exchanges.
Options trading is not suitable for all investors. Your TradeStation Securities’ account application to trade options will be considered and approved or disapproved based on all relevant factors, including your trading experience. See www.TradeStation.com . Visit www.TradeStation.com for full details on the costs and fees associated with options.
Margin trading involves risks, and it is important that you fully understand those risks before trading on margin. The Margin Disclosure Statement outlines many of those risks, including that you can lose more funds than you deposit in your margin account; your brokerage firm can force the sale of securities in your account; your brokerage firm can sell your securities without contacting you; and you are not entitled to an extension of time on a margin call. Review the Margin Disclosure Statement at www.TradeStation.com .
TradeStation Securities, Inc. and TradeStation Technologies, Inc. are each wholly owned subsidiaries of TradeStation Group, Inc., both operating, and providing products and services, under the TradeStation brand and trademark. When applying for, or purchasing, accounts, subscriptions, products and services, it is important that you know which company you will be dealing with. Visit www.TradeStation.com for further important information explaining what this means.

$PLTR Trade: Buy $90.86 , Target $101.35Beep Beep. Hope everyone is taking care of their trading accounts during this volatile phase in the markets. I noticed an identical setup on the weekly from back in August 24' and I'm looking to take advantage. We have a trend reversal on the Tom Demark sequential that helps identify trend exhaustion through a 9 Count. Currently on a 2 Count, we're testing the gap while simultaneously testing the 10WMA at 90.86.There is also a weekly gap at 101.35 ... Entry would be the 10WMA. Target the weekly Gap. Trade is as follows:
Trade Idea - Swing NASDAQ:PLTR $95 Calls 4/25
Entry - 10 WMA @ $90.86
Target - Gap on Weekly at $101.35

$PLTR 50%+ decline ahead, $39-56 targetNASDAQ:PLTR looks like it's topping here and that it has a long road to the bottom.
If we continue to reject at this resistance, then it's likely that we'll at least see the $56 target on the downside, but I think the $44 target is the most likely area to see a bounce.
Bulls should enjoy a 50%+ drop from here. You've been warned.


PLTR: Won't be surprised by a 30-40% dipPLTR has been on a rip, but not without periodical 20-30% dips along the way. The way MACD is extended, it will not be surprising to see a somewhat meaningful pullback to start the wave 4 correction. Wave 2 was around 30% and lasted around a couple of months. Wave 4 can be quick and deep or can be a triangle that will take some time to resolve. Either way, I will be looking for $100 - $80 for support.
PLTR: Is the fifth wave underway?If we see a higher high on PLTR above today's high at $98.29, then this might confirm wave 1 of 5 of Intermediate wave 5. Some bullish divergences should propel price a bit higher to confirm the price action. Wave 2 should create an inverted head and shoulder look as a classic pattern. PLTR creates strong wave 3 price action and shallower wave 5. So, I will be expecting wave 5 to make it to at least 1.764 fib extension of Intermediate waves 1 and 2, which takes things to around $160. Depending on how far wave 2 goes, we can set some targets at a later time. I am off loading my positions from $75. Hoping to rid of everything close to $100. Will be reloading during the wave 2 retracement for the final push up. If by any chance Intermediate wave 4 extends, then things might get a bit complicated. Not getting another higher high now and correction back down to $86 would be a very good indication of that. Until then will be playing one leg at a time...

PLTR Setting Up for Breakout? Here's What the Options and Structure Say 🔍
Options GEX Analysis :
PLTR is pushing into the upper gamma territory with strong CALL-dominant GEX. The highest positive NETGEX aligns with the $100-$101 zone, marking it as a likely magnet if momentum continues. IVR is high at 72.3, and calls are outpacing puts at 35.7%, signaling a market leaning bullishly in sentiment.
* Gamma Wall (Resistance): $100 – $105
* Support Zone: $90 (HVL), reinforced by light put walls below
* Bias: Bullish continuation
* Option Strategy:
Consider bullish debit spreads (e.g., Buy 97.5C / Sell 102.5C) targeting breakout extension into the 100–102.5 zone. Risk-defined and well-aligned with GEX magnet levels.
Technical Trade Plan :
PLTR just printed a clear CHoCH with bullish follow-through, riding on SMC bias across all timeframes. Volume is growing, price is trending cleanly with bullish structure, and strength meter shows 4/5 bullish.
* Entry Bias: Break and hold above 95.5 = valid continuation setup
* Target 1: 102.72
* Target 2: 107.58
* Stop: 93
* Trade Suggestion:
If PLTR holds above 95.52, ride the momentum. Await minor retest for safer entry. Trail stops aggressively once 100 is in sight — expect a reaction at that GEX wall.
My Thoughts:
PLTR is showing one of the cleaner setups into this week. The bullish GEX structure gives it room to squeeze, and the SMC breakout confirms directional intent. What I love here is the synergy — the chart structure (CHoCH → BOS) lines up with the gamma roadmap. The risk is well-contained below 93, with room for a $10 move above current levels. I personally like using vertical debit spreads here due to the IV and defined risk setup.
Disclaimer: This analysis is for educational purposes only and does not constitute financial advice. Always do your own research and trade responsibly.

Palantir Added 40%+ Since April 7. What Does Its Chart Say?Counter-terrorism-software giant Palantir Technologies NASDAQ:PLTR rose more than 500% between April 2024 and its February 2025 peak, sank some 47% from there to its April low, then rebounded 47% intraday between April 7 and April 16. What does technical and fundamental analysis say could happen next?
Let’s take a look:
Palantir’s Fundamental Analysis
PLTR rose sharply last Monday and Tuesday (April 14-15) after the U.S.-helmed NATO military alliance disclosed that it has finalized a deal to buy Palantir’s Maven Smart System.
NATO officials said the contract marked a significant advancement in modernizing the alliance’s warfighting capabilities.
Ludwig Decamps, general manager of the NATO Communications and Information Agency, said he sees the deal as “providing customized, state-of-the-art AI capabilities to the Alliance and empowering our forces with the tools required on the modern battlefield to operate effectively and decisively.”
NATO expects to employ the new technology within 30 days, adding that the procurement process took just six months from defining the requirement to full adoption.
NATO Chief of Staff General Markus Laubenthal said the new system “enables the alliance to leverage complex data, accelerate decision-making and by doing so, adds a true operational value."
Meanwhile, Palantir expects to release first-quarter earnings on or about May 6.
The Street is looking for $0.07 in GAAP earnings per share and $0.13 in adjusted EPS on some $874 million of revenues.
That would represent more than 36% in year-over-year revenue growth and a 62.5% increase in adjusted EPS when compared to the $0.08 that PLTR reported in the same quarter last year. (Management has most recently guided Q1 revenues to an $860 million midpoint.)
A 62.5% year-over-year revenue gain would represent the fifth straight quarter of acceleration in y/y sales growth when compared to the 19.6%, 20.8%, 27.2% and 30% gains Palantir has seen over the past four quarters.
In fact, all 11 sell-side analysts that I found that cover the stock have increased their earnings estimates for Palantir since the current quarter began.
Palantir’s Fundamental Analysis
Next, let’s look at PLTR’s chart going back some three months:
Readers will see that PLTR broke out of a so-called “Falling Wedge” pattern of bullish reversal last week on April 9 (as denoted by the red box in the chart above).
That occurred on the day when President Donald Trump announced a 90-day pause on some of his tariffs, sending stocks soaring. PLTR gained 19% that day.
The stock also took back its 21-day Exponential Moving Average (or “EMA,” marked with a green line) on April 9. That probably brought at least some swing traders on board.
However, Palantir initially failed to break its 50-day Simple Moving Average (or “SMA,” denoted by a blue line). Still, the stock managed to take that 50-day SMA last Monday (April 14).
Taking the 50-day SMA was critical technically speaking, as it would have likely forced portfolio managers to increase their Palantir long exposure. The 50-day line then acted as support for PLTR for the next few sessions.
Separately, Palantir’s Relative Strength Index (the gray line at the chart’s top) has remained stronger than "neutral" since the stock’s big April 9 run-up.
Meanwhile, the stock’s daily Moving Average Convergence Divergence indicator (or “MACD,” marked with gold and black lines and blue bars at the chart’s bottom), is now very close to bullish.
Within that MACD, the 9-day EMA (marked with blue bars) has moved back above the zero-bound, while the 12-day EMA (the black line) has crossed above the 26-day EMA (the gold line). Only the 26-day EMA is still in negative territory.
If all three components move above the zero-bound and the 12-day line stays above the 26-day line, that would be historically positive from a technical perspective.
(Moomoo Technologies Inc. Markets Commentator Stephen “Sarge” Guilfoyle was long PLTR at the time of writing this column.)
This article discusses technical analysis, other approaches, including fundamental analysis, may offer very different views. The examples provided are for illustrative purposes only and are not intended to be reflective of the results you can expect to achieve. Specific security charts used are for illustrative purposes only and are not a recommendation, offer to sell, or a solicitation of an offer to buy any security. Past investment performance does not indicate or guarantee future success. Returns will vary, and all investments carry risks, including loss of principal. This content is also not a research report and is not intended to serve as the basis for any investment decision. The information contained in this article does not purport to be a complete description of the securities, markets, or developments referred to in this material. Moomoo and its affiliates make no representation or warranty as to the article's adequacy, completeness, accuracy or timeliness for any particular purpose of the above content. Furthermore, there is no guarantee that any statements, estimates, price targets, opinions or forecasts provided herein will prove to be correct.
Moomoo is a financial information and trading app offered by Moomoo Technologies Inc. In the U.S., investment products and services on Moomoo are offered by Moomoo Financial Inc., Member FINRA/SIPC.
TradingView is an independent third party not affiliated with Moomoo Financial Inc., Moomoo Technologies Inc., or its affiliates. Moomoo Financial Inc. and its affiliates do not endorse, represent or warrant the completeness and accuracy of the data and information available on the TradingView platform and are not responsible for any services provided by the third-party platform.
