$QQQ Dang that's a pretty chartLook at that chart. Lots going on!! Right at resistance. I just got done recording these levels and I'm excited to see if that resistance holds. I'm bearish here but I'm going to wait until we get the week moving before deciding which short strike - Today's Trading Ranges coming soon...
QQQ trade ideas

QQQ Approaching Key Resistance! Will It Break Through?Technical Analysis for QQQ
* Current Trend: QQQ is forming a descending wedge and consolidating near resistance around $527. The price has been respecting both lower highs and higher lows, indicating potential compression for a breakout or breakdown.
* MACD: Shows mild bullish momentum but a potential for reversal if a breakout fails.
* Stochastic RSI: Currently in overbought territory, signaling possible short-term cooling or retracement.
Key Levels to Watch
* Resistance: $527 (current resistance and highest positive GEX call wall), $530 (next resistance level).
* Support: $513 (HVL level), $500 (PUT support wall).
Gamma Exposure (GEX) Insights
* Highest Positive GEX: $527. This is the significant resistance where large call option interests may act as a barrier.
* PUT Support: $500, showing strong hedging interest below this level.
* IVR/IVX: IVR is 14.9, indicating low implied volatility relative to its historical range. This suggests lower premiums and less aggressive movement expected in the near term.
Option Strategy
* Bullish:
* Consider 527C (Calls) expiring 1/26 if price breaks above $527 and holds.
* Target: $530, Stop Loss: Below $524.
* Bearish:
* Consider 525P (Puts) expiring 1/26 if the price rejects $527.
* Target: $513, Stop Loss: Above $528.
Scenarios for Tomorrow
1. Breakout: If QQQ breaks above $527 and sustains, expect a test of $530 and potentially $532 in the short term.
2. Rejection: A failure at $527 may lead to a pullback to $513 and further downside toward $500.
Conclusion
QQQ is at a pivotal resistance zone with potential for a strong move either way. Keep an eye on $527 and monitor the reaction to decide the next steps.
Disclaimer: This analysis is for educational purposes only and does not constitute financial advice. Always perform your own research and trade responsibly.

QQQ, Nasdaq 100 expected bullish till end MarchBased on EW count, Vix, volume profile, support lines QQQ is expected to continue the bullish trend till end March. Two possible corrections may then play out as seen.

QQQ: Bearish Continuation & Short Trade
QQQ
- Classic bearish setup
- Our team expects bearish continuation
SUGGESTED TRADE:
Swing Trade
Short QQQ
Entry Point - 521.74
Stop Loss - 526.52
Take Profit - 512.96
Our Risk - 1%
Start protection of your profits from lower levels
❤️ Please, support our work with like & comment! ❤️

QQQ ChannelQQQ reacting nicely to the Channel.
I'm short term bearish on this. I think it needs a 2%-3% pullback before it breaks out for good.
Since the 1.618 fib is right there, and the wick for Friday's (1/17/2025) candle was rather bullish, I could see a fake breakout to the fib and then break back down into the channel.
I also have a long position set up just incase this breaks out and keeps running.
KEY:
-White Horizonal Lines: Previous High/Low, regardless of timeframe.
-Green Horizontal Lines: 1.618 fib level.
-Blue trendline: Trendline.

Market Update - 1/18/2025• bulls are back
• my breadth indicator finally showed a buy signal on Friday, indexes have retaken key moving averages after a month of consolidation
• seems like a healthy correction and we have all the reasons to have another leg higher
• would note that I'm still minimally invested and have only 2 positions, keeping size small, until I see more traction
• in general, there are still not that many great setups I like to buy, so that's another sign for being cautious

Bullflag QQQsimple market analysis - bullflag formation above 503 (breakout)
probably consolodation/trading range between 520-510, wait for the bullflag breakout for new all time high.

QQQ Buyers In Panic! SELL!
My dear subscribers,
This is my opinion on the QQQ next move:
The instrument tests an important psychological level 521.74
Bias - Bearish
Technical Indicators: Supper Trend gives a precise Bearish signal, while Pivot Point HL predicts price changes and potential reversals in the market.
Target - 513.22
About Used Indicators:
On the subsequent day, trading above the pivot point is thought to indicate ongoing bullish sentiment, while trading below the pivot point indicates bearish sentiment.
———————————
WISH YOU ALL LUCK

QQQ/SPY - Which way will it break?For the last 4 years (2020-2024), we have been in a narrow band where--generally speaking--SPY and QQQ have performed comparably. 2022 is the notable exception, where inflation increased rapidly and QQQ underperformed SPY.
For the prior 12 years before that (2008-2020), QQQ outperformed SPY handedly. Inflation was low. Interest rates were held at ~0%.
When you overlap the last 16 year channel with the last 4 years horizontal band it becomes clear that one (or both!) of these trends will break down.
Option 1: Inflation is under control, and the last 16 year channel is sustained. 4-year trend breaks.
Option 2: Inflation remains in limbo, and we stay in the new 2-year horizontal channel; 16-year trend breaks.
Option 3: Inflation is rampant, and QQQ underperforms SPY. Both trends broken.
What's it going to be?

$QQQ Tomorrow's Trading RangeNo words tonight - just the chart for tomorrow. 50DMA cutting right across the trading range here

QQQ Approaching Critical Levels! Trade Setups to Watch Analysis:
QQQ has been trending downward within a descending channel, currently trading near the $512-$513 level. This range aligns with key GEX resistance and put support, indicating a balance between buyers and sellers. The MACD is bearish, showing downward momentum, while the Stochastic RSI suggests the potential for a relief bounce as it approaches oversold conditions.
Volume indicates indecision, with sellers maintaining control but showing some hesitation near the $510-$513 zone.
Key Levels to Watch:
* Resistance Levels:
* $516-$518: Immediate resistance, aligning with GEX call walls.
* $520-$522: Critical resistance with strong gamma positioning and call walls.
* Support Levels:
* $513: First support level.
* $511-$512: Key support with significant negative GEX positioning.
* $508: Extended downside support within the channel.
GEX Insights:
* Gamma Exposure (GEX):
* Positive GEX peaks near $520-$522, indicating strong overhead resistance.
* Negative GEX at $511-$512 provides a key support zone but signals potential volatility if breached.
* Options Activity:
* IVR: Low at 16.2, suggesting reduced implied volatility.
* Put/Call Bias: Puts dominate at 25.1%, showing bearish sentiment.
Trade Scenarios:
Bullish Scenario:
* Entry: Break above $516 with volume confirmation.
* Target: $520 (first target), $522 (extended target).
* Stop-Loss: Below $513.
Bearish Scenario:
* Entry: Break below $511 with increasing selling pressure.
* Target: $508 (first target), $505 (extended target).
* Stop-Loss: Above $514.
Directional Bias:
The bias is cautiously bearish as QQQ continues to trade within the descending channel. However, a break above $516 could signal a short-term relief rally.
Actionable Suggestions:
* For Scalpers: Focus on the $511-$516 range for quick trades in either direction.
* For Swing Traders: Monitor key levels around $508-$522 for breakout or breakdown opportunities.
Disclaimer: This analysis is for educational purposes only and does not constitute financial advice. Always do your own research and manage your risk before trading.
QQQ ending wave 4 wave 5 561.8to 563 max min 553I am now in a 100 % to 110 % long calls position We are only a few hours away from the start of the final 5th wave to mark the HIGH for the YEAR 2025 .I am now working on the spiral date and I am looking for a 3.5 to 6 week rally from this Low Best of trades WAVETIMER

Change in market theme. Bullish Variables in Favor:
+2 rate cuts probabilities now above the 0 rate cuts. 3 rate cuts 100% increase. Reversal in trend from Jan 13
+TLT has breakout the downtrend coming from DEC, correlated too with the US10Y failing to break 2024 Highs.
+PPI lower than expected 0.2 vs 0.4 m/m
+CPI 2.9 as expected / Core lower 0.2 vs 0.3
+Risk On Assets Turning, Total2 ( Crypto marketcap excludingBTC) is up 15% from Jan 13
+Risky sectors outperfoming ARKK.
+Vix -30% from Jan 13
+DT possesion on Monday 20
Techinal variables:
+ Failed breakdonw in market indexes levels Cat 8-9
+ RSI at 30 in the 4h plus cross of the MA, positive.
+ Squeeze momentum to the downside over, near 0
+Reclaim above of the monthly vwap on QQQ-SPY
Still in look:
+Downtrendline coming from DEC ATH, Market testing now
+Retail sales tomorrow
In my case because I'm long from yesterday it will be easier to hold into tomorrow, but for a position opened today I'm less sure. Because of the retail sales and the trendline, can be normal to have a pullback, and pick momentum on friday into monday.

Possibly Breaking out of down trendI see a somewhat double rejection at 500-501 on the Daily. Right now, we are hovering around the Upside of this trend Channel & resistance level 516. I’m looking for a buy up to 519 then a reversal To 516 for double bottom to Break out of the trend we’ve been in. If we fail to a double bottom at 516 And Sell through 516 we remain in a Weekly down trend for . 519 is the level to get on the other side of. Also keep in mind Donald Trump will be inaugurated on Monday. I think this will affect the markets volatility. We May see Strong buys.

The chart I am posting is The road map for QQQ The chart I am posting is that of the QQQ and what should be the pattern if We are going to see a Final 5th wave to 561 plus or minus 2 . I called for a major turn 11/29 to 12/5 from this we should see a panic or a corrective wave structure I have a grouping of 6 spiral turn from jan 19 to the 25th .I have sold All my longs as we hit price targets for the first leg up and to form the ABC rally .What next possible pattern is abc up for wave 1 or A we should see now a pullback in an abc decline back to 50 % from this we should see wave C up in the form of 12345 a 5 waves rally and break Above the down trend line as Most everyone will then get on board . The MATH projection IF and I say IF the turn of 11/29 to 12/5 was just the top of wave 3 of 5 then we will see the HIGH for 2025 at 561 plus or minus 2 I have dates of FEB 14 and march 13th As MAJOR turns based on the fib cycles and Spirals . You should wait to see conformation . in the pullback before buying longs again . BEST OF TRADES WAVETIMER

QQQ Tests Resistance! Where will it head to?Technical Analysis Overview:
4-Hour Chart:
* Trend: QQQ is in a short-term recovery, testing resistance at $506 within a broader downtrend.
* Indicators:
* MACD: Bullish momentum is building, with a positive histogram.
* Stochastic RSI: Overbought at 67, suggesting potential short-term consolidation.
30-Minute Chart:
* Price Action:
* QQQ is consolidating near $505-$506, facing resistance at $508.
* Support at $503 is holding firmly, aligning with the highest negative NETGEX.
* Volume: Slightly increasing on the recovery, signaling cautious bullish participation.
Key Levels to Watch:
Support Levels:
* $503: Immediate support, aligning with HVL and gamma support.
* $500: Strong support zone, coinciding with GEX10.
* $498: Critical support near the 3rd PUT Wall.
Resistance Levels:
* $506: Immediate resistance zone, aligning with CALL resistance.
* $508: Key resistance, aligning with the 2nd CALL Wall.
* $527: Major resistance level, coinciding with prior highs.
GEX Insights:
Key Gamma Levels:
* Positive Gamma Walls (Resistance):
* $506: Immediate resistance, aligning with CALL resistance.
* $508: 14.62% GEX (2nd CALL Wall).
* $527: Long-term resistance zone.
* Negative Gamma Levels (Support):
* $503: Strong support backed by the highest negative NETGEX.
* $500: Key PUT Wall support (-13.95% GEX).
* $498: Significant PUT Wall support (-14.92% GEX).
Options Metrics:
* IVR: 28.1, indicating low implied volatility.
* IVx: 24.6, below average, reflecting a calmer trading environment.
* Call/Put Bias: PUTs dominate at 31.2%, showing cautious sentiment.
Trade Scenarios:
Bullish Scenario:
* Entry: Above $506 with volume confirmation.
* Target: $508-$515.
* Stop-Loss: Below $503 to limit risk.
Bearish Scenario:
* Entry: Rejection at $506 or a breakdown below $503.
* Target: $500-$498.
* Stop-Loss: Above $508 to manage risk.
Directional Bias:
* QQQ's consolidation near $505-$506 signals a critical inflection point. A breakout above $506 could drive bullish momentum toward $508 and beyond, while a failure to clear resistance may lead to a retest of $503 or lower.
Conclusion:
QQQ is testing a pivotal resistance zone near $506. A breakout could signal further bullish continuation, while a rejection might trigger consolidation or a pullback. Traders should watch volume and price action closely for confirmation.
Disclaimer:
This analysis is for educational purposes only and does not constitute financial advice. Always conduct your research and trade responsibly.

QQQ likely pathI expect the QQQ to slow and major overheated stocks to continue to bleed for a while longer. The entire market does not need to correct for ETFs to drop. Hot stocks like TSLA, PLTR, AMD and more can easily bring us to this demand zone for a bounce. I think we have a boring few weeks with a feb/march rally.
My plan:
Continue to focus on buying value at a fair price

$QQQ Daily: Key Demand Zone Ahead of PPI DataMarkets are at a critical demand zone on the NASDAQ:QQQ daily chart as we gear up for tomorrow's PPI report. 🔻 Will overnight selling continue, or can the bulls regain control and push prices higher ahead of the data? Let’s dive into the technical setup and potential scenarios!

$QQQ 5dte viewNASDAQ:QQQ 5DTE view
Ok, so this is the 5DTE View, so for Friday’s contract. We are under the 50DMA
494 -521 is the trading range for this weeks
The 1 week 35EMA is underneath our trading range and I will go over the in one of the videos this week as to why that is important.
We are not far away from the 4hr 200MA which is a big level to watch underneath us

$QQQ Recap of Last Week - Down on the Year - New Downtrend?NASDAQ:QQQ Recap of Last Week - Down on the Year - Bigger Downtrend Starting
Wow, what a chart. Last week we opened with a gap up above the 30 minute two moving average and then we hit the down gap from December 27 and that was also the top of the downtrend line. (Redbeard arrow)
From there, we took it all the way down to the downtrend line (green arrow) So underneath the 30 min 200MA, the 1he 200, the 35EMA, under the 50DMA, filled the gap from the first week and we closed at the bottom of the days range.
And as of right now premarket looks like we're gonna break down this down trend and take it lower
What a week!! 😅
New week trading ranges coming soon

Short QQQ Next Week: Brace for Potential Decline Amidst Bearish
- Key Insights: Given the current bearish trend in QQQ, it is essential for
investors to remain cautious. Key resistance is at 511, while immediate
support resides at 503. Declines may head towards 492-488 if the downtrend
continues, suggesting a focus on these critical levels for decision-making.
Sellers currently dominate, leading to expectations of sideways movement and
testing of support.
- Price Targets:
- Next week targets:
- T1 = 500
- T2 = 495
- Stop levels:
- S1 = 511
- S2 = 515
- Recent Performance: Over the past month, QQQ has dropped approximately 6%,
indicating a broader struggle within the technology sector. The bearish
candle patterns highlight persistent weakness, and a cautious approach is
warranted as QQQ nears crucial support. The trend has seen sellers overpower
buyers consistently, reinforcing negative sentiment.
- Expert Analysis: Analysts highlight that the QQQ faces significant supply
pressure and needs to reclaim resistance at 511 to shift sentiment. The
prevailing bearish outlook posits that if sellers maintain control, further
declines to the 492-488 range are plausible. Maintaining awareness of key
moving averages for major tech companies like AMD remains essential for
directionality.
- News Impact: The market is impacted by macroeconomic conditions, particularly
the fluctuations in Treasury yields hovering around 5%, which affect equity
valuations. Concerns about technology sector health, especially with high-
profile companies struggling against key moving averages, continue to shape
sentiment and trading strategy for QQQ.

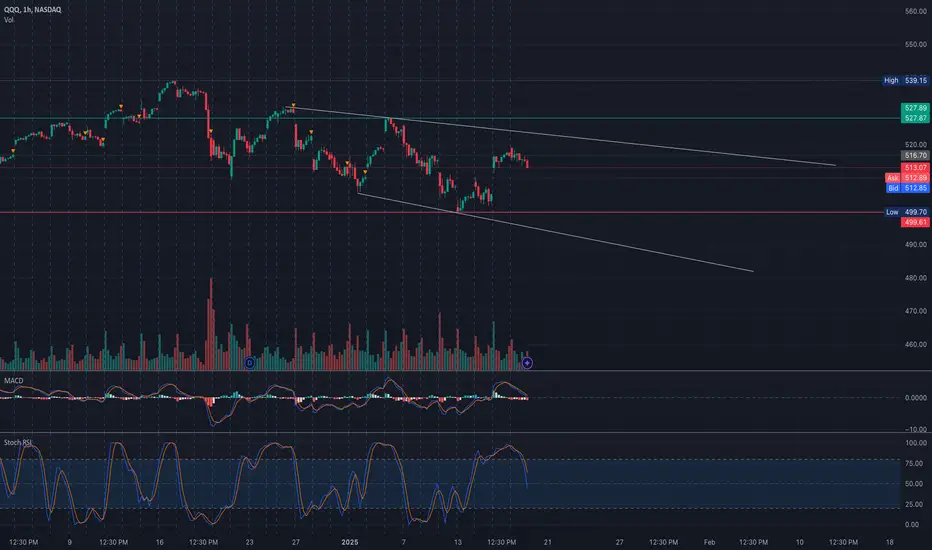
QQQ Technical Analysis and GEX Option StrategyTechnical Analysis Overview:
1. Market Context: QQQ is currently trading within a descending wedge pattern, a structure often indicative of potential breakout setups. The price is approaching the wedge's lower boundary, showing signs of decreasing volatility.
2. Key Levels:
* Support:
* $503.92 (near-term support and key GEX8 level).
* $497 (3rd PUT wall level and critical psychological area).
* Resistance:
* $515.27 to $516.91 (first resistance zone aligning with 2nd CALL wall).
* $520 to $527.87 (upper wedge boundary and CALL resistance).
3. Indicators:
* MACD: Bearish momentum with a slightly rising histogram indicates slowing downside pressure, but no clear reversal signal yet.
* Volume: Declining volume into this wedge suggests potential accumulation but requires confirmation.
4. Trade Setup:
* Bullish Scenario:
* Entry above $510 (break above wedge boundary and reclaim of key resistance).
* Target: $515 and $520.
* Stop-Loss: $503 (below recent lows).
* Bearish Scenario:
* Entry below $503.
* Target: $497 and $490 (down to the PUT walls).
* Stop-Loss: $507.
GEX Analysis for Options Trading:
1. Gamma Exposure (GEX):
* Positive gamma walls at $515 (2nd CALL wall) and $520 suggest strong resistance if prices climb.
* Negative gamma at $503 and below highlights potential acceleration to the downside if breached.
2. IVR and Sentiment:
* IVR stands at 27.2%, indicating relatively moderate implied volatility. Options traders might prefer strategies with defined risk/reward setups like vertical spreads.
3. Option Strategy Suggestions:
* Bullish:
* Call Debit Spread: Buy $515 CALL, Sell $520 CALL.
* Expiry: Choose a date with moderate time decay, e.g., 2 weeks out.
* Bearish:
* Put Debit Spread: Buy $500 PUT, Sell $495 PUT.
* Expiry: 1-2 weeks out, targeting the next gamma wall.
Market Direction Outlook:
* Based on the wedge formation, declining volume, and the position relative to gamma walls, QQQ is at a pivotal decision point. A breakout above $510 could see a bullish continuation toward $515-$520, while a breakdown below $503 would confirm bearish momentum. Traders are advised to monitor pre-market activity for any gap or sentiment shift.
Disclaimer:
This analysis is for educational purposes only and does not constitute financial advice. Please consult with your financial advisor or conduct your own research before executing trades. Always ensure proper risk management in your trading strategy.

QQQ: Will Start Growing! Here is Why:
It is essential that we apply multitimeframe technical analysis and there is no better example of why that is the case than the current QQQ chart which, if analyzed properly, clearly points in the upward direction.
❤️ Please, support our work with like & comment! ❤️
