QQQ wave 4 bottom in. Wave 5 up to begin next week.Using Elliot wave, fibs, MA support, channels and more I show what looks like a local bottom for the QQQ. I expect the exciting wave 5 to begin next week and take us into Aug/Sep time frame. Many people are saying this is hit... always happens right before a reversal. These people take it to the limit so TA could also show a bear case... but once you put everything into context to me it shows that the Bull isn't done yet... Just another breather before resuming the uptrend.
QQQ trade ideas

QQQ Short TargetI thought NQ may hold the 20k area, which it may still. The trendline from 2023 in that area is critical as well, it has broken below that as well for now.
For QQQ, it has a really bearish looking break of its uptrend, breaking all support levels I have quite easily. Getting into some sketchy territory. As of now I'm expecting a move down to at least ~$468 and it just keeps getting worse if that can't hold there either.

Long $QQQ or /NQ Futures from hereIntra day trade on NASDAQ:QQQ or /NQ futures . Long here with stop below today's low

QQQ, ICT Short Setup, small lot👋Hello Traders,
Our 🖥️ AI system detected that there is an H1 or higher timeframe ICT Short setup in
QQQ for session trade (a couple of hours)
Here is a session trade idea (since it is near support surface, we should use small lot size)
Please refer to the details Stop loss, FVG(Sell Zone),open for take profit.
For more ideas, you are welcome to visit our profile in tradingview.
Have a good day!
Please give this post a like if you like this kind of simple idea, your feedback will bring our signal to next better level, thanks for support!

07/19 QQQ ATR Levels and RangeKeeping it real quiet this morning, not going to put alot of emphasis on direction or perspective, its friday and the RNC is over, the reports are going to be lite and the day is going to be FAFO 0DTE Friday, good luck.
The ATR has increased to 6.05, but that increase is due to the downside stretch being added in form this week.

07/19 QQQ ATR and LevelsKeeping it real quiet this morning, not going to put alot of emphasis on direction or perspective, its friday and the RNC is over, the reports are going to be lite and the day is going to be FAFO 0DTE Friday, good luck.
The ATR has increased to 6.05, but that increase is due to the downside stretch being added in form this week.


QQQ - Short SwingAfter 18 months of bull run, it is time for a solid correction. In my previous post from February 2023, I outlined my rough count and levels for the last wave up, here are my thoughts for the way down:
Assuming we go down, we will likely see last attempts of distribution and maybe another notch up. Some sellers may still need buy orders to fill. This could result in volatile days, nasty dojis, et cetera. I will short every blow off attempt given the RR.
No idea how long it takes. If it feels like an eternity, double that. Deep pockets do not care about time.
Volume has declined since the last leg up. We might see a sharp move down first, and then take it easy on the second leg. Third or last might be nasty. Nice for day traders, irrelevant swing traders.
I have looked at a lot more than you can see in charts.
My main target is 360ish (~30%). If that breaks, we might go for 336. If hell breaks lose for whatever reason, sub 300, or lower.
There will be outperformers and underperformers, like in this last leg up. Yes, AI is great however, actual value to enterprises and monetisation of it remain to be seen, and we have not even started to regulate or legislate the crap out of it.
I might be wrong; surely hope so for permabulls out there but I cannot see any bullish signs here no matter how hard I look.
Good Luck

QQQ - Make or BreakQQQ is sitting near what I consider to be the last line of defense for bulls. A break below the uptrend here would likely lead to an extended sell off. A lot of stocks and indexes are around major levels, so I think there is a lot riding on NFLX earnings today.
NFLX earnings could lead to gap down below the uptrend for QQQ, or a move all the way back up to erase this week's sell off.

QQQ the LAST RALLY is about to start target 512plus or minus 5We peaked into the cycle turn due 7/11 /7/18 and have now traced out an abc decline into today low with a HIGH VIX We should now see the last leg of the BULL from 254.5 low oct 13th spiral turn and see a minor new high from low end 504 to as high as 520 But I will look for the middle of this range 510/512 over the next 30 days I will mark this NEXT high as SUPER CYCLE TOP from oct 27 2023 and oct 13th 2022 I will look for a 11.8 to 16.2 % decline into oct 3th to oct 17th that should be a first leg down . BEST of TRADES WAVETIMER


Buy the Dip!!Price action bearish but rotational in nature. I am targeting the 50MA which coincides with the top of my long term channel to buy back in.

$QQQ TIMBBBEEERRRRSSSHere we go what goes up must come down I believe its the law of gravity IDK im working on my alchemy. Remember Sell Retail and Buy Wholsale until you see it the other way... keep up

QQQ WHERE WILL IT GO.I think for QQQ we retrace up tomorrow to the 485 level then reject and drop back down.
My bullish case is if it breaks above 485 we head to 488.
A break above 488 we fill the 496 gap by end of the next week.
To confirm a true down trend in the short term we need to break 480 level.

The Nasdaq100 $QQQ to $465 by August 1st - PUT$!The Nasdaq100 NASDAQ:QQQ is having its worst day in months. We've known that a significant correction in BIG tech (The Mag-7) was coming. We didn't time it perfectly, but we timed it pretty darn well, and now, we're reaping the lucrative rewards of being RIGHT!
Our 7/19 $77 NASDAQ:TQQQ put options nearly 7X'd this morning. I never "like" trading contracts with expirations that close, but what we've seen today provided a great example of how much reward they can carry if you're willing to take the risk.
That's also why I chose to push back the dates on my new NASDAQ:TQQQ put position to 8/9. I ultimately believe that the NASDAQ:QQQ could be playing out this head and shoulders pattern that will bring it down to $465 by August 1st. That said, I plan to sell a bunch of contracts once/ if we see $474, then re-purchase them around here ($482-$484).
I don't want to spend too much time celebrating, but in my opinion, it's necessary to take a victory lap when it's deserved. Congrats team. This market hasn't been easy to trade, but we've absolutely nailed it this week.

Elliot Wave Analysis/Prediction of QQQ Chart (Monthly Timeframe)Overview
The Invesco QQQ Trust (QQQ) chart presents a well-defined Elliott Wave structure over the long term, suggesting a robust bullish trend. Additionally, the RSI is indicating interesting channel movements that reflect changes in market momentum.
Key Points:
Elliott Wave Analysis:
The chart displays a clear Elliott Wave pattern:
Wave I started the initial uptrend ($168-$407)
Wave II was a corrective phase, resetting the trend. ($407-$254)
Wave III marked a significant bullish run, reaching new highs. ($254-$550expected)
Wave IV will be a minor corrective phase with support around $450-410 before the anticipated Wave V.
The potential for Wave V suggests further upward movement, continuing the long-term bullish trend. From the lows of Wave IV, we expect to see 80% appreciation before May 2027
RSI Trend:
The RSI is currently around 72.00, which is in the overbought territory, indicating strong bullish momentum.
The RSI has been moving within a rising channel, suggesting increasing momentum over the recent months.
Historical RSI movements show that the QQQ tends to pull back slightly when RSI reaches these levels before continuing the upward trend.
Support and Resistance:
Immediate support can be found around the $450-$410 level, aligning with the previous consolidation zone and the potential Wave IV corrective phase.
Resistance is projected at the current all-time high around $483, with further potential to reach higher levels if Wave V unfolds as expected.

Consolidation or potential CorrectionThis chart displays the price movement of the Invesco QQQ Trust (QQQ), which tracks the Nasdaq-100 index, over a period from early 2023 to July 2024. Here's an analysis of the key points:
1. Overall Trend: The QQQ has shown a strong upward trend since early 2023, with the price rising from around $260 to over $480, representing a significant gain of about 85%.
2. Recent Performance: As of July 17, 2024, the QQQ is trading at $483.20, down 2.62% (-$13.00) on the day, indicating some recent pullback.
3. Notable Movements:
- A sharp decline of 9.08% (-$28.49) over 26 days in early 2023.
- A significant rally of 24.97% ($77.24) over 57 days in spring 2023.
- Another substantial gain of 31.25% ($106.99) over 100 days from late 2023 to early 2024.
- The largest gain shown is 21.75% ($89.79) over 55 days in the most recent period.
4. Volume: The trading volume (shown at the bottom) has generally decreased over time, with recent volume lower than in early 2023. This could indicate decreasing volatility or investor interest.
Current Outlook: The most recent price action shows a slight downturn after reaching new highs, which could be a short-term correction or the beginning of a larger pullback.
This analysis suggests that while the QQQ has performed exceptionally well over the past year and a half, it may be entering a period of consolidation or potential correction. Investors should monitor for continued support at current levels or signs of further decline.

QQQ - Trump Rally Fading Here - Where are we at?As mentioned if it appeared like Trump was going to win we would get a rally but it would fizzle out and fade. We are what I believe starting to fade.
I am short 200 shares @ 476.42 Avg
I am short 2 JUL19 495 Calls @ $6.64 each which are now trading at $0.34.
Only 2 days left I am going to just hold the calls to expiration, it is looking good to expire worthless but there is no reason also not to just close them out and take your money and run ($1260).
I would like to see a setup on the daily here to add another position or sell more Calls so simply going to wait. Would be reasonable to see a bounce tomorrow and that is where I am looking to short.
Bottom line, The Big 7 are a good hiding spot, but now that the election is becoming more and more clear, look for that rotation into energy stocks and also a few like CAT and DE.
I am also looking at some beat up Biotech stocks as well.
Happy trading!!!

07/17 QQQ ATR Levels and RangeCurrent ATR showing at 5.62 increasing ever so slightly from last week and so far increase for this week. Even tho there is downside action creating most of the increase, its still an increase alal together.
Last months High was 487.2 Needing to seriously defend this level this could be a possible bounce area, if not we find the high 486 level for a bounce.
Preferable to keep within this quarter I would like to see a bounce at 488.30 to push up thru -to 490.70 (Last weeks low)
If we open above 489.08 we could find some resistence at 492, 493 range (this weeks low) if the want to take it higher, they may form a channel between 493.80 to 496.38/57/72 for yesterdays close, after hours high and premarket high.
Whatever the possibilities are, I am looking for price action and volume.

Daily Recap - Small Account Challenge QQQ AMD PLTRA recap of today's action. Great day for the Dow and Russell, but pretty quiet for NQ. I was fairly bearish going in to today, but ended up bullish by day's end. I'm trying to play it day by day and remain mostly neutral because I haven't been reading some of the recent action well when it comes to the next 1-2 weeks lately. I like to slow down and focus on day trades or some less risky swings when that happens.
I like the PLTR long, but still think it could be dangerous. We have cleared $27 and remained above, but we have a final obstacle here around $29. Seems like it could go either way, but maintaining bullish bias for now.

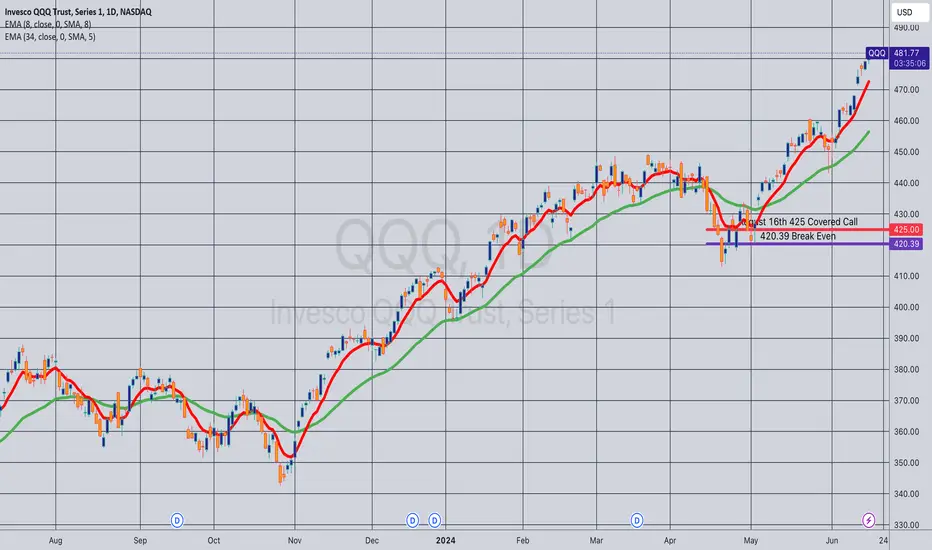
Opening (IRA): QQQ August 16th 425 Monied Covered Call... for a 420.39 debit.
Comments: After having taken profit on my August 16th 420 CC, re-upping, but at a slightly higher strike ... . The ROC %-age metrics aren't generally what I like to see out of these, but have already realized some gains in the August cycle, so am fine if the ROC %-age isn't stellar here. I'm also selling the -85 delta call against, as opposed to my usual -75.
Metrics:
Break Even/BPE: 420.39
Max Profit: 4.61
ROC at Max: 1.10%
50% Max: 2.30
ROC at 50% Max: .55%
Market Watch: Analyzing QQQ and ITB PerformanceIn this week's market analysis, we're diving into the performance of Invesco QQQ Trust (QQQ) and the iShares U.S. Home Construction ETF (ITB) over the past five years.
**Orange Line**: ITB (iShares U.S. Home Construction ETF)
**Candlestick Chart**: QQQ (Invesco QQQ Trust)
Here's what stands out:
1. **ITB vs. QQQ Performance**:
- Over the last five years, ITB has shown impressive growth of 181.62%.
- QQQ has also performed remarkably, with a gain of 138.88%.
2. **Relative Strength Index (RSI)**:
- The upper RSI chart shows the RSI for QQQ, currently at 73.93, indicating an overbought condition.
- The lower RSI chart displays the RSI for ITB, at 57.39, suggesting it's in a more neutral zone.
3. **Trend Analysis**:
- Both ETFs experienced significant volatility during the COVID-19 pandemic, as seen in early 2020.
- Since then, QQQ has steadily recovered and reached new highs, while ITB has shown stronger but more volatile growth.
4. **Recent Movements**:
- Both ETFs have shown positive momentum recently, with ITB experiencing a sharper upward trajectory.
**Key Takeaways**:
- ITB has outpaced QQQ in percentage growth over the past five years.
- RSI indicators suggest that QQQ might be in an overbought zone, while ITB remains in a healthier range.
Stay tuned for more market insights and don't forget to follow for weekly updates!
#StockMarket #Investing #ETFs #QQQ #ITB #MarketAnalysis #TradingView #Finance #Stocks #Investment
---

07/15 QQQ ATR Levels and RangeWith the crazy event over the weekend and lite work on the reports side with the exception of Powell speaking at 1230... I DONT Know what to expect and will be watching the following levels. ATR currently sitting at 5.46, which is a slow increase.
If we can get over 497.50 area we could see the 500 trange again, maybe 503.50 area.
If we lose the 495 area we could go as low as 490.73
SCALP
SR2 498.53
SR1 497.82
SPOP 497.11
LAST PRICE 496.40
SBREAK 495.69
SS1 494.98
SS2 494.27
----------------
R2 503.50
R1 500.77
POP 499.13
LAST PRICE 496.40
BREAK 493.70
S1 491.54
S2 490.11
