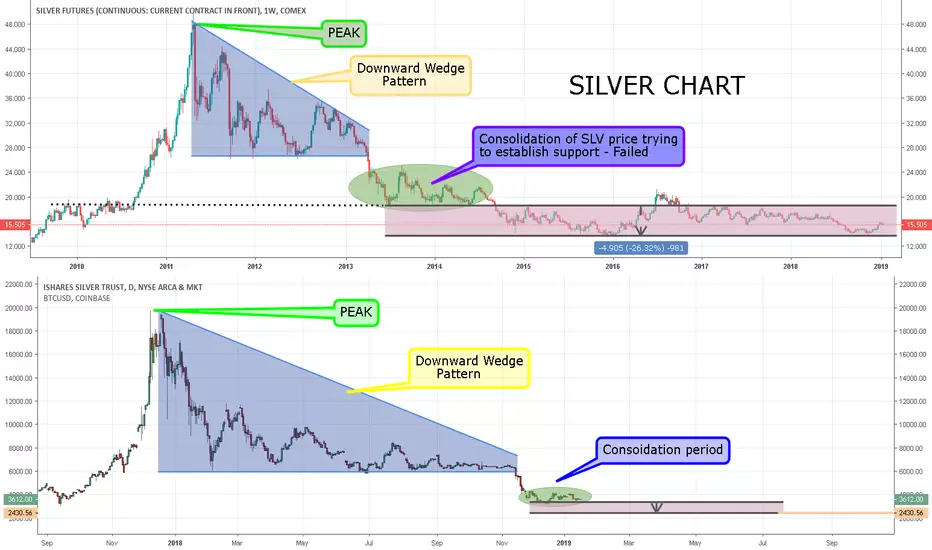
SILVER VS BTC BUBBLE ANALOGIn our BTC vs SLV analog piece we identified remarkable similarities within the charts. Trying to figure out the time frame of the consolidation area is key. In SLV, the timing of that consolidation period was over 3 months, however, the 500% rally also took 2.5 years. In BTC, the 500% rally only took ~9 months. With this scaling in mind, the consolidation period in BTC may be closer to ~1 month than 3. Any clues as to WHEN the next move occurs is critical when it comes to trading BTC Derivates, because in options, timing is everything!
In the first week of December, we had compared the two charts stating that BTC was in a consolidation period that, if correlated on the same time scale as the SLV bubble, would break the interim lows of ~$3,200 between 1-3 months. We believe this thesis still remains intact which could mean seeing a break of the lows in the coming weeks. A 25% selloff in BTC from the current lows of $3,200 would be to roughly $2,400. If this occurs, we believe new institutional players will enter this space to start reallocating their assets and resources into Cryptocurrencies. Since BTC has first-mover advantage and name recognition, we think this would be the coin that "Wall Street" uses as an avenue to invest in to get digital asset exposure.
Over a month ago, we came out with an analog piece comparing the Silver bubble of 2011 to the most recent bubble of BTC. In the first week of December, we had compared the two charts stating that BTC was in a consolidation period that, if correlated on the same time scale as the SLV bubble, would break the interim lows of ~$3,200 between 1-3 months.
We believe this thesis still remains intact which could mean seeing a break of the lows in the coming weeks. A 25% selloff in BTC from the current lows of $3,200 would be to roughly $2,400. If this occurs, we believe new institutional players will enter this space to start reallocating their assets and resources into Cryptocurrencies. Since BTC has first-mover advantage and name recognition, we think this would be the coin that "Wall Street" uses as an avenue to invest in to get digital asset exposure.
Contacts
Tim Kelly
Founder and CEO
tkelly@bitooda.io
Brian Donovan
Executive VP of Institutional Sales
bdonovan@bitooda.io
Dr. Ilya Kurland
Chief Derivatives Strategist
ilya@bitooda.io
About BitOoda
BitOoda is a digital asset advisory firm specializing in trade execution, market analysis, and structured products.
For business inquiries, please e-mail info@bitooda.io
SLV trade ideas
Silver ($SLV) tests resistance for 1st timeSilver has been in a bear market for 8 years. It will very likely not break through this strong resistance order block on first try. $14.00 level will provide a nice take profit opportunity or long entry.

SLV Approaches Breakout LevelMomentum in SLV appears to be very strong but heavy resistance lies ahead. Can SLV break through the 16 level? If so, upside may reach $50+ .
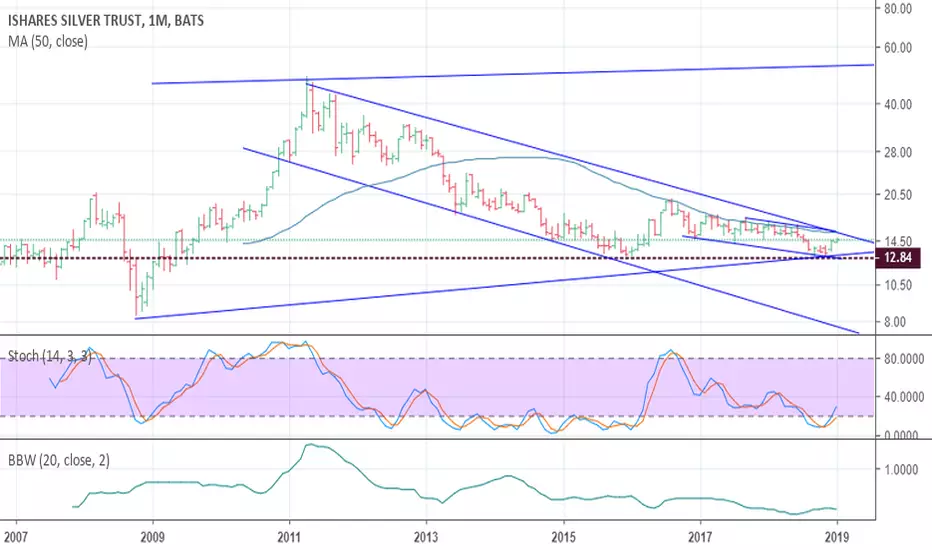


What Happens if Silver Can't Break Out?Successful resistance at 16 could lead to a 50% drop from current levels.

Time to long silver?Silver has had a pretty rough time since April 2011. Looking at a monthly chart, we're starting to see it poke it's head up. The vortex indicator is in a position that shows we may have hit a bottom. MACD is curling to the upside as well. Break of the red trendline to the upside (candle close) with an uptick in volume will be the confirmation for this trade. This could be a solid long-term play in the coming months/years.

Is silver about to turn bullish?Good afternoon traders,
Been quite some time, my workload is year round, however it's quite seasonal. I'm finally coming off and find myself with some time to do some charting.
Silver is one of my long term holds, it's at historical imbalances with gold, and once again, expected to out perform gold in 2019, take that with a grain of salt because as we all know, metals aren't the cool investment on the block these past years.
Let's dive in.
Bullish Key Points:
1) Silver is currently sitting underneath the 21 Weekly EMA, the first test will be to clear this hurdle and start trading between the 21 and 50 EMA.
2) The 21 and 50 EMA have crossed on the daily chart, last time this has happened was June 8th and silver rallied almost 6%.
3) If silver can break the 21 weekly EMA, then it has another immediate test @ 14.00. Beyond this, we have the local downtrend channel dating back to August 2016 @ 14.50.
4) Silver currently has the most upside of all the metals, and with the current market economy, could potentially realize significant gains in the next couple of months.
Bearish Key Points:
1) Let's be honest, this is a highly manipulated market. If the powers that be deem it's not going anywhere, well it just won't.
2) Weekly EMA test. Silver has not traded above the 21 EMA since June, if it can't find steam in the current market conditions, I'm not sure what else it will take to get it moving.
3) It has major tests ahead. In addition to the weekly EMA we also have two major tests within 6% of the current price.
Positions:
1) I currently hold spot silver ETF, as well as multiple future long calls.
As always, if you appreciate my content please hit the "Like" button, and consider following.
Thanks for reading!


$SLV New Fib Support. Next support, looking at the $12.77-13.06 area. Going long $USLV on buy signals if it holds.

Cup & HandleGood day folks,
Looks like silver is making a cup and handle pattern. I'm a buyer here and will hold for a few weeks (maybe months) unless it is clearly unable to breakout. Anyway, a nice addition to any portfolio imo.
Have a nice day!

Silver Bells? Have some for the long runLong term Head and shoulder bottom. At historically cheap prices. Doubt it lasts. If 2007 repeats. Could double.

Silver not going to stay cheap for long. Zoom out and see the head and shoulders forming and long term lows holding


$SLV Bullish Credit Spread (Oct Monthly)Medium term bullish credit spread on SLV ( silver ). As silver attempts to break above 14.35 (spot price) we have a unique opportunity to profit on a 1 month bullish credit spread.
Entry 13.44
Max profit 14.50
Break even 13.70
0.26/1 risk/reward

$SLV to make an up move hereFirst test of 10d/20d Moving average cross strategy
Maybe jumping the gun a little here, but the 10d has pointed up, looks to converge with 20d MA, and MACD shows momentum
this a paper trade only, but i wanted to livetest this strategy on a non-crypto asset to see what sort of validity it has in a multi-asset portfolio
let's see how it goes
$_$

Long SLV - Risk/Reward Ratio 2.5Long SLV - Risk/Reward Ratio 2.5
Scale in as price falls as long as support isn't broken.

SLV - Long Term Buy and HoldI have purchased a large tranche of SLV to begin building up a long term position in the very beaten-up precious metals sector. I am not convinced the bottom is in quite yet but we are likely close. I have begun seeing articles about how gold/silver investing is dead and some articles go as far as saying the price of PMs will never recover. Price extremes, extreme statements in news articles, extreme positioning, and capitulation by the perma-bulls often mark the beginning of a bottom. Why I have chose silver is due to the Gold/Silver ratio now being towards the top of a century long extreme.
Let me re-iterate that PM's could continue to bottom for the next few months and correct even deeper but as a long term buy-and-hold strategy, any future price drops will offer opportunities to average down. My time horizon for this trade could be 5-10 years or longer. Once price does rebound and begins rallying, owning the stock outright will give me an opportunity to sell covered calls against it and begin generating consistent returns and lower my cost basis even further.

Silver ETF and PhysicalRecent analysis shows that the SLV ETF and physical Silver are approaching support lows. The red box indicates the accumulation zone for the asset.
Once there consider buys between the .886 fib and the .941 Fib. One could also consider a three month short or put at this price.
One can also go long, oncein the accumulation zone with either buying SLV, Leaps with SLV for 1 year and or buying the physical.

