SOX dowside MIN targets wave structure formation iThe bullmarket in Sox has reached the 5 th wave TOP as model gave me a new high from oct 2022 as it dropped in clear e wave to perfect fib relationship .50 .618 and 1.618 right at the lows I see this Bull phase Completed see charts 2000 rally phase
SOXX trade ideas

Dont sail agaist the stream! Short SemiconductorI know semiconductor is super hype, and shorting them i quite craziness.
But there is only one real king in the jungle! Nope, not NVDIA, not AMD, not APPLE.
The FED almighty and the FED is not done yet!

SOXX 1W chart with a Gravestone DojiRSI is overbought. MACD is turning. 1W chart shows a graveyard Doji.
December is also usually a time where traders and hedge funds take profit.

keep an eye on this! 🦅SOXX recent bearish break below trend support that goes back to 2022 ☠
break of 452 and we may see another -50+ dollar move 🔴
if we can reclaim trend support/485🟢 then a rally to 563 should follow
boost and follow for more.. thanks ❤

Semis to bottom of channel - SOXXThe SOXX (semiconductors) ETF has been playing around with this channel for almost a year. Price broke down back into the channel recently (bearish) and with NVDA earnings we tested the top of it again. My guess is it goes back to the bottom of the channel and any bounces should be a good selling opportunity. Any higher than 518 and this idea will be invalid - good luck!

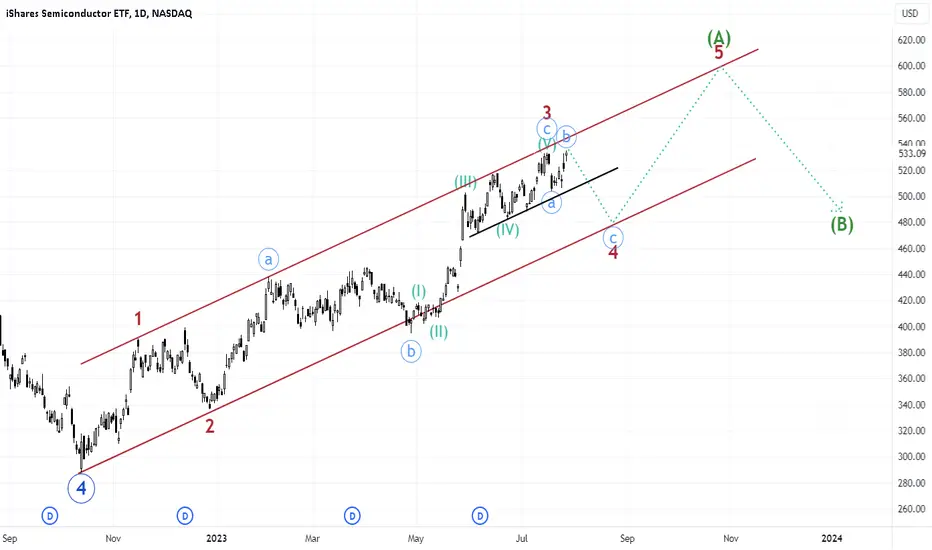
SOXX Harmonic Elliott Wave and Hurst's Cyclic AnalysisOverview: in the previous update I published on May 27th, I had SOXX close to the completion of wave (III) of c of 3 of (A) of 5.
Update: our proposed structure/path has been followed nicely.
Analysis of the structure: I think we are in wave 4 of (A) of 5 developing as a flat correction. Note that wave (IV) of c of 3 also developed as a flat correction, complicating the analysis of this chart a bit. Based on the fib retracement of wave 3, I see 486.74 or 467.62 as my potential targets for wave 4 bottom.
Analysis of the cycles: we are in the second 40D cycle of the second 80D cycle of the first 20W cycle of a 40W cycle. The upcoming 20W cycle is expected at the end of August. We have not yet seen any FLD breaks to the downside to generate targets.
Bearish Cypher on Weekly Semiconductor ETFAD showing overbought, and also showing previous support is now acting as resistances. D leg failing to breakout above past money flow breakout level on X leg... Looking to set up a Swing Trade Short


Golden Cross ETF – Strong Bullish Pattern - $1000 Price TargetThis is a once in a lifetime opportunity to go long with SOXX. The arrival of the golden cross is a strong bullish pattern for the ETF. $1000 price target by end of 2025.

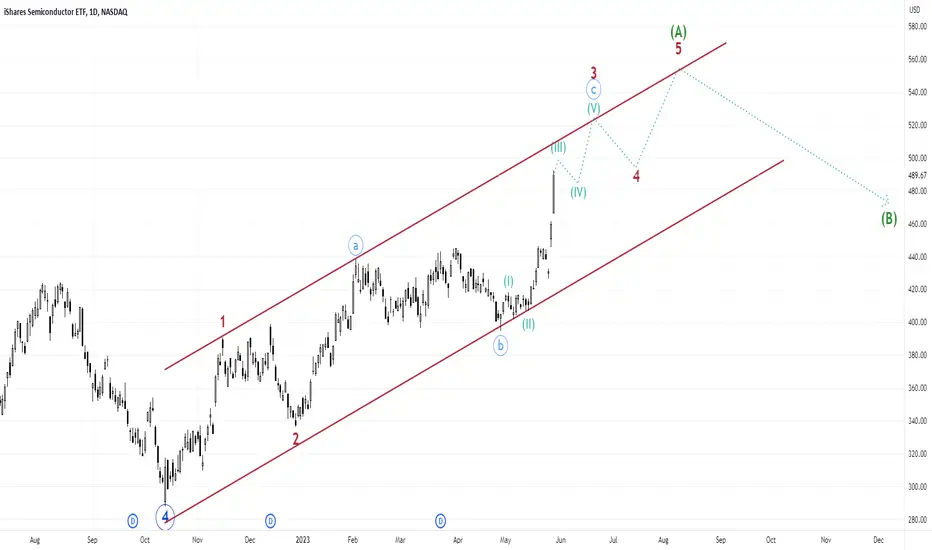
Semiconductor ETF Harmonic Elliott Wave AnalysisThis chart was requested. I see SOXX close to the completion of wave (III) of c of 3 of (A) of 5.
$SOXX head & shoulder topYou don't often see a short set up as perfect as this. Head and shoulder topping pattern with a broken trend line and failed re-test of it. Target 176

SOX INDEX AND WHY THE LOW 5/4/2023 MUST HOLDThe chart posted is that of the chip sector . The put back was almost perfect to the long term trendline . So I keep it VERY SIMPLE if that low breaks run DO NOT WALK to the exit and do not buy back it for any reason

SOXX bullish reversalSOXX has been in a bull move since inception
right now according to FIB golden pcoket its right at the resistance level of 0.5 so 440 to 454 will make confirmation of the bull reversal
Given the recent movement it seems like it will make that break with slight correction periods and will be on its way back to its highs of 500+
Entry @ CMP

I like 5G technologyRead more about this ETF here
If you have always wanted to buy shares like Qualcomm, Nvidia, Micron, TSMC, Marvel Technology,etc , perhaps this ETF is a good option. I like that it has a fairly small components of only 30 stocks and a relatively low expense ratio.
More importantly, the 5G technological trend will drive the global demand for chips industries tremendously.

short SOXXstraight up to prev resistance and reversed.
Semi overall in a cyclical down trend, dead cat bounce may have reached its end

Semiconductors trying to reclaim 5-week sideways rangeKeep an eye on the semis here as they try and reclaim the lows of this 5 week sideways range. They didn't break down as hard as the major indices and the open gap from November is still very much in tact.
Overall, we're seeing some relative strength out of this higher beta group.

SOXX 2D: WHERE ARE SEMI'S HEADED?SOXX, 2D: Taking a look at the SOXX 2D chart I have drawn out a linear regression channel beginning on November 12, 2021 which was about 7 weeks prior to the ATH print at 557.12 on January 3, 2022. The SOXX proceeded to decline approximately 41% from ATH (557.10) down to its recent low at 326.70 on July 1st, 2022 before rallying almost 30% off the floor to 424.78. So, where are we now, and where are we going next?
Linear Regression: The linear regression channel in the chart is divided up by color and is illustrative of 6 standard deviations of potential price action expressing a 6 sigma potential linear range of 435.18 – 279.37 with the high confidence interval range (+-2SD) from 408.93 to 305.61. Our linear mean is currently sitting at 356.78 with a Pearson’s R^2 indicating a high central tendency at 0.894. the linear mean and is currently expressing a potential linear range of 435.51 (+3SD, red) to 308.20 (-2SD, blue). As we can see the recent rally is filling out the upper end of the linear range, clearly pushing deeply into the upper 3rd standard deviation range off the linear mean. Using central tendency as an approximation of trend strength there is a high potential for price to mean revert down to the 356.78 price region.
Fibonacci Retracements: I have left the Fibonacci Retracements up in the background and have also added white lines to mark the significant levels of 0, 0.5, and 1 retracement respectively. Despite the overextended nature of the recent rally, price failed to breach the 0.5 Retrace at 441.91 which would have gone a long way to indicate a high potential for the lows to be in. It is important to note that if price were to breach the 0.5 retrace to the upside it would reduce the probability for lower lows this year but would not eliminate them entirely.
Elliot Wave: It is my position that we are in the 5th wave down from the ATH as illustrated by the yellow EWT count on the chart. Given the somewhat unruly nature of 5th waves and their increased potential for irrational behavior, we will leave some grace with regard to our expected landing zone. It is my prediction that we will bottom out somewhere in the 334-303 range as illustrated in the yellow, square box. This thesis is in confluence with market trends during mid term election years in the month of September, which is that they have a tendency to decline through the month of September and early October before rallying into the late fall/winter after the election.
EMA Envelope: Our EMA envelope (top box), is a trend based EMA indicator based on the last 40 days. The envelope turned bearish(red) with a body close below the 387.12 price point and would turn bullish (green) if price were to bounce back up over the 405.83 price point. Signal is currently residing in the neutral zone as indicated by the yellow in the top box.
VFI (Volume Flow Index): Our volume flow index is a fixed range cumulative indicator based on the last 130 periods, which on a 2day time frame spans the last 260 days. As we can see the green line representing the volume flow is crossing over its moving average to the downside. Please also see that our VFI signal also failed to breach the zero and has not risen above the zero line since the late March rally.
RSI: Our RSI is sourcing data using a hlcc range configuration to add data point density to the measurement and potentially at the sacrifice of a more discerning measurement that might come from using a close only price range configuration. What we see is our RSI signal currently entering the bearish end of its range (<45).
MACD-X: Our MACD indicator is showing our lag differential (12-26) crossing over our 9 period ema to the downside and beginning to print its first few bars of negative trend coming off the recent rally which began at the beginning of July for the SOXX ETF.
SUMMARY: We have moving average trends rolling over to neutral from being recently bullish, volume flows that have been trending upward recently but not at levels supportive of 2021 price levels, an RSI that never hit overbought and has since reverted back to its median and a MACD beginning to indicate the potential for a downward trend to emerge.
What the above summary of indicators appears to be from my perspective is an upward retracement within a larger downward trend, or what is more commonly known as a “bear market rally”. It is my position that price will decline to its linear mean at 356.78 before making a decision of whether to spill further or consolidate in a range bound, downward trending diagonal. Until fundamental headwinds provide a better catalyst for the technicals to improve going into the late fall/early winter it would not be unreasonable to expect further downside volatility.

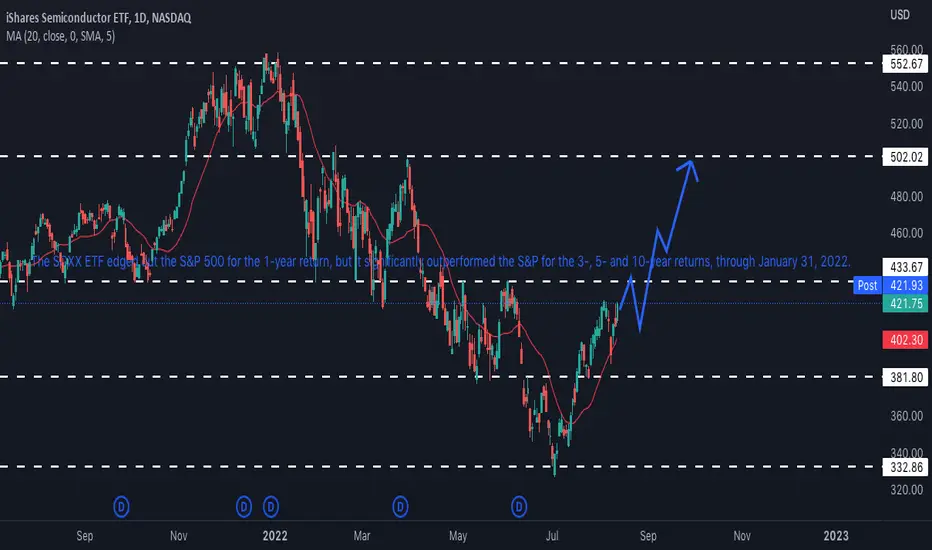
A bullish scenario for SOXXThe SOXX ETF edged out the S&P 500 for the 1-year return, but it significantly outperformed the S&P for the 3-, 5- and 10-year returns, through January 31, 2022.
Double whammy of demand contraction and political leverageSummary
The semiconductor sector is expected to enter a difficult period with demand contraction due to recession and crypto winter. As the US government is increasing the effort to use semiconductors as a leverage to put pressure on China, companies in the sector might be forced to prioritize the national political agenda against profit and growth , which further amplifies the negative impact from slowing demand.
Demand contraction
The US economy officially entered a technical recession as the GDP figure announced this week unexpectedly shrank again by 0.9% , making a 2 quarters consecutive decline. Large employers such as Amazon are also announcing their layoff plan to better weather the worsening economic outlook. Companies downsizing will reduce the demand for office electronics such as laptops and work phones.
Although the commonly reported U3 unemployment rate remains stable at 3.6%, the U6 unemployment rate has actually increased for 2 consecutive months from 6.6% to 7% . With states continuing to pair back the covid unemployment benefit, more people are forced to re-enter the job market which in some cases the pay are not even as good as the unemployment benefit they have been receiving. The reducing disposable income of the US consumers is likely to negatively impact the demand for goods, especially for the non-essential durable consumer product such as electronics. High food and energy prices also contribute to such change in spending allocation.
Political leverage
Semiconductor chips are one of the most critical building blocks for most electronic products. The new product trend such as electric vehicles further push up the demand for chips. To put it into perspective, a Ford Focus uses roughly 300 semiconductor chips, whereas the electric Mach-e utilizes almost 3,000 semiconductor chips. The US government has been using national security reasons to block companies from selling gears for fabricating advanced chips (<10nm) to China since the Trump era. This week, the Biden administration has notified equipment suppliers such as NASDAQ:KLAC and NASDAQ:LRCX that the restriction is further tightened to <14nm , and it will also cover fabrication plants run by non-Chinese companies such as NYSE:TSM in China. Semiconductors will continue serve as a tool to slow Chinese growth at the cost of industry profitability.
Earlier this week the US Congress had passed the chips act and approved $52 billion in funding for domestic semiconductor manufacturing. While there is definitely a strategic necessity to rebuild the US fabrication ability given the political tension between China and Taiwan , the difficulty to establish a fabrication facility should not be underestimated, if you look at how hard even for Samsung to catch up TSM on defect rate especially for the <7nm advanced chips. For most semiconductor companies it is not just about the funding but also if there is a profitable way out for domestic production, or it is going to be a capital blackhole that keeps sucking investment without meaningful outcome.
Technical discussion
The US equity market is currently rebounding as rate expectation cooled off due to increasing risk of recession. S&P500 and Nasdaq100 have already broken through the 50 days moving average and are now challenging the Jun rebound peak. The 20 days moving average is also catching up and is about to sit on top of the 50 days moving average. In fact, the sustainability of this rebound will depend on how long can the 20 days stay above the 50 days moving average, as (1) upward pointing 20 days and 50 days moving average, with (2) 20 days higher than the 50 days moving average are the basic forms of a bull market.
S&P500
NASDAQ100
In this regard, by comparing SOXX and QQQ, one can visualize the sector discount due to the double whammy discussed above. Although SOXX has also broken through the 50 days moving average, the 20 days moving average is still further away from the 50 days moving average , which makes it a better short candidate compared to QQQ for those who believe the recent uptrend is a bear rebound but not the beginning of a bull.
Here are the levels SOXX trader should pay attention to:
Downside Resistance
370 - 385: 20 days and 50 days moving average levels
326.7: Jul-05 52 weeks low
270-280: Post-covid bull breakout level in 2020-Jun
Upside Resistance
433.99: Jun-02 rebound peak
455-465: 250 days moving average level
501.09: Mar-29 rebound peak
While our view toward the semiconductor sector remains bearish, shorting too early in a rebound can be very costly to traders. It is recommended to scale in the position either when SOXX itself, or at least until the border markets show sign of momentum decline (e.g. reverse hammer candlestick pattern)
Note: For traders who wish to trade leveraged ETF such as AMEX:SOXL (3x bullish) or AMEX:SOXS (3x bearish), it is still recommended to use the non leverage version SOXX for technical analysis purposes. As the daily 3x process sometimes will shift the resistance level and make the reading less accurate.

Nice trade idea for SOXX! Semiconductor companies offer a lot of highly liquid securities that encourage risk-taking in all time frames, from intraday scalping to monthly market timing. The sector also supports various profit strategies, including momentum trading, basket allocations and short selling. It acts independently in many market phases, going its own way while major indices push higher or lower. This divergent behavior brings additional opportunities, even in difficult macro conditions. There are many ways to trade the semiconductor space, from identifying particular stocks to investing in the sector as a whole using exchange-traded funds (ETFs).

LONG SOXX: DEEP VALUE SEMI-CONDUCTORS OWN MOORES LAW!LONG SOXX: Deep value semi conductors own moores law
LONG SOXX: Deep value semi conductors own moores law
LONG SOXX: Deep value semi conductors own moores law

Semi's Sliding - My Call On 05 Dec 2021Semi's Sliding - My Call On 05 Dec 2021. As I asked at the time, is the current cycle nearing it's end.
Tweet added as proof/evidence.
What glut? :)

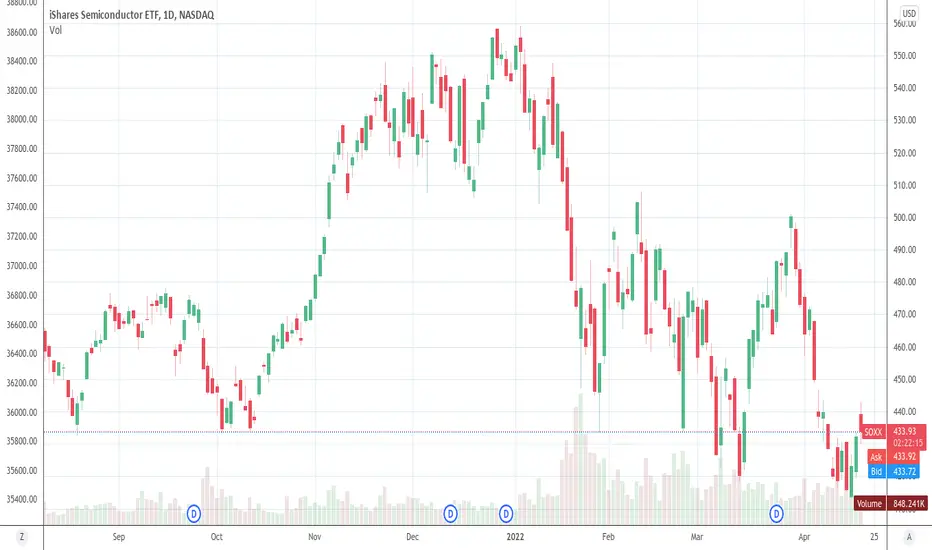
ISahres Semiconductor ETF USA Sun Storm Investment Trading Desk & NexGen Wealth Management Service Present's: SSITD & NexGen Portfolio of the Week Series
Focus: Worldwide
By Sun Storm Investment Research & NexGen Wealth Management Service
A Profit & Solutions Strategy & Research
Trading | Investment | Stocks | ETF | Mutual Funds | Crypto | Bonds | Options | Dividend | Futures |
USA | Canada | UK | Germany | France | Italy | Rest of Europe | Mexico | India
Disclaimer: Sun Storm Investment and NexGen are not registered financial advisors, so please do your own research before trading & investing anything. This is information is for only research purposes not for actual trading & investing decision.
#debadipb #profitsolutions