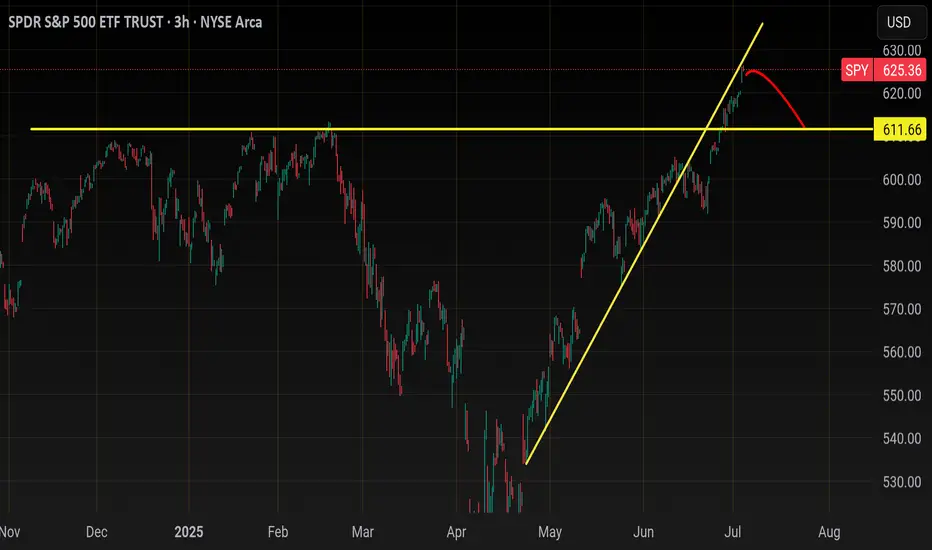
SpySooooo.. the technicals are flashing red.
No earnings
No fed Speak
No economic data
We'll need a catalyst to get the reset going.
There are 2 catalyst
1. Tariffs
2. 30yr bond auction Thursday
I actually think between July 7th- 17th
We will retest the previous high between 610-61
Key stats
About SPDR S&P500 ETF TRUST
Home page
Inception date
Jan 22, 1993
Structure
Unit Investment Trust
Replication method
Physical
Dividend treatment
Distributes
Distribution tax treatment
Qualified dividends
Income tax type
Capital Gains
Max ST capital gains rate
39.60%
Max LT capital gains rate
20.00%
Primary advisor
State Street Global Advisors Trust Co.
Distributor
ALPS Distributors, Inc.
SPY Fund Summary
The investment seeks to provide investment results that, before expenses, generally correspond to the price and yield performance of the S&P 500 Index. The Trust seeks to achieve its investment objective by holding a portfolio of the common stocks that are included in the Index), with the weight of each stock in the Portfolio substantially corresponding to the weight of such stock in the Index.
The investment seeks to provide investment results that, before expenses, generally correspond to the price and yield performance of the S&P 500 Index. The Trust seeks to achieve its investment objective by holding a portfolio of the common stocks that are included in the Index), with the weight of each stock in the Portfolio substantially corresponding to the weight of such stock in the Index.
Related funds
Classification
What's in the fund
Exposure type
Electronic Technology
Technology Services
Finance
Stock breakdown by region
Top 10 holdings
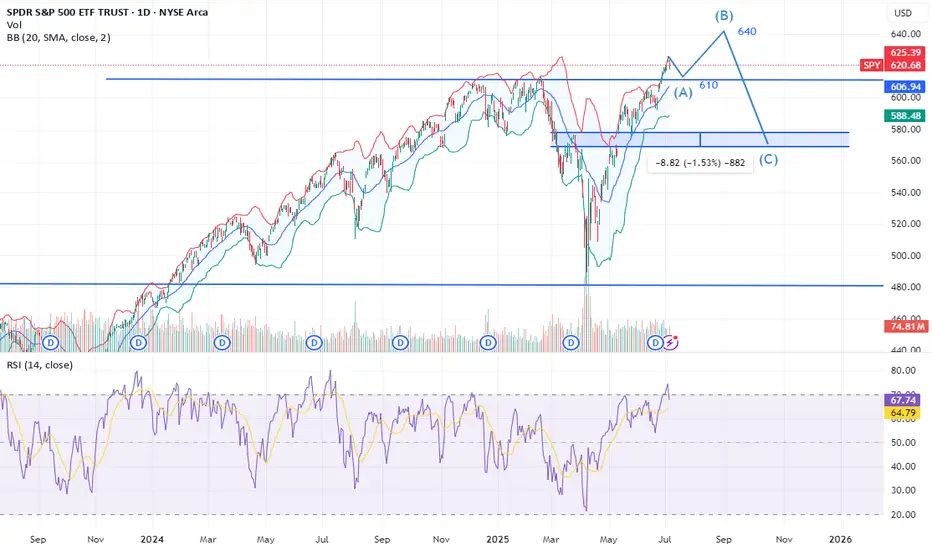
SPY: How are ya?Long time no talk.
Just an update to appease some people requesting updates haha.
Mostly going over the larger term outlook for SPY, the quarterly and some discussions on the weekly.
As always, not advice and remember to follow your strategies and risk management approaches!
Safe trades everyon

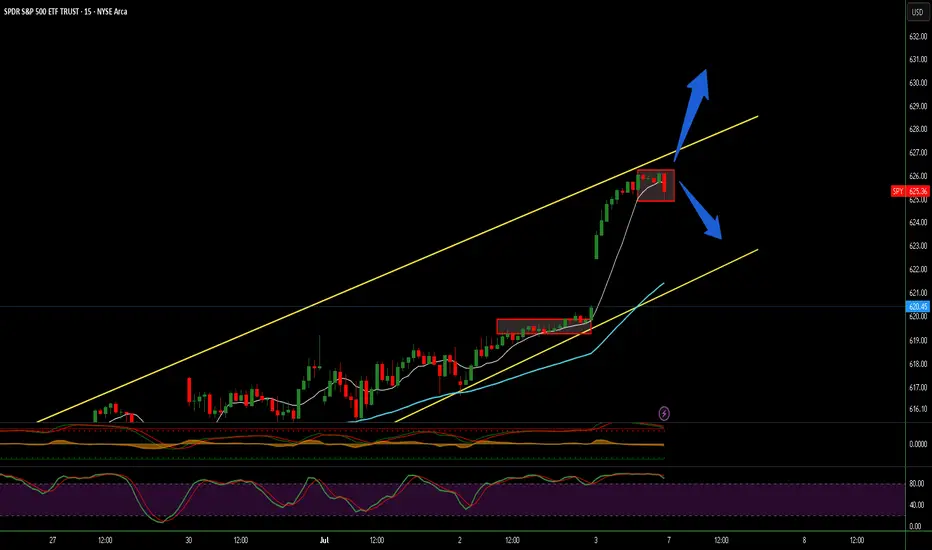
Call or Put? Cast Your Vote!Based on this chart/image, would you vote for a Call (price going up) or Put (price going down)? What’s your opinion?"
Monday Markets Update SP500 may start pulling back, we'll have to see if they can get any downward pressure hapening. USOIL still looks bearish. Gold and Nat Gas both looks like they are going sideways right now. BTC still hasn't broken out above 110k.

clear path to 640 then 570 spyTariffs news are temporary but pump of any good news can lead us to 640 but remember we have to fill the gap 570.
SP500: Fib Channels on Fractal Corridors Research Notes
Testing angle of trendline which acts as support then defines resistance.
Structural reference
Pattern expressed in Fibonacci:
Ascending:
Descending:
Fib Channels on Fractal Corridors supposed to show alternative mapping method which differs from following approach.

SPY/QQQ Plan Your Trade End Of Week Update For 7-4Happy 4th of July
I've been very busy with projects and new tools for traders, as well as the new book I'm working on, and thought I would deliver an End Of Week update for everyone.
In this video, I cover the past Cycle Patterns and how they played out for the SPY/QQQ, Gold/Silver, and Bitcoin, a

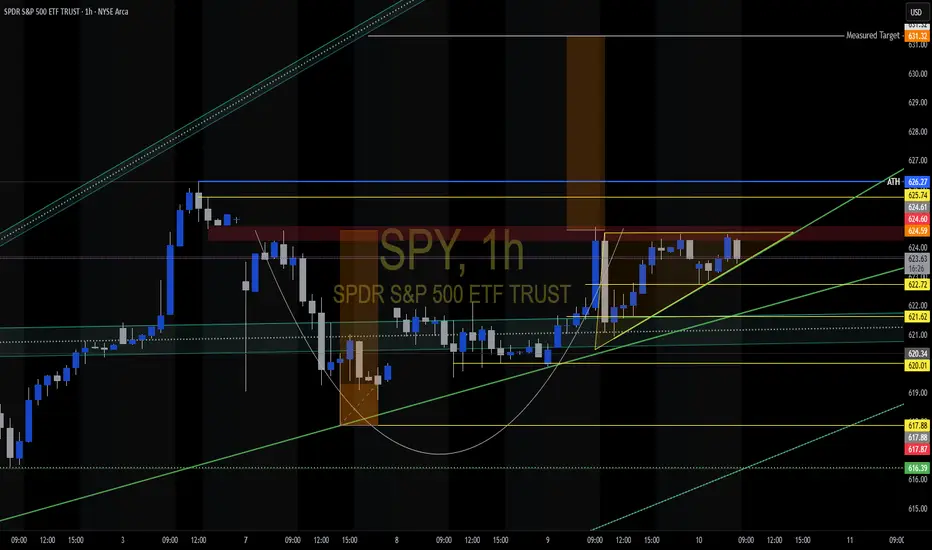
$SPY Tomorrow’s Trading Range and everything in it /// 7.8.25Today’s Trading range and everything in it. How are you playing it?

SPY Bullish Patterns C&H Pattern W/ Right Angle Wedge. Wait for confirmation and retest to have a high probability of success.
SPY at a Key Inflection Point GEX and Price Action Setting Up the Next Move 🎯
🧠 GEX-Based Options Analysis (For Option Traders)
SPY's current positioning in the options market reveals a heavy concentration of gamma and hedging pressure near 620. This level is acting as the Gamma Wall (Highest positive NETGEX / Call Resistance),

See all ideas
Summarizing what the indicators are suggesting.
Oscillators
Neutral
SellBuy
Strong sellStrong buy
Strong sellSellNeutralBuyStrong buy
Oscillators
Neutral
SellBuy
Strong sellStrong buy
Strong sellSellNeutralBuyStrong buy
Summary
Neutral
SellBuy
Strong sellStrong buy
Strong sellSellNeutralBuyStrong buy
Summary
Neutral
SellBuy
Strong sellStrong buy
Strong sellSellNeutralBuyStrong buy
Summary
Neutral
SellBuy
Strong sellStrong buy
Strong sellSellNeutralBuyStrong buy
Moving Averages
Neutral
SellBuy
Strong sellStrong buy
Strong sellSellNeutralBuyStrong buy
Moving Averages
Neutral
SellBuy
Strong sellStrong buy
Strong sellSellNeutralBuyStrong buy
Displays a symbol's price movements over previous years to identify recurring trends.
Frequently Asked Questions
An exchange-traded fund (ETF) is a collection of assets (stocks, bonds, commodities, etc.) that track an underlying index and can be bought on an exchange like individual stocks.
SPY trades at 624.50 USD today, its price has fallen −0.34% in the past 24 hours. Track more dynamics on SPY price chart.
SPY net asset value is 623.84 today — it's risen 3.65% over the past month. NAV represents the total value of the fund's assets less liabilities and serves as a gauge of the fund's performance.
SPY assets under management is 641.57 B USD. AUM is an important metric as it reflects the fund's size and can serve as a gauge of how successful the fund is in attracting investors, which, in its turn, can influence decision-making.
SPY price has risen by 3.86% over the last month, and its yearly performance shows a 12.08% increase. See more dynamics on SPY price chart.
NAV returns, another gauge of an ETF dynamics, have risen by 3.65% over the last month, showed a 17.06% increase in three-month performance and has increased by 12.49% in a year.
NAV returns, another gauge of an ETF dynamics, have risen by 3.65% over the last month, showed a 17.06% increase in three-month performance and has increased by 12.49% in a year.
SPY fund flows account for 66.59 B USD (1 year). Many traders use this metric to get insight into investors' sentiment and evaluate whether it's time to buy or sell the fund.
Since ETFs work like an individual stock, they can be bought and sold on exchanges (e.g. NASDAQ, NYSE, EURONEXT). As it happens with stocks, you need to select a brokerage to access trading. Explore our list of available brokers to find the one to help execute your strategies. Don't forget to do your research before getting to trading. Explore ETFs metrics in our ETF screener to find a reliable opportunity.
SPY invests in stocks. See more details in our Analysis section.
SPY expense ratio is 0.09%. It's an important metric for helping traders understand the fund's operating costs relative to assets and how expensive it would be to hold the fund.
No, SPY isn't leveraged, meaning it doesn't use borrowings or financial derivatives to magnify the performance of the underlying assets or index it follows.
In some ways, ETFs are safe investments, but in a broader sense, they're not safer than any other asset, so it's crucial to analyze a fund before investing. But if your research gives a vague answer, you can always refer to technical analysis.
Today, SPY technical analysis shows the buy rating and its 1-week rating is buy. Since market conditions are prone to changes, it's worth looking a bit further into the future — according to the 1-month rating SPY shows the buy signal. See more of SPY technicals for a more comprehensive analysis.
Today, SPY technical analysis shows the buy rating and its 1-week rating is buy. Since market conditions are prone to changes, it's worth looking a bit further into the future — according to the 1-month rating SPY shows the buy signal. See more of SPY technicals for a more comprehensive analysis.
Yes, SPY pays dividends to its holders with the dividend yield of 1.15%.
SPY trades at a premium (0.11%).
Premium/discount to NAV expresses the difference between the ETF’s price and its NAV value. A positive percentage indicates a premium, meaning the ETF trades at a higher price than the calculated NAV. Conversely, a negative percentage indicates a discount, suggesting the ETF trades at a lower price than NAV.
Premium/discount to NAV expresses the difference between the ETF’s price and its NAV value. A positive percentage indicates a premium, meaning the ETF trades at a higher price than the calculated NAV. Conversely, a negative percentage indicates a discount, suggesting the ETF trades at a lower price than NAV.
SPY shares are issued by State Street Corp.
SPY follows the S&P 500. ETFs usually track some benchmark seeking to replicate its performance and guide asset selection and objectives.
The fund started trading on Jan 22, 1993.
The fund's management style is passive, meaning it's aiming to replicate the performance of the underlying index by holding assets in the same proportions as the index. The goal is to match the index's returns.