SpySooooo.. the technicals are flashing red.
No earnings
No fed Speak
No economic data
We'll need a catalyst to get the reset going.
There are 2 catalyst
1. Tariffs
2. 30yr bond auction Thursday
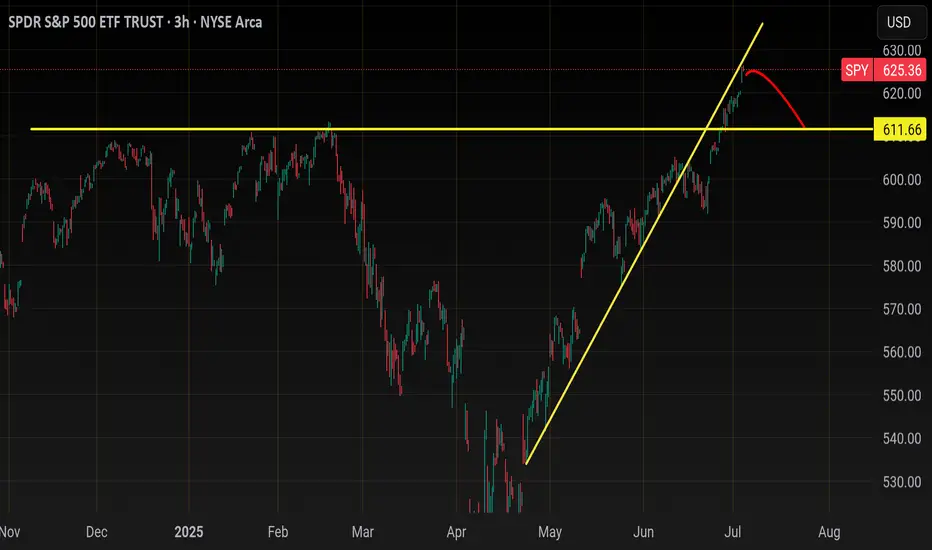
I actually think between July 7th- 17th
We will retest the previous high between 610-611. Depending on how long this takes the 20sma should gravitate toward 610 by the End of this week.
The last two major Pullbacks actually took 2weeks and the price action was terrible. I circled it to illustrate
And this is why I said this pullback could take up to July 17th to complete.
July 18th is the kick off of big bank earnings and let me tell you from experience, you don't want to be going into earning season short especially if seasonality is against you.
Banking sector
AMEX:XLF
I think price pulls back with the rest of the marker but pushes back up to 54-55.00
With bank earnings
From there I expect a bigger correction
Weekly chart says banks won't make it out of July alive . Most likely a sell back to 49-50 or 10% drop
I would say this market would on be bearish with a close back beneath 600.00 on spy.
The problem with that is, not every big tech stock is overbought and some actually look like they are about to rally higher.
Here's an example of what I mean
So here's NASDAQ:SMH or chip sector which is a reflection of Nvda and TSM
Weekly technicals are saying a pullback is coming for this sector!
RSI, Moneyflow are too overbought on both weekly and daily time frames so I'm expecting weakness here over the next few weeks.
On the other hand you have
AMEX:XLY
This is the sector that reflects
Amzn and Tsla
The white line represents the resistance price was consolidating behind for 2months.
The purple circle represents a major bullflag
The green line is the V shape recovery that I think is about to happen with this sector this quarter.
Price may retest 217-218 but if that holds this sector and the stocks in it will outperform.
So what happens with the Spy if let's say you have
Msft
Nvda
Avgo
Tsm
All red
And then
Amzn
Tsla
Googl
Aapl
Mostly green?
Fawkery lol.
And this is why I say a pullback to 610 and then we'll see..
AMEX:IWM and TVC:DJI still have a little room left to move higher but both are supper extended on the daily time frame and I expect a pullback from them this week
There is 2 red flags I see on a bigger time frame and that is TVC:NYA and TVC:VIX
NYA weekly chart
Near the top of rising wedge here which means for the broader marker you will start seeing weakness in a few weeks
Price could grind up here for a few weeks but I doubt we break above 21,000
Vix
Daily chart and RSI
Is screaming that a move to 23 is imminent
If the vix pops back above 20 I can't see the Spy holding above 620
Trade ideas
NASDAQ:TSLA
I like calls above 322.00
Target 332.
Have patience for the move above 322, tsla is beneath all its moving averages right now!.
332 will be tough, if price can break above that then 347 is next up
NASDAQ:QQQ
557 is resistance .
I like the short to 552 gap support. At 552 I'd cover and wait for a break below 548.00 to short to 544..
Below 543.00 and we close gap at 539. I don't think price will drop back below 539 before tech earnings
Be careful about swinging short, it will only work if there is a vicious sell off. Otherwise you will find yourself with annoying small gap ups that will drag this out like I highlighted above on the Spy chart with the last to previous Pullbacks.
So what I'm looking for over the next 2 weeks is a retest for Spy 610 and qqq 540. Then we go into earning season
SPY trade ideas
SPY: How are ya?Long time no talk.
Just an update to appease some people requesting updates haha.
Mostly going over the larger term outlook for SPY, the quarterly and some discussions on the weekly.
As always, not advice and remember to follow your strategies and risk management approaches!
Safe trades everyone!

Call or Put? Cast Your Vote!Based on this chart/image, would you vote for a Call (price going up) or Put (price going down)? What’s your opinion?"
Monday Markets Update SP500 may start pulling back, we'll have to see if they can get any downward pressure hapening. USOIL still looks bearish. Gold and Nat Gas both looks like they are going sideways right now. BTC still hasn't broken out above 110k.

SpyBig week here. Rarely do you get big banks and big tech earnings on the same week..
Jpm, Goldman sach, and JNJ are dow jones heavy weights.
This is important because I think Dow will close that gap at 44,850 and most likely retest ATH at around 45,000.
As long as dow closes above 44,200 Monday, they will do this move
Now logically you have to ask yourself, If Dow jones moves 800pts or 2% what will spy do?
Well unless Nasdaq gives it all up early in the week then Spy will grind higher..
NASDAQ:QQQ
2hour chart is mimicking
June's price action
Even similar bearish Divergence on RSI
So will tech Roll over this week?
TSM and NFLX both reporting..
Qqq 30min price action, as long as price holds above 548.50 I wouldn't short this at all
As you can see with the yellow channel price will be range trading between 551-555. Over 558 and 560 comes.. below 548 and 544 comes.
This is actionable trading, I know some of you want a bigger picture on the short side but until we break below the 20sma I really don't like going full bear at the beginning of earning season...
Yes, alot of things are flashing red signaling a major correction is looming , for Example here's XLC. This is the sector of NASDAQ:NFLX and NASDAQ:META
Here's the weekly chart and RSI
Very bearish bigger picture here, I could easily see this sector and the big names inside it going back to April lows
But then You have AMEX:XLY
The sector of NASDAQ:AMZN and NASDAQ:TSLA
Nothing is bearish Herr and as long as it holds 217 they are going to push this back to ATH.
NASDAQ:AMZN chart is completely identical
So let's say NFLX and Meta have down days similar to last Friday but Amzn and Tsla pumps then you will get a small pullback unless the chipsector dumps also 😉. Remember there's always a bull in the market, they'll just rotate into something less overbought..
Only time you really see majority selling off is when there is a catalyst (Carry trade, tariffs) or Seasonality (March, Sept)..
So I'm bearish on Chips NASDAQ:SMH and I'm bearish on AMEX:XLC but you have to be selective..
I wouldn't short
NASDAQ:TSLA
NASDAQ:AMZN
NASDAQ:GOOGL
NASDAQ:AAPL
Those stocks will likely outperform this Quarter.
As far as the banks earnings , even if they pop, I think this will be a sell the news event and this sector AMEX:XLF (Big banks) is headed for a massive correction
The Small banks AMEX:KRE
Have almost completed their V shape recovery and will most likely correct after this week
Daily technicals are overbought similar to IWM but the weekly is where you see caution
Top of weekly Bollingerband always leads to a major sell the following week
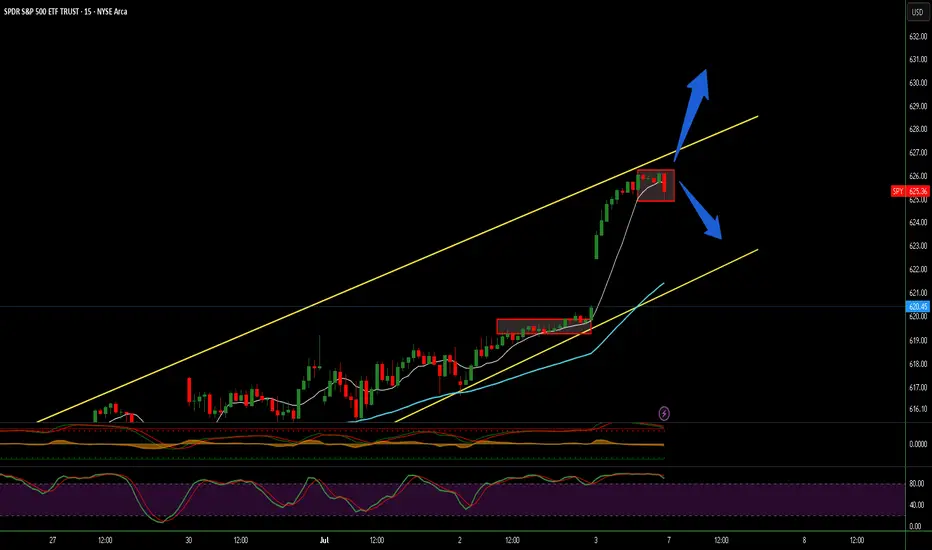
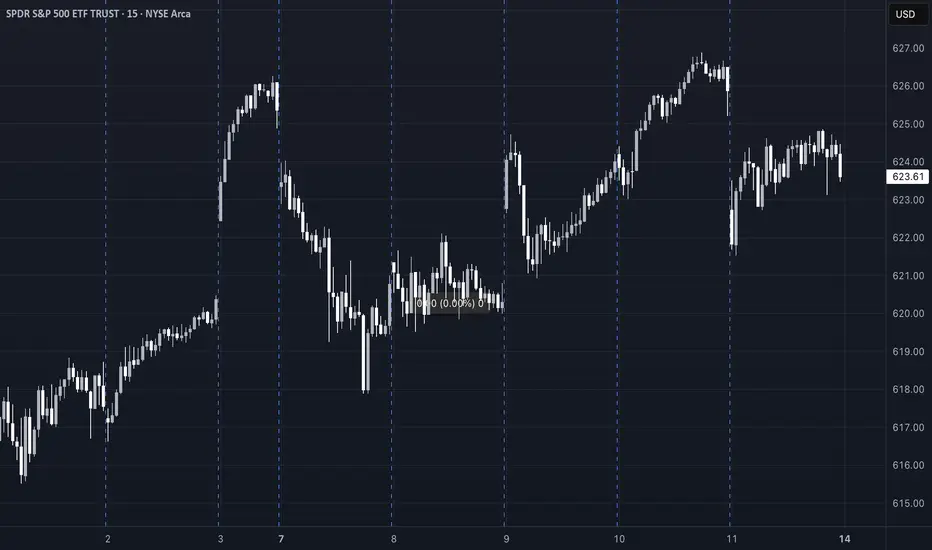
AMEX:SPY
15min chart
I'm bullish early in the week, I think they will buy the dip ahead of earnings so if they open up near Friday's low or the 15min 200sma they could buy it there, below 621 and they will go for the gap close at 620; that will be another dip buy opportunity . Stop loss 619.00
Below 619.00 and they have a gap left open at 614.84 to close. Stop loss 15min 200ma
Trade Idea of the week is NASDAQ:GOOGL
Bullish ascending triangle forming under 182.00 resistance.. Price may breakout this week
4hour chart Friday finished with a Shooting star so we could start the week with a pullback but I think googl will hold 177.00 support and that's a good entry for a long.. or wait for conformation which would be a break above 182.00..
So 177 or 182 is my entry
Googl is only bearish below 172.00 or 200ma
Personal opinion This administration Has promised 200 trade deals and have gotten only 3 so far. As we get closer and closer to August investors will get nervous and I think we will see another major sell! He's has kicked the tariff can down the road as far as it can go and still these countries are calling his bluff. Becareful because I think the next time trump won't fold
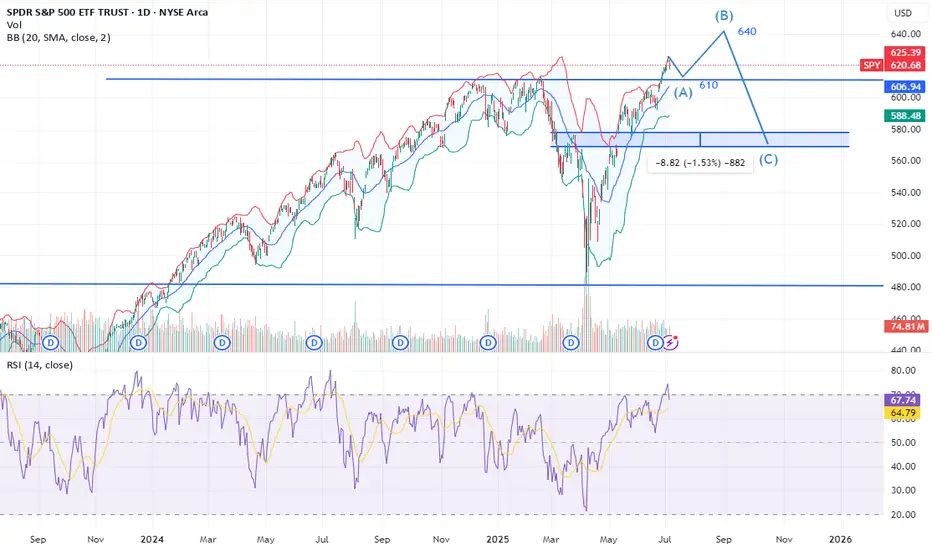
clear path to 640 then 570 spyTariffs news are temporary but pump of any good news can lead us to 640 but remember we have to fill the gap 570.
SP500: Fib Channels on Fractal Corridors Research Notes
Testing angle of trendline which acts as support then defines resistance.
Structural reference
Pattern expressed in Fibonacci:
Ascending:
Descending:
Fib Channels on Fractal Corridors supposed to show alternative mapping method which differs from following approach.

$SPY Tomorrow’s Trading Range and everything in it /// 7.8.25Today’s Trading range and everything in it. How are you playing it?

SPY Bullish Patterns C&H Pattern W/ Right Angle Wedge. Wait for confirmation and retest to have a high probability of success.
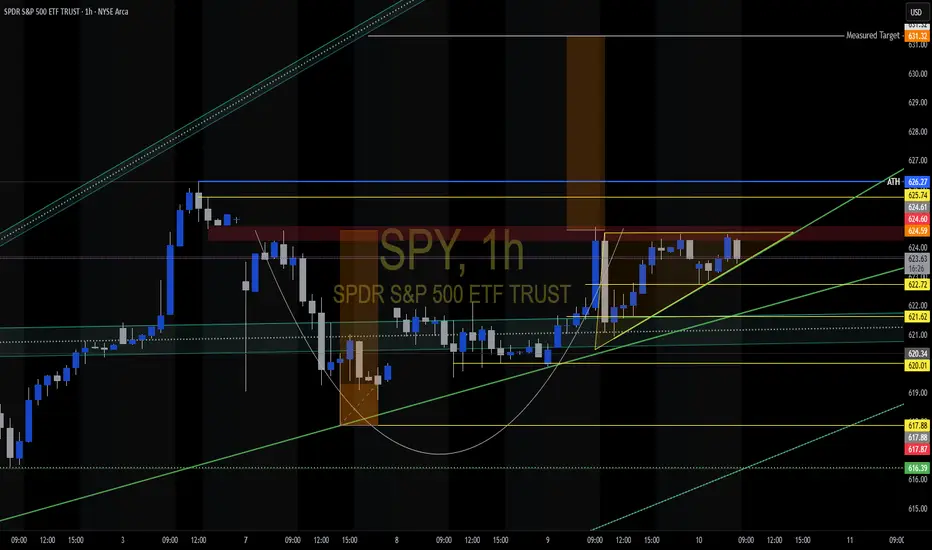
SPY at a Key Inflection Point GEX and Price Action Setting Up the Next Move 🎯
🧠 GEX-Based Options Analysis (For Option Traders)
SPY's current positioning in the options market reveals a heavy concentration of gamma and hedging pressure near 620. This level is acting as the Gamma Wall (Highest positive NETGEX / Call Resistance), which typically limits upside unless dealers are forced to unwind hedges.
* Call Walls sit densely at 622 and 624, with diminishing strength up to 626.25.
* Put Walls are stacked below at 618, 616, and most aggressively near 615.
* Notably, today's HVL expires at 620, adding pressure to keep price pinned around that level into the close.
* GEX readings are turning neutral to slightly bearish, with PUT flow dominating at 38.6% vs CALLS at 12.6%.
* IVR is still low at 11.3, which means option premiums are cheap — favoring debit strategies or directional plays if a breakout occurs.
Option Trade Ideas:
🟩 Bullish Setup (Break above 621.5)
Buy 622C or 624C (weekly or next Friday expiration).
Target: 626–628 (into light gamma zone), Stop below 620.
🟥 Bearish Setup (Break below 617.5)
Buy 618P or 615P, targeting 613–610.
Stop above 620. Time the move for IV expansion and gamma acceleration.
📈 Technical Analysis – 1-Hour Chart (For Intraday & Swing Traders)
The chart shows SPY compressing into a wedge pattern just above ascending trendline support from July 2nd. The price action is stuck between declining supply from the 626–628 rejection zone and strong demand at 617.88–615.
* Structure: Price has formed a CHoCH (Change of Character) at the top, followed by BOS confirming bearish pressure. However, price has been resilient above 617, building potential for a spring trap.
* Support: 617.88 → key zone. If lost, next support is near 613–610.
* Resistance: 622–624 remains the magnet for a breakout attempt if bulls take over.
* Volume: Declining, indicating a volatility expansion is likely soon.
Scenarios to Watch:
🔼 Bullish Breakout:
If price reclaims 621.50 and breaks above the recent wedge resistance, look for a squeeze toward 624 then 626. Use tight stops and look for volume confirmation.
🔽 Bearish Breakdown:
A clean break below 617.88 could unleash sellers toward 613. This aligns with GEX pressure and heavy PUT walls.
🧭 Final Thoughts
SPY is sitting on top of a coiled spring — both gamma and price structure are ready for release. This is not the time to guess; let price break from the wedge and follow the momentum. With IV still low and GEX polarity neutralizing, this is a perfect setup for directional options plays only after confirmation.
This analysis is for educational purposes only and does not constitute financial advice. Always do your own research and manage risk responsibly.

SPY July 7th 2025SPY July 7th 2025
Day 1 of journaling my day trades on SPY. I am going to start journaling my ideas every night if possible in order to fine tune my setup and to analyze my wins and losses. I will be using Renko (Traditional, 2 box size, 1m) as my main chart, Range Bars (50R, 100R, 200R, or 500R), and candle sticks (various timeframes) to identify supply/demand, price ranges, and trends - placing a high emphasis on volume as it applies to the Wyckoff Method. I will also occasionally refer to real time options charts and VIX, however I will primarily use those for my entries during the day.
Each day I will provide setups for a bullish and bearish bias, which should help minimize instances where the price moves against me - with slow reactions leading to holding losing trades and hesitating to enter a trade on the side of the new trend. I’ll try to come up with a consistent format as time goes on. For today, I will go down the list of my indicators and provide notes that fit the bias of each trading strategy.
+++++++++++++++++++++++++++
Bullish Analysis
Renko: Strong breakout from ascending channel on June 30. Fisher Transform is signaling continuation. A retest of the top of the channel would take the price back to ~$618.
100R ($1) Chart: Price is in an uptrend being supported by high volume. 34VWMA (purple) is above 200MA (green). The bounce on July 2nd (around $616) was supported by a high volume node, indicating genuine interest pushing the price higher.
30m Chart: Price closed on July 3rd at the top of an ascending channel inside of a larger ascending channel. Since the larger ascending channel is one of strength, it can be assumed that the smaller one is a sign of strength as well. A break too far below the lower end of this smaller channel would be a sign of weakness, which does not seem to fit the current market structure after last week’s breakouts, but it is still possible that the trend fails. Fisher transform is forming a “hook” pattern that can signal continuation.
+++++++++++++++++++++++++++
Bearish Analysis
On a smaller scale, the price appears due for a pullback, which can fit both the bullish and bearish trading ideas depending on where the market opens.
Renko: The price closed at the top of an ascending channel on July 2nd and will find more buyers upon a test of the lower band and the anchored VWAP.
50R (50¢) Chart: If the price pulls back to the bottom of the channel (around $620) this would coincide with a retracement of 0.618 - which is a key fib level. A break below the 1.00 extension ($616) could signal a break of the uptrend - a $9+ drop if an entry can be found near the top of the channel, not too bad.
5m Chart: The price left a gap down to $620 on July 3rd. Filling this gap could provide important liquidity to propel the price higher. Additionally, The high volume at the start and end of Thursday’s flat trading day (with low volume in between) could be a sign of accumulation or lack of sellers.
1DTE ATM Put, 2m: If a more prolonged (and profitable) downward move is expected from smart money, we should see volume increase for ATM puts during the session. Depending on where things open, we could see a potential spring/false bearish breakout (below $2.20), or a true bullish breakout (above $2.80). Using an options calculator, $623.75 on AMEX:SPY would set up the Spring and a drop below $622.50 could confirm the put breakout.
+++++++++++++++++++++++++++
Targets
Calls: Enter $618-$620, Target $625-$628, Stop Loss $617.75
Puts: Enter $623-$625, Target $620, Stop Loss $626.25
To conclude, overnight action on CME_MINI:ES1! and the gap up on TVC:VIX shows that the price is already retracing. The top of the wedge for VIX would be just above $20 - a key level to watch for a reversal. Unless the upper part of the channel on SPY is tested and rejected again after the open, I will sit out and wait to hit the bullish targets. We are still in a strong uptrend after last week’s breakouts, so going short is the riskier bet anyway, as buyers could step in at any time.
Looking at ATM calls and puts side by side (bottom two charts), it is clear that calls were not heading into today with a good setup. It would be worth taking a chance on puts if a Spring forms (below $2.20), which, again, would correlate with AMEX:SPY hitting $623.75 during the session - and not much higher.
My main idea for the start of this week is to look for a good pullback for calls, so I will be patient and will try not to force anything. If smart money has a bullish sentiment, there will still need to be a short accumulation phase for calls so I will watch to see what the chart is doing for ATM calls around $620.

SPY Approaches Gamma Wall-TA for July 10SPY Approaches Gamma Wall: Key Zones to Watch for Tomorrow’s Trade 🔥
GEX Options Sentiment Analysis:
SPY is currently hovering just below the major GEX resistance zone around 624–626, where the highest positive GEX and gamma wall overlap with strong call walls (52.17% and 41.33%). This region has historically capped upside momentum, so traders should prepare for potential rejection or breakout scenarios.
Downside has modest protection around 620 (HVL level), with negative GEX zones building near 619–617, marking a weak PUT wall. The lack of deep PUT dominance signals limited downside hedging pressure.
* IVR: 8.9 (low), IVx avg: 13.8
* Options Flow Sentiment: 24.1% PUTs
* GEX Bias: Mildly bullish unless 623 fails
Options Strategy Suggestions:
* If price breaks and holds above 626.5, consider buying CALL spreads (e.g., 626c/630c) targeting a gamma squeeze into 628+.
* If 623 breaks, look for short-dated PUT spreads (e.g., 623p/620p) targeting a fade back into 620 or even 617.
1-Hour Chart Price Action Analysis:
SPY has reclaimed a bullish posture after the CHoCH (Change of Character) on July 8 and is pushing into a supply zone just beneath the prior swing high. The price structure now forms a clean ascending channel, supported by higher lows and rising demand.
* Support Zones: 622.00, 620.34
* Resistance Levels: 624.72, 626.27
* BOS (Break of Structure): Confirmed earlier, adding bullish confluence
Watch for a breakout above the current supply zone to continue momentum toward 628+. However, failure to break and a rejection near 625 could lead to a retest of 620–622 as the next demand zone.
Trading Outlook for Thursday:
* Bullish Case: Break and close above 626 opens the door to a squeeze into 628+. Use pullbacks to 623–624.2 as entry zones.
* Bearish Case: Rejection at current levels with a breakdown below 622.5 could pull SPY into the 620.3 and possibly 617.9 levels.
* Scalp Setup: Long above 625 with tight stop below 623. Short below 622.5 targeting 620, risk above 624.
This analysis is for educational purposes only and does not constitute financial advice. Always manage risk and follow your own plan.

SPY Gamma Squeeze Fading – Key Put Wall Battles Ahead 🧨 GEX Options Sentiment (TanukiTrade GEX Chart)
* Current Price: 619.91
* Major Support Wall:
* GEX Cluster Support: 618 → 617 (Highest Negative Net GEX + 3rd PUT Wall)
* Additional GEX Floor: 616.37 (PUT support overlap with SMC zone)
* Resistance Levels:
* 625.34 → First CALL Wall
* 627 → 2nd CALL Wall
* 630 → Top of CALL Gamma Resistance
* Put Wall Dominance:
* GEX7–GEX10 blocks show heavy negative pressure (-47% to -66%) centered between 617–620
* Options Flow Insight:
* PUTS OI: 41.9% – Signaling downside hedges are still dominant
* IVR: 15.3 (low), IVX avg: 18.2 – Implied volatility suggests premium selling could get tricky unless directional trend returns
🔸 Interpretation:
This is a “put-heavy zone” — large GEX support clusters below price (617–618) are temporarily halting further drop, but unless SPY can reclaim 625.34, there's still gamma-driven downside risk.
🟢 1-Hour SMC Price Action
* Recent Structure:
* BOS confirmed → 626.27
* CHoCH to downside below 620 → confirmed rejection
* Current Setup:
* Price is hovering at minor demand between 617–620
* If 616.37 breaks, it opens room toward SMC demand zone at 604–606
* Strong resistance overhead at 625–627 (OB + GEX call wall + CHoCH retest)
🔸 Scenario 1 – Bullish Reclaim:
* Entry: Above 621
* Target: 625.34 → 627
* Stop: Below 616.00
* Setup: Break/retest of CHoCH + reclaim trendline
🔸 Scenario 2 – Bearish Breakdown:
* Entry: Below 616.37
* Target: 606 → 600
* Stop: Above 620
* Setup: Breakdown from demand + confirmed CHoCH retest
📌 Thoughts & Recommendations:
* Scalpers: Watch 620.50–621.00 as intraday pivot.
* If reclaimed, we may see short squeeze into 625–627
* Below 616.37, put flows will likely accelerate
* Swing Traders: Bearish bias unless 625.34 flips → consider spreads or directional puts
* Neutral Edge: This is a gamma battle zone — don’t overcommit, let price pick a side
Disclaimer: This analysis is for educational purposes only and does not constitute financial advice. Trade based on your risk profile and always use a stop-loss.

$SPY The BEAR flags are BACK!! AMEX:SPY Looking at bear flags on multiple time frames with an eye on a couple of potential support areas.

Nightly $SPY / $SPX Scenarios for July 11, 2025🔮 Nightly AMEX:SPY / SP:SPX Scenarios for July 11, 2025 🔮
🌍 Market-Moving News 🌍
🏦 Strong Bank Earnings Amid Tariff Churn
Next week’s Q2 forecasts point to robust earnings from U.S. banks—JPMorgan, Citi, Bank of America, Goldman Sachs, Morgan Stanley, and Wells Fargo—as trading and investment-banking revenue recover, offsetting uncertainties from ongoing tariffs
💬 Dimon Flags Fed Risk Pricing
JPMorgan’s Jamie Dimon cautioned that markets may be underestimating upside in interest rates. He sees a 40–50% probability of higher U.S. rates, driven by inflation from tariffs, migration, and fiscal deficits
⚖️ Tariff “Scattergun” Sparks Sector Disconnect
Trump’s plans to levy up to 200% tariffs on pharma and 50% on copper triggered uneven market reactions—copper prices rose 30% in six months, while European drugmakers remain flat, highlighting divergent sector sensitivities
📉 Tech & Macro Still Bullish
Despite policy turbulence, Nvidia climbed back above a $4 trillion valuation, and JPMorgan projects a $500 billion inflow into equities in H2—supporting gains even as broader macro pressures linger
📊 Key Data & Events
📅 Friday, July 11:
(No major U.S. economic data scheduled)
Markets will focus on bank earnings previews, tariff headlines, and the hold of the tech rally into a thin summer trading week.
⚠️ Disclaimer:
This information is for educational and informational purposes only and should not be construed as financial advice. Always consult a licensed financial advisor before making investment decisions.
📌 #trading #stockmarket #economy #tariffs #banks #tech #Fed #investing

Select Your Trading Time
There’s an old saying:
“Plan your trade, and trade your plan.”
But I want to add something even more important:
“Pick your time to trade.”
---
💰 The Market Is Not Your ATM
Everyone enters trading with one goal: make money.
Some even think of the market as an ATM — pull the handle, cash comes out.
But the truth is:
❌ The market doesn’t care about your goals
❌ It won’t move just because you need to make money today
This is a brutal game. And you don’t control the clock.
---
⚠️ When You Force a Trade...
Too many traders say:
“I have to make money today.”
“I need to hit $X this week.”
“I just took a loss, I must come back now.”
That kind of thinking leads to:
Bad entries
Overtrading
Emotional decisions
Big losses
❗ Trading success doesn’t come from forcing outcomes — it comes from waiting for the right moments.
---
🧠 What Happens on Low-Volatility Days
Let’s take today as an example.
SPY moved in a 2-point range all day.
No momentum, no trend, just chop.
Some traders:
Ran one QS signal after another
Forced trades just to feel busy
Got chopped up by fast reversals
Then blamed the signals
But here’s the truth:
AI or not , you can’t expect any long-volatility trade to work when the market is dead still.
The only winners on days like today? Market makers and options sellers.
---
❓ Why Trade at All on a Day Like This?
If the market isn’t offering opportunity,
Why force it? Why chase trades? Why burn your energy?
The smarter move is:
Sit out
Observe
Wait for better setups
Preserve your mental and financial capital
---
🔄 Recovery? Yes — But on Your Terms
Some traders lose money and say:
“I need to make it back today.”
That’s emotional revenge trading.
What if the market doesn’t give you a clean opportunity today?
Are you still going to go all-in, out of frustration?
❌ That’s not a strategy. That’s gambling.
---
📍 QS Signals Are a Map — Not a Magic Button
QS AI signals help you find opportunities — but even the best map won’t help if:
You're in the wrong city (bad market environment)
You’re rushing without checking road conditions (volatility, news, timing)
Even with QS, you don’t have to trade every day, every hour.
---
✅ What You Should Do
Be patient
Respect market conditions
Take a break on slow or tricky days
Come back when the odds are in your favor
---
🧘♂️ Final Words
You don’t have to win every day.
You don’t have to trade every day.
You don’t even have to be active to be successful.
🎯 Trade less. Trade smarter. Select your time wisely.
That’s how real traders survive and thrive in this game.
SPY/QQQ Plan Your Trade End Of Week Update For 7-4Happy 4th of July
I've been very busy with projects and new tools for traders, as well as the new book I'm working on, and thought I would deliver an End Of Week update for everyone.
In this video, I cover the past Cycle Patterns and how they played out for the SPY/QQQ, Gold/Silver, and Bitcoin, as well as add some of my own insight related to the market trends.
All of my systems are still LONG and have not changed. I still believe this market is extremely overbought, and I believe it could roll over at any moment into a pullback - but we need to wait to see if/when that may/does happen.
Gold made a big move higher this week, and I believe that move could continue throughout July.
Bitcoin made a surprising Double-Top and is not rolling downward. Could be a breakdown in the markets as BTCUSD tends to lead the QQQ/NQ by about 3-5 days.
The SPY/QQQ rallied like a rocket all week. It was absolutely incredible to see the markets rally like this. But, I'm still cautious of a sudden rollover top.
I managed to catch some nice trades with options spreads this week, and my metals positions were on fire. I'm still trading from a "hedge everything" mode as I don't trust this rally, and I'm still watching for REJECTIONS near these new highs.
Stay safe and GET SOME.
DM me if you have any questions.
#trading #research #investing #tradingalgos #tradingsignals #cycles #fibonacci #elliotwave #modelingsystems #stocks #bitcoin #btcusd #cryptos #spy #gold #nq #investing #trading #spytrading #spymarket #tradingmarket #stockmarket #silver

Nightly $SPY / $SPX Scenarios for July 10, 2025🔮 Nightly AMEX:SPY / SP:SPX Scenarios for July 10, 2025 🔮
🌍 Market-Moving News 🌍
🏦 Global Banks Profit from Tariff Volatility
Major banks like JPMorgan, BofA, and Citigroup are expected to see ~10% growth in trading revenue in Q2, fueled by volatility from President Trump’s tariff policy shifts. Treasury trading volumes hit record highs as markets priced in policy swings
📈 S&P 500 Nears Lull Amid Bull Market Strains
Despite record highs in 2025, investors are warning that the rally may be reaching its limit. Bullish sentiment is strong, but analysts caution that sluggish consumer spending, rising inflation from tariffs, and few rate-cut signals from the Fed could cap downside momentum
🐻 Bear Case Gains Ground
Stifel’s Barry Bannister projected a potential ~12% correction in the second half of 2025. Key risks include slowing consumer spending, weak capital investment under tariff uncertainty, and persistent core inflation above 3%, negatively impacting earnings and growth outlooks
⚖️ “One Big Beautiful Bill” Could Add Trillions in Debt
The new fiscal package signed July 4 will add $3–4 trillion to national debt over the next decade while extending tax cuts and revising EV incentives. Bond market and Fed policy implications may become more pronounced if growth fails to keep pace
📊 Stocks vs Bonds: Diverging Signals
While equities climb and megacaps extend gains, Treasury yields have risen five days straight—signaling growing caution over real growth prospects. The yield curve steepening hints at mixed signals: growth optimism in stocks, but bond market signaling economic risk ahead
📊 Key Data & Events
📅 Thursday, July 10:
No major scheduled economic releases. Markets remain driven by tariff headlines, bank earnings reactions, and evolving Fed signals.
⚠️ Disclaimer:
This is for informational and educational purposes only—not financial advice. Consult a licensed advisor before making investment decisions.
📌 #trading #marketvolatility #tariffs #banks #Fed #debt #technicalanalysis

$SPY $SPX to 5650 Realistic pull back target AMEX:SPY SP:SPX Realistic pull back target. It’s been a while since I gave a good 5 year volatility based pullback target. 😏
Let’s take a look back in August. 5655 for SPX, 563 SPY

Debugging Pine Script with log.info()log.info() is one of the most powerful tools in Pine Script that no one knows about. Whenever you code, you want to be able to debug, or find out why something isn’t working. The log.info() command will help you do that. Without it, creating more complex Pine Scripts becomes exponentially more difficult.
The first thing to note is that log.info() only displays strings. So, if you have a variable that is not a string, you must turn it into a string in order for log.info() to work. The way you do that is with the str.tostring() command. And remember, it's all lower case! You can throw in any numeric value (float, int, timestamp) into str.string() and it should work.
Next, in order to make your output intelligible, you may want to identify whatever value you are logging. For example, if an RSI value is 50, you don’t want a bunch of lines that just say “50”. You may want it to say “RSI = 50”.
To do that, you’ll have to use the concatenation operator. For example, if you have a variable called “rsi”, and its value is 50, then you would use the “+” concatenation symbol.
EXAMPLE 1
━━━━━━━━━━━━━━━━━━━━━━━━━━━━━━━━━
//@version=6
indicator("log.info()")
rsi = ta.rsi(close,14)
log.info(“RSI= ” + str.tostring(rsi))
Example Output =>
RSI= 50
Here, we use double quotes to create a string that contains the name of the variable, in this case “RSI = “, then we concatenate it with a stringified version of the variable, rsi.
Now that you know how to write a log, where do you view them? There isn’t a lot of documentation on it, and the link is not conveniently located.
Open up the “Pine Editor” tab at the bottom of any chart view, and you’ll see a “3 dot” button at the top right of the pane. Click that, and right above the “Help” menu item you’ll see “Pine logs”. Clicking that will open that to open a pane on the right of your browser - replacing whatever was in the right pane area before. This is where your log output will show up.
But, because you’re dealing with time series data, using the log.info() command without some type of condition will give you a fast moving stream of numbers that will be difficult to interpret. So, you may only want the output to show up once per bar, or only under specific conditions.
To have the output show up only after all computations have completed, you’ll need to use the barState.islast command. Remember, barState is camelCase, but islast is not!
EXAMPLE 2
━━━━━━━━━━━━━━━━━━━━━━━━━━━━━━━━━
//@version=6
indicator("log.info()")
rsi = ta.rsi(close,14)
if barState.islast
log.info("RSI=" + str.tostring(rsi))
plot(rsi)
However, this can be less than ideal, because you may want the value of the rsi variable on a particular bar, at a particular time, or under a specific chart condition. Let’s hit these one at a time.
In each of these cases, the built-in bar_index variable will come in handy. When debugging, I typically like to assign a variable “bix” to represent bar_index, and include it in the output.
So, if I want to see the rsi value when RSI crosses above 0.5, then I would have something like:
EXAMPLE 3
━━━━━━━━━━━━━━━━━━━━━━━━━━━━━━━━━
//@version=6
indicator("log.info()")
rsi = ta.rsi(close,14)
bix = bar_index
rsiCrossedOver = ta.crossover(rsi,0.5)
if rsiCrossedOver
log.info("bix=" + str.tostring(bix) + " - RSI=" + str.tostring(rsi))
plot(rsi)
Example Output =>
bix=19964 - RSI=51.8449459867
bix=19972 - RSI=50.0975830828
bix=19983 - RSI=53.3529808079
bix=19985 - RSI=53.1595745146
bix=19999 - RSI=66.6466337654
bix=20001 - RSI=52.2191767466
Here, we see that the output only appears when the condition is met.
A useful thing to know is that if you want to limit the number of decimal places, then you would use the command str.tostring(rsi,”#.##”), which tells the interpreter that the format of the number should only be 2 decimal places. Or you could round the rsi variable with a command like rsi2 = math.round(rsi*100)/100 . In either case you’re output would look like:
bix=19964 - RSI=51.84
bix=19972 - RSI=50.1
bix=19983 - RSI=53.35
bix=19985 - RSI=53.16
bix=19999 - RSI=66.65
bix=20001 - RSI=52.22
This would decrease the amount of memory that’s being used to display your variable’s values, which can become a limitation for the log.info() command. It only allows 4096 characters per line, so when you get to trying to output arrays (which is another cool feature), you’ll have to keep that in mind.
Another thing to note is that log output is always preceded by a timestamp, but for the sake of brevity, I’m not including those in the output examples.
If you wanted to only output a value after the chart was fully loaded, that’s when barState.islast command comes in. Under this condition, only one line of output is created per tick update — AFTER the chart has finished loading. For example, if you only want to see what the the current bar_index and rsi values are, without filling up your log window with everything that happens before, then you could use the following code:
EXAMPLE 4
━━━━━━━━━━━━━━━━━━━━━━━━━━━━━━━━━
//@version=6
indicator("log.info()")
rsi = ta.rsi(close,14)
bix = bar_index
if barstate.islast
log.info("bix=" + str.tostring(bix) + " - RSI=" + str.tostring(rsi))
Example Output =>
bix=20203 - RSI=53.1103309071
This value would keep updating after every new bar tick.
The log.info() command is a huge help in creating new scripts, however, it does have its limitations. As mentioned earlier, only 4096 characters are allowed per line. So, although you can use log.info() to output arrays, you have to be aware of how many characters that array will use.
The following code DOES NOT WORK! And, the only way you can find out why will be the red exclamation point next to the name of the indicator. That, and nothing will show up on the chart, or in the logs.
// CODE DOESN’T WORK
//@version=6
indicator("MW - log.info()")
var array rsi_arr = array.new()
rsi = ta.rsi(close,14)
bix = bar_index
rsiCrossedOver = ta.crossover(rsi,50)
if rsiCrossedOver
array.push(rsi_arr, rsi)
if barstate.islast
log.info("rsi_arr:" + str.tostring(rsi_arr))
log.info("bix=" + str.tostring(bix) + " - RSI=" + str.tostring(rsi))
plot(rsi)
// No code errors, but will not compile because too much is being written to the logs.
However, after putting some time restrictions in with the i_startTime and i_endTime user input variables, and creating a dateFilter variable to use in the conditions, I can limit the size of the final array. So, the following code does work.
EXAMPLE 5
━━━━━━━━━━━━━━━━━━━━━━━━━━━━━━━━━
// CODE DOES WORK
//@version=6
indicator("MW - log.info()")
i_startTime = input.time(title="Start", defval=timestamp("01 Jan 2025 13:30 +0000"))
i_endTime = input.time(title="End", defval=timestamp("1 Jan 2099 19:30 +0000"))
var array rsi_arr = array.new()
dateFilter = time >= i_startTime and time <= i_endTime
rsi = ta.rsi(close,14)
bix = bar_index
rsiCrossedOver = ta.crossover(rsi,50) and dateFilter // <== The dateFilter condition keeps the array from getting too big
if rsiCrossedOver
array.push(rsi_arr, rsi)
if barstate.islast
log.info("rsi_arr:" + str.tostring(rsi_arr))
log.info("bix=" + str.tostring(bix) + " - RSI=" + str.tostring(rsi))
plot(rsi)
Example Output =>
rsi_arr:
bix=20210 - RSI=56.9030578034
Of course, if you restrict the decimal places by using the rounding the rsi value with something like rsiRounded = math.round(rsi * 100) / 100 , then you can further reduce the size of your array. In this case the output may look something like:
Example Output =>
rsi_arr:
bix=20210 - RSI=55.6947486019
This will give your code a little breathing room.
In a nutshell, I was coding for over a year trying to debug by pushing output to labels, tables, and using libraries that cluttered up my code. Once I was able to debug with log.info() it was a game changer. I was able to start building much more advanced scripts. Hopefully, this will help you on your journey as well.

SPY should continue downSPY bounces will likely be sold but it needs to break 618 for any real down move. Gold, stuck between support and resistance. USOIL at resistance. NG, difficult to say what is happening. BTC may pop the highs but it would likely be a false break.

$SPY Today’s Trading Range and everything in it /// 7.11.25Beautiful start here right at the bottom of the expected move for the day.
Today’s Trading range and everything in it. How are you playing it?

