SPY A Fall Expected! SELL!
My dear friends,
SPY looks like it will make a good move, and here are the details:
The market is trading on 566.62 pivot level.
Bias - Bearish
Technical Indicators: Supper Trend generates a clear short signal while Pivot Point HL is currently determining the overall Bearish trend of the market.
Goal - 542.79
Recommended Stop Loss - 579.54
About Used Indicators:
Pivot points are a great way to identify areas of support and resistance, but they work best when combined with other kinds of technical analysis
Disclosure: I am part of Trade Nation's Influencer program and receive a monthly fee for using their TradingView charts in my analysis.
———————————
WISH YOU ALL LUCK
SPY trade ideas

Spy.. The wedgesRemember this, when it comes to technical analysis, anything that goes up really fast form's a rising wedge most of the time and anything that drops quickly form's a falling wedge.
The Spy has risen 12% since April 21 and after this week i we will give half back and head to 533-535.
As you know market goes no where without tech..
So I'll just show you the proce action of the biggest tech sectors
AMEX:XLK
AMEX:XLC
NASDAQ:SMH
And lastly NASDAQ:QQQ
A big red flag in addition to that wedge is the RSI Divergence since April 23 shown on qqq 1hour rsi
Seeing Divergence is like noticing Ball tires; you don't know the exact date the tires will bust but you know it's coming and you just hope your aren't driving (In calls).
This is Qqq daily chart..
200sma purple line
Red line 20sma
We closed right below 200 day but we are 7% away from the 20sma.. qqq usually extended 4-5% from the 20sma before retesting it.
So long story short stay away from tech calls !
2 reasons I think the Spy can make another high this week.
1. Vix still has a gap to close at 21.50
Fallen wedge here, not surprising, vix pattern is usually opposite of spy. I think an explosive moves comes soon here
2. Dow jones , XLF and IWM have the April 2nd liberation day gap to close ..
The dow jones gap is 2% wide, that means another 800pts up. You ever seen the dow pump 800pts and the Spy not go up? Me neither
So I think unless Spy breaks back below 560 early in the week we could melt up to 572-575.
With no big tech earnings that pop up would likely come from FOMC wed..
Whatever intra week high the market makes, I don't think it will close near it.. what I mean is, let's say Spy spike to 572 wed I think we will close the week 560 or lower
Becareful Swinging calls, with all these tech sectors showing a rising wedge I'm sure some of these tech names reporting will disappoint.
Lots of low volume chop early in the week.. count me out until Wed
Bigger picture
Unless we break 530 we aren't headed to 510.. if we break below 510 then 495 will come.. below 495 is death
If we close the week above 585 somehow then we are headed back to 610
Lastly
Es 4hour chart
Cleanest look here. Yellow trendline represents higher lows.
When we break rising wedge I will short to Yellow trendline

SP500 ETF: Fibonacci MappingAs you may know, Williams Fractals indicator identifies potential reversal points by marking a high (or low) surrounded by two lower highs (or higher lows) on each side, forming a five-bar pattern that signals possible turning points in price. Unfortunately, the simplicity of such indicator provides just tiny perspective, undermining broad implication of the concept.
Before I begin diving into processing geometric narrative of emerging price via fibonacci channels, I want to explain how I interpret fractals.
When I use the term "fractal", I'm not just talking about the points alone. Market continuously corrects itself, so analyzing it by price alone can bring more confusion than help. The object of observation shouldn't be limited to quantifying just by a single property. Chaos by default requires awareness from both price and time aspects. The easiest way to root it in my vision was through realization that price is a function of trading time intervals. Its activity can be described as cyclical progression, as if it is wired by multiple "springs" of different tensions.
Classic TA patterns known to literally anyone are great for anticipating a move in surface level forecasts. Since my line of work focuses on prediction over forecasts, it requires deeper structural awareness behind complex oscillations.
Let's observe the way selloff scales from ATH and how it impacts fractal hierarchy.
The first corrective bullish wave can be explained as a reaction to initial impulsive bearish wave. The bigger scale drop from ATH to a lower point explains why the corrective bullish wave looks the way it is. And so on:
In fractals, scaling laws describe how key properties change with size, typically following power-law relationships that reflect the structure’s self-similarity, where a characteristic scales with the size raised to an exponent.
To build a probabilistic model, we must keep in mind how the smaller bits make up bigger scale picture. ATH, established bottom and angle of progression defined by pullback highs, all those points have structural weight. Since psychology of masses that shapes price dynamics is governed by mathematical sequences found in nature, it's fair to use Fibonacci Channels to map the geometry of interconnectedness.
Similarly, all of those points can be referred by another fibonacci channel with opposite direction.
From my perspective, traditional TA patterns reflect just phases of cycle, this is why I unify those fragments into broader scalable shapes. This distinctive branch of Fractal Analysis allows to track systematic aspects of market behavior and explains how a pattern replicates itself in rhythmic continuity.

$SPY Possible simulation with COVID, Bottom at 495 then ATH 630Lowest RSI since COVID , highest daily volume for years! but if copy the wave of COVID drop we can see some similarities. bottom by 2nd week April at 495 then consolidation at 530 then up and fighting zone between 550-560 then up and small top on June/July then All time high in Sep at 630. the idea, take long dated strangles options

SPY will make new highs in coming weeks to monthsI decided to swap to the weekly view and found the 3 most bullish candlestick patterns all appearing in the month of April.
1st: Piercing Pattern:
This occurred on the week following Liberation day. The piercing pattern occurs when price closes above the midpoint of the prior weeks red bar after opening below the low of the previous week.
It signals that the price action was very emotional and reactionary, gapping below the low the a strong downtrend, it then signals that buyers were committed to recapture a majority of the price action. It also indicates that there may be trapped bears and short positions that were opened at the low, this can squeeze price higher.
2nd: Bullish Engulfing
This occurred the week last week. It is a classic pattern that signals to turn bullish. It occurs when the green bar fully engulfs the previous weeks red bar.
It signals that the price action was able to make a new low, this is important as similar to the piercing pattern it indicates there may be trapped bears/shorts who will be squeezed and forced to capitulate. It also indicates that the bulls were able to make new highs breaking out of the previous weeks range.
3rd: 3 Outside and up
This just occurred to end this week. It is a rare follow-up to the bullish engulfing, it is defined by a bullish engulfing that has a following week with a close strongly above the engulfing candles high.
It signals that the engulfing candle had commitment and follow-through, it signals that bears were unable to stop the trend and are at the point of capitulation. Many bullish engulfing patterns can lead to consolidation or weekly doji candles, or the less frequent reversals if bears are strong. the 3 Outside and up confirms that the bullish movement is strong.
This was a very difficult month to trade with a ton of traps, I expect there will be more traps and pullbacks to come, but the big picture is bullish.

SPY: Bear Market Rally Near Completion?Wavervanir DSS | April 30, 2025
SPY is approaching a critical reversal zone at the 0.786 Fibonacci retracement level (~$563.33), following a sharp bounce from the March lows at $481.80. Price is now testing overhead supply from a prior breakdown, and a rejection here aligns with both technical exhaustion and deteriorating macro conditions.
🔍 Technical Breakdown
Resistance Zone: $563.33 (Fib 0.786) – Strong potential reversal point.
Bearish Targets:
$500 (Fib 0.786 from Jan–Mar leg)
$481.80 (prior low)
$431.45 (Fib 1.382 extension)
Structure: ABC corrective wave likely playing out with lower highs forming.
Volume: Momentum on the rally is weakening—bearish divergence setting in.
🧠 Macro Alignment
Sticky Inflation and high real yields persist.
Fed expected to hold rates steady in May (no pivot).
Earnings and forward guidance remain mixed, with cracks showing in consumer credit and regional banks.
Soft landing narrative is fading unless CPI or labor data surprises to the downside.
📊 Probability Estimate
Bearish Reversal (to $431.45): 65%
Bullish Continuation (to $598.51): 25%
Sideways Chop (532–563 range): 10%
⏳ Watch for confirmation below $547 to validate the reversal.
📉 If 563 holds, downside may accelerate into summer.
🧠 WaverVanir DSS remains net short while volatility remains structurally elevated.
💬 What’s your play? Bull trap or breakout?
#SPY #S&P500 #TechnicalAnalysis #Macro #TradingView #Fibonacci #BearMarket #RecessionRisk

SPY WEEKLY 2ND MAY 2025Welcome to Spy weekly. I have clearly discussed the price action. If you have any doubts, feel free to leave a comment or DM me.
NOTE:DO NOT SHORT

SPY Trade Idea 4/24Currently ranging from 510s to 545s
Keep tight stop due to 548 to 562 gap
Let me know what you think
Have a great day

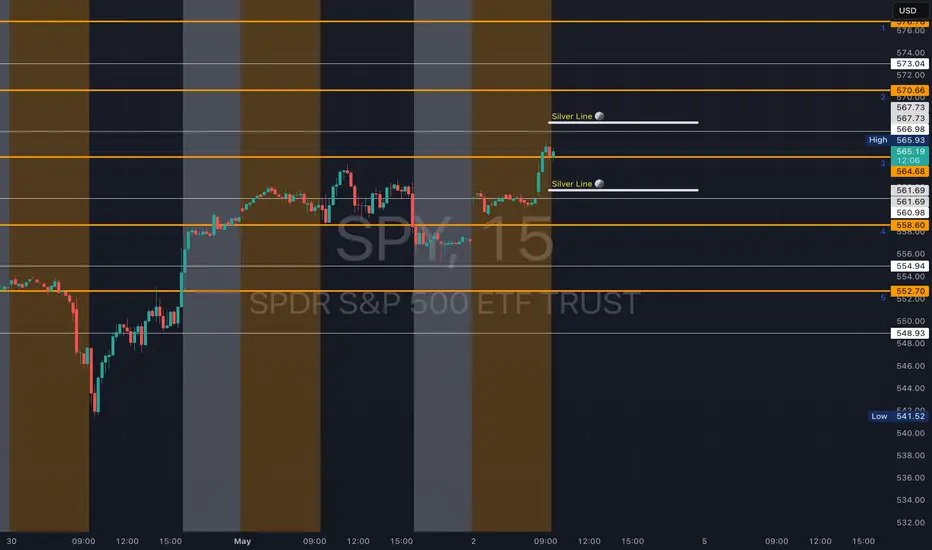
SPY - support & resistant areas for today May 2 2025These are Support and Resistance lines for today, May 2nd, 2025, and will not be valid for the next day. Mark these in your chart by clicking grab this below.
Yellow Lines: Heavily S/R areas, price action will start when closing in on these.
White Lines: Are SL, TP or Mid Level Support and Resistance Areas, these are traded if consolidation take place on them.
Silver Lines: An Area where price action could happen and do work on a choppy day.
$SPY Trapped in a Bear Gap - May 2 2025 contract AMEX:SPY
How interesting that we traded completely within the bear gap yesterday .
First time above the 50 Day moving average in quite a while. 50 Day MA pointing us lower along with the 1hr underneath us.
Let’s go. Today’s Range looks like a fun way to close the week.


SP500 Entanglement of Macro Price ActionFib interconnectedness of 2 complete macro cycles
Linear coverage of the market derived from the structure:
Dot com bubble cycle ⌒ Low (march '94) ➡️ Peak '00 ➡️ Crisis bottom
Housing cycle ⌒ Low '02 ➡️ Peak '07 ➡️ Low March '09

SPY/QQQ Plan Your Trade Update : Behind The Scenes ResearchI want to say thank you to all of you and to share with you all the work/resources/servers/and other data I maintain to help me identify where and how the markets will present opportunities to all of us.
This video shows you a bit of the behind-the-scenes work I do and some of my proprietary modeling systems.
I'm not sharing this with you to try to win you over or to tell you I do more than anyone else in terms of research. I'm sure there are many others who go much further than I do in terms of trying to dissect the markets and the opportunities available.
But I do believe I deliver very unique research, which is a one-of-a-kind solution for traders.
Again, I'm not 100% accurate (I wish I were).
But I am trying to share some of the decision-making solutions I use to understand where the markets are likely to move over the next 2- 4+ months and how traders can profit from my research.
Remember, you are only seeing about 10% of my total research, tools, modeling systems, and capabilities in these Plan Your Trade videos.
I want to thank all of you who continue to value my work. It is not easy. It takes money, time, and resources to continue to monitor all of these systems/algos.
The end result, I believe, is one of the most unique future/current modeling system resources you can find anywhere.
Again, thank you for making my research a success. I promise to do more and improve my tools over the next 12+ months for everyone to find better profits.
Get some.
#trading #research #investing #tradingalgos #tradingsignals #cycles #fibonacci #elliotwave #modelingsystems #stocks #bitcoin #btcusd #cryptos #spy #gold #nq #investing #trading #spytrading #spymarket #tradingmarket #stockmarket #silver

Elliott Wave top on SPY’s monthly chartTechnical Analysis:
Wave Structure (Elliott Wave)
• Wave 1–2: Early 2020 correction (COVID crash) marked a clear wave 2 bottom.
• Wave 3: Strong impulsive rally from mid-2020 to late 2021 — massive liquidity-driven.
• Wave 4: 2022–2023 pullback — clean retracement to ~0.382 Fib, validating wave structure.
• Wave 5: Parabolic final rally peaking around $550–560 (currently topping or topping out).
Bearish Signals:
• Volume divergence — Price up, but monthly volume flat-to-declining. Distribution behavior.
• Completed 5-wave structure — Indicates exhaustion.
• (A)-(B)-(C) Correction Starting: The projection shows:
• Wave A targeting ~$420–440.
• Wave B dead cat bounce.
• Wave C projecting a deeper correction into $300–340 zone (around 0.5 to 0.618 retracement).
Fibonacci Confluence Zones:
• 0.382 = ~$450
• 0.5 = ~$390
• 0.618 = ~$340
These zones will act as major liquidity pools for institutional entries or macro rebalancing.
Macro Headwinds Fuel the Narrative:
• Sticky inflation
• Rising interest payments on U.S. debt
• Deteriorating liquidity (QT regime)
• Over-leveraged consumer and commercial debt sectors

Nightly $SPY / $SPX Scenarios for May 2, 2025🔮 Nightly AMEX:SPY / SP:SPX Scenarios for May 2, 2025 🔮
🌍 Market-Moving News 🌍
🇺🇸 Rising Unemployment Claims Signal Labor Market Softening
Initial jobless claims increased by 18,000 to 241,000 for the week ending April 26, marking the highest level since late February. Continuing claims also rose to 1.916 million, indicating potential cracks in the labor market.
🏭 Manufacturing Sector Contracts Amid Tariff Pressures
The ISM Manufacturing PMI fell to 48.7 in April from 49.0 in March, indicating a second consecutive month of contraction. Tariffs on imported goods have strained supply chains and elevated input prices, contributing to the downturn.
📉 Construction Spending Declines
Construction spending decreased by 0.5% in March, reflecting reduced investments in both residential and nonresidential projects. This decline suggests caution in the construction sector amid economic uncertainties.
📊 Mixed Signals from Manufacturing Indices
While the ISM Manufacturing PMI indicates contraction, the S&P Global Manufacturing PMI remained steady at 50.2 in April, suggesting stability in some manufacturing segments despite broader challenges.
📊 Key Data Releases 📊
📅 Friday, May 2:
💼 Nonfarm Payrolls (8:30 AM ET)
Provides insight into employment trends and overall economic health.
📈 Unemployment Rate (8:30 AM ET)
Measures the percentage of the labor force that is unemployed and actively seeking employment.
💰 Average Hourly Earnings (8:30 AM ET)
Indicates wage growth and potential inflationary pressures.
🏭 Factory Orders (10:00 AM ET)
Reflects the dollar level of new orders for both durable and nondurable goods, indicating manufacturing sector strength.
⚠️ Disclaimer:
This information is for educational and informational purposes only and should not be construed as financial advice. Always consult a licensed financial advisor before making investment decisions.
📌 #trading #stockmarket #economy #news #trendtao #charting #technicalanalysis

SPY at 3 important event! POC, 200 ema and 30 days reversalHi All SPY is at an interesting intersection:
1) a month from where it crashed and reversed entirely
2) At point of control (POC) from the top in Feb
3) at 200 ema
In Aug 22 SPY reversed from POC, at other times it found support or broke out with a gap
My opinion is, it will continue going up till 13th May (date when CPI is published). Nobody knows for sure how much tariff will impact CPI. It cannot as bad as we had during covid.

SPY Day Trade Plan for 05/01/2025SPY Day Trade Plan for 05/01/2025
📈 562.70 565.60
📉 557 554.30
Thanks to all my followers! Truly appreciate the support!
Please like and share for more ES/NQ levels Tues & Thurs 🤓📈📉🎯💰
*These levels are derived from comprehensive backtesting and research and a quantitative system demonstrating high accuracy. This statistical foundation suggests that price movements are likely to exceed initial estimates.*

SPY Day Trade Plan for 04/29/2025SPY Day Trade Plan for 04/29/2025
📈 550 553 556
📉 544 543 540.50
Thanks to all my followers! Truly appreciate the support!
Please like and share for more ES/NQ levels Tues & Thurs 🤓📈📉🎯💰
*These levels are derived from comprehensive backtesting and research and a quantitative system demonstrating high accuracy. This statistical foundation suggests that price movements are likely to exceed initial estimates.*
SPY .. Using Fibs a bit differently, like in Reverse squaredSo most people are used to the typical, "drag from bottom to a top or top to bottom and see where the percentages(ratios) lay"...well I kinda did it a little differently....as my name suggests, its a psychotic technique...but it hit some funky levels eh?
You take a high to a high, or in this case a low to a low and then you use the reverse function on the settings to show what it would be like:
Theory-- To understand a fib retrace you have to retrace something, but what if the bottom you are looking at may not be a true corrective bottom. Well, pick to pivot bottoms, as seen above and then connect them. But the reverse function allows for the "retace" to be calculated for another set of bottoms to come or if you may be at a new high peak.
Its by no means random cause you are following a retrace but using a multiplier and two pivots (be them highs or lows) to see what the mathematical nature of those two lows mean to your future charting. As follows... are those two lows I used really worth using for further analysis, well seeing how many times those fib lines hit seriously important places, they can be. But also, it means that you can connect those two and then do other funky things with them, which I will show below, to check "angular Fib Channeling" for future price action levels too.
If it all makes no sense, then answer me this,....you ever do something so out of the ordinary one day and something just clicked into place- like weirdly accurately; you find out there was an entirely different way to go about the thing you did and it arrives at the same mathematical conclusion...that is what I excel in- finding the weird, but working ideas.
4hr view:
angular Fib Channeling on the daily and 4hr respectively:
and the more funky way using algorithmic numeration with Fib Channeling:
(same blue arrows as previous fib channel regular settings, but changed numbers to my own mathematically derived...see what I mean that math can get you to the same place even with many different avenues of choice available)
-------
and lastly...to find angles if you arent able to:
You use the date and time combo measuring tool to find the exact square of two pivots you want to check the angle of...you go from the one point to the other, and then drop down along the same vertical of point two until you get to the exact value price of point one. Then you simple use the fib tool to set the angle from point one to two, then drop down vertically to the third point and there you go...see, works quite nicely...also using my custom number again:
4hr:

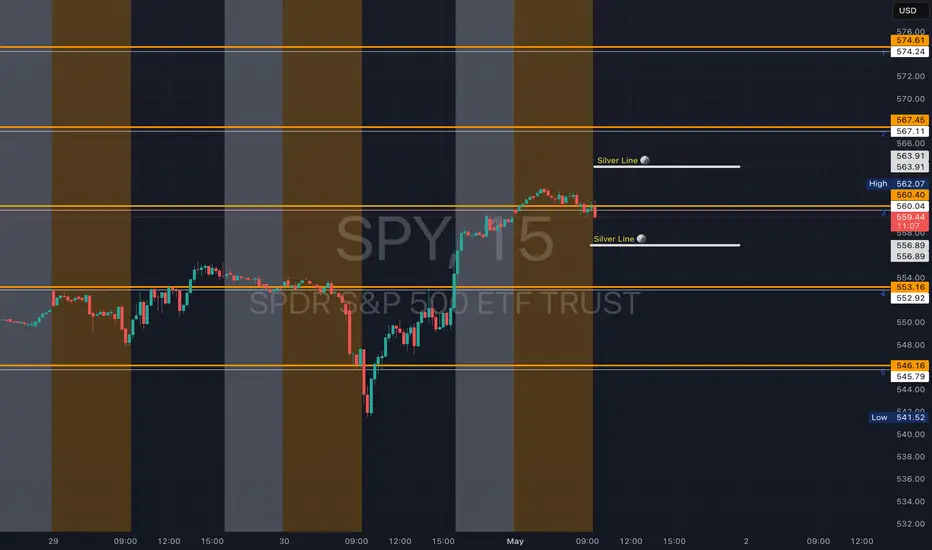
SPY - support & resistant areas for today May 1 2025These are Support and Resistance lines for today, May 1st, 2025, and will not be valid for the next day. Mark these in your chart by clicking grab this below.
Yellow Lines: Heavily S/R areas, price action will start when closing in on these.
White Lines: Are SL, TP or Mid Level Support and Resistance Areas, these are traded if consolidation take place on them.
Silver Lines: An Area where price action could happen and do work on a choppy day.
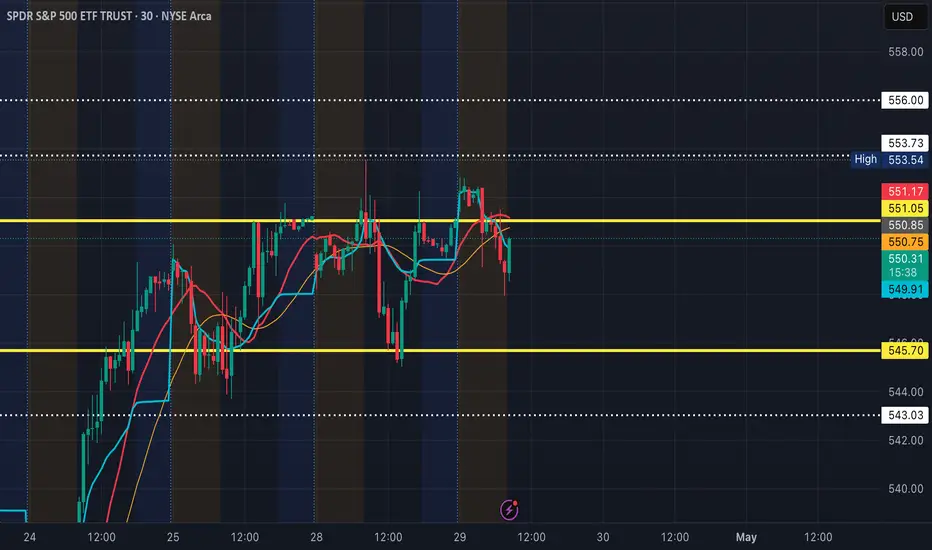
SPY - short-term analysishi traders,
Let's have a look at SPY on 1h time frame.
As we can see the price created a double bottom and with the catalyst (Trump paused tariffs), the price pumped 11%.
It's approaching the resistance area and bulls are not out of the woods yet.
I expect a short-term pullback.
RSI is very overbought in 15 15-minute time frame which confirms this thesis.
Entry, target, and stop loss are shown on the chart.
Risk-reward ratio: 3,13

A perfect masterpiece - my final trade & mic dropHello friends. I have found the perfect trade, and I went all in with my entire account because my conviction is so high that I can say I'm 99.9% sure that I will be correct. I have never been this confident about a trade in my entire career to date.
I have purchased six figures in put contracts on the SPY and SPX because I can see that a crash is about to happen. Here are a few of the factors that I am looking at which have made me so confident.
1) Retail is frantically buying the dip as well as the rip, and they are almost always wrong & lose money. Meanwhile, smart money has been selling this whole time.
2) My wave theory shows a clear WXY pattern that has now been completed. We can't currently be in an impulsive wave to the upside because there is too much overlapping.
3) Trade deal is NOT coming soon. Polymarket predicts only 19% odds for a US-China trade deal to happen before June. The tariff situation does not look good, and it isn't priced in anymore as we have retraced the entire tariff dump already.
4) The market is currently trading far above liquidity based fair value, which has been plummeting in recent weeks indicating that a drop is bound to happen soon for risk prices. To reach the fair price, the SPY should trade about 30% lower than current prices. This gives us enormous room for a cascade to the downside.
