Inflation Adjusted Market Valuation since 2007 max liquidityHere's a loose estimation (using basic compound interest over time delta) of what the market would be worth with adjusted inflation if liquidity remained constant since 2007. Inflation adjusted value estimated through the yearly growth % of the market adjusted for inflation and averaged with general inflation trends from 2000-2025 at a ~85% inflation, year by year avg 85/25 = ~3.4%.
(hard to get exact numbers so include a +-10% error at a 90% confidence interval)
What does this tell us? We are above peak value of 520, in consideration of the stimulus being applied over time in buy backs and inflating the market over the last 15+ years, we have a high probability chance that we are at peak investment liquidity and upward movement can be delayed for the next 5-10 years in the form of a major correction to market valuation.
1 minute ago
Trade active
Inf Est since 2007 using adjusted 6.7% year by year inflation
Peak Yr 2007 2015 2020 2022 2025
M.Val 162 213 340 475 613
Inf Est 0 272 376 428 520
Why does the M. Val eventually exceed the Inflation Estimated Value?
Consider the buy backs from stimulus that entered the market after GFC.
1) In no way will they max out on buy backs immediately
2) Buy backs over time guarantee consistent upward market price movement
3) That stimulation is not included in the Inf Est
a. The Inflation Est is simply the max value in 2007 and its inflated relation today
b. The Inflation Est is a control value that only shows existing liquidity in market
At the time of 2007 excluding buy back stimulus event
SPY trade ideas

Spy Game Plan for today If the market continues its bullish momentum, we could see a retest of the 200-day moving average around $570. This level will act as key resistance, and a breakout above could open the door for new highs. However, if Powell’s tone leans hawkish or the minutes reflect a more cautious stance on rate cuts, we could see AMEX:SPY crack below its current trendline. In that scenario, look for potential support and a bounce around the low $550s—specifically in the $552–$550 zone.

SPY Levels Heating Up! Is This Just a Cool-Off or a Pullback?🧊So here’s what I’m seeing on SPY after reviewing the daily, 1H, and options GEX flow. I like to keep it real — not overhyped, just what I think might actually matter if you're trading this week.
📉 Technical Setup (Daily & 1H View)
* We’ve been in this steady grind higher, breaking out of the downward channel.
* Price is stalling a bit near 558–563 zone — that’s a tough area, and it makes sense since it lines up with prior resistance.
* MACD on the daily is still bullish but starting to flatten, and the Stoch RSI looks like it wants to cool off from overbought.
* On the hourly, momentum is clearly slowing down — we’re seeing lower highs and weakening MACD. If 558 breaks, I’d expect some quick downside.
🧠 GEX (Gamma Exposure) Breakdown
* The Highest Negative GEX is parked at 560, which is huge. That’s where market makers flip from hedging to hunting.
* There’s a fat PUT wall at 560, and we’ve been dancing around it. So if bulls can’t hold this line, things could unwind fast.
* On the upside, CALL resistance is stacked at 562–563, and we just tapped into it.
* IV is sitting at 30.6 with IVx avg 25 → market’s a bit juiced, probably pricing in some chop or catalyst ahead.
🎯 Trade Scenarios I’m Watching
🐻 Bearish Setup (if price rejects 563 again):
* Entry: 561–562 rejection
* Target: 555–556 zone
* Stop: Close above 563.50
* This plays off the GEX flip and rejection at CALL resistance.
🐂 Bullish Setup (only if we reclaim 563 with volume):
* Entry: Break and hold above 563
* Target: 567, maybe even 572 if gamma squeezes kick in
* Stop: Drop back below 561
🧨 Options Play Ideas
* Looking short-dated? Consider a PUT debit spread like 562/557 for this week if momentum confirms.
* For bounce lovers: CALL debit 563/567 spread, but only if we break 563 and hold above.
* With IV a bit hot, spreads are safer than naked options to control risk.
Final Thoughts:
SPY’s sitting at a pivot. It’s either digesting gains before another push… or we’re about to see some hedging volatility flood in. I’m personally watching how it handles 560–563 range — everything hinges on that for me. No need to rush in. Let the chart tell you.
This is not financial advice. Just me sharing how I see the market and how I’d trade it based on what the data and charts are saying.

Nightly $SPY / $SPX Scenarios for May 7, 2025🔮 Nightly AMEX:SPY / SP:SPX Scenarios for May 7, 2025 🔮
🌍 Market-Moving News 🌍
🏛️ Fed Decision Day Amid Tariff Pressures
The Federal Reserve concludes its two-day meeting today, with expectations to maintain the benchmark interest rate at 4.25%-4.5%. Despite President Trump's calls for rate cuts, the Fed remains cautious due to inflationary risks from new tariffs and migration policies.
📈 U.S.-China Trade Talks Resume
U.S. stock futures rose overnight on news of upcoming high-level trade talks between the U.S. and China, marking the first discussions since the imposition of 145% tariffs on Chinese goods. Treasury Secretary Scott Bessent and U.S. Trade Representative Jamieson Greer are set to meet with senior Chinese officials later this week.
🛢️ Oil Prices Rebound on Demand Hopes
Oil prices climbed as U.S. production declined and demand in Europe and China showed signs of recovery. Brent crude rose 0.6% to $62.52 per barrel, while U.S. West Texas Intermediate increased 0.74% to $59.53 per barrel.
💼 Key Earnings Reports Ahead
Several major companies, including Uber ( NYSE:UBER ), Disney ( NYSE:DIS ), and Novo Nordisk ( NYSE:NVO ), are scheduled to report earnings today. Investors will be watching these reports for insights into corporate performance amid ongoing economic uncertainties.
📊 Key Data Releases 📊
📅 Wednesday, May 7:
2:00 PM ET: Federal Open Market Committee (FOMC) Meeting Announcement
2:30 PM ET: Fed Chair Jerome Powell Press Conference
3:00 PM ET: Consumer Credit Report (March)
⚠️ Disclaimer:
This information is for educational and informational purposes only and should not be construed as financial advice. Always consult a licensed financial advisor before making investment decisions.
📌 #trading #stockmarket #economy #news #trendtao #charting #technicalanalysis

SPY Buy OpportunitySPY bounced from 500 support with high volume, uptrend since May. Buy if it breaks 540 with confirmation, target 560-570, stop loss below 500. Watch for FOMC speech tomorrow, may impact volatility.

SPY (worst is over?)Excellent buy side volume this week following by one down gap fill. We are at resistance currently so I would expect a lot of chop before resumption up trend. Make sure you check which security is showing strength during the down days of the chop. They might become the future market leaders.

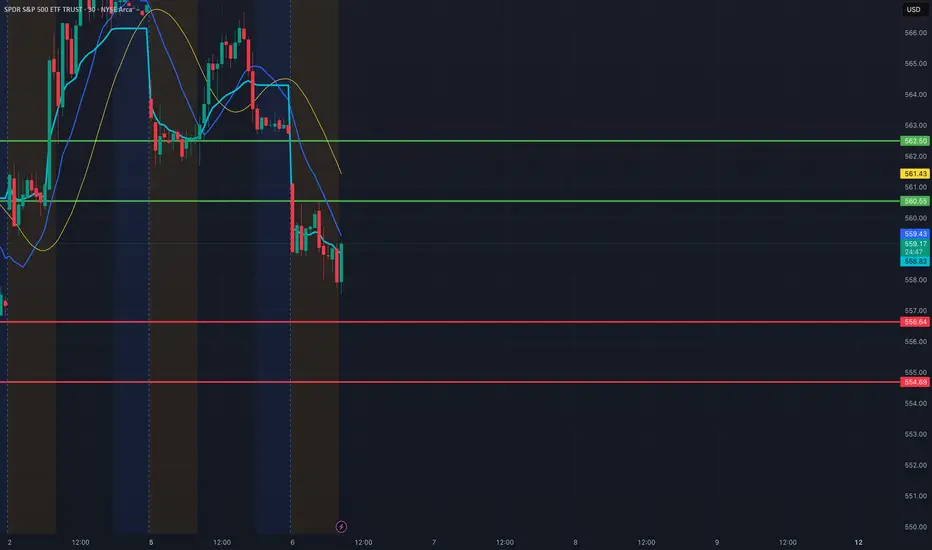
SPY Day Trade Plan for 05/06/2025SPY Day Trade Plan for 05/06/2025
📈 560.55 562.50
📉 556.64 554.69
Thanks to all my followers! Truly appreciate the support!
Please like and share for more ES/NQ levels Tues & Thurs 🤓📈📉🎯💰
*These levels are derived from comprehensive backtesting and research and a quantitative system demonstrating high accuracy. This statistical foundation suggests that price movements are likely to exceed initial estimates.*
SPY Time to come down.SPY time to take a break but don't expect much from the 4hrs and 1hr pov. probable 555.00 and in the worse case scenario 523.00. We'll see once it gets there and most important "how it gets there".
It has strong res at 575.00

SP500 Correction neededSP500 Correction needed
Technical picture of correction:
- Wedge - internal and external
- Finish of W3
- Long period of gains
- Oscillator 4H+ overbought

Where do we go from here ? Hint have a hedge on.We hit target 565 was looking a little higher
Lets see we get follow thru tomorrow down
Be prepared this market gonna sink

Nightly $SPY / $SPX Scenarios for May 6, 2025 🔮🔮
🌍 Market-Moving News 🌍
📉 Market Retreats Amid Tariff Concerns
U.S. stock markets declined on May 5, 2025, as investors reacted to potential tariffs and key earnings reports. The S&P 500 dropped 0.6%, and the Nasdaq decreased 0.7%. Notably, Palantir Technologies ( NASDAQ:PLTR ) fell nearly 8% in extended trading despite raising its full-year revenue forecast and exceeding Q1 revenue estimates.
🏛️ Fed Meeting Commences Amid Political Pressure
The Federal Reserve's two-day meeting begins today, with the central bank expected to maintain its benchmark interest rate at 4.25%-4.5%. Despite President Trump's calls for rate cuts, the Fed remains cautious due to inflationary risks from new tariffs and migration policies.
🎬 Entertainment Stocks Under Pressure
Streaming giants Netflix ( NASDAQ:NFLX ) and Disney ( NYSE:DIS ) experienced premarket losses of over 5% and 3%, respectively, following President Trump's proposal of a 100% tariff on foreign-made movies.
🏠 Housing Market Faces Challenges
The U.S. housing market is weakening due to persistent high mortgage rates and economic uncertainty driven by tariff policies. Mortgage rates, currently averaging 6.76%, have deterred both prospective buyers and sellers.
📊 Key Data Releases 📊
📅 Tuesday, May 6:
8:30 AM ET: U.S. International Trade in Goods and Services (March)
⚠️ Disclaimer:
This information is for educational and informational purposes only and should not be construed as financial advice. Always consult a licensed financial advisor before making investment decisions.
📌 #trading #stockmarket #economy #news #trendtao #charting #technicalanalysis

I SPY levels....It's a FOMC week (scheduled for Wed 5/7). So you can use your skills to scalp prior if you can.
Levels to mark...
*week hi/lo
*day hi/lo
those levels should be helpful when you spot intraday setups (if you can). if you can plan a strong $1 move, you can win $50. play to your strengths. that's all i'm going to do.

Broad MonitorThis is a huge set of assets, stocks, ETFs that I use to watch for shifts in market regimes.

$SPY Short Swing, vwap+supply+resistanceBackground. Easy confluence trade. We had the largest and fastest rally in stock history from 2022 to now. Everyone who loaded up at $380-430 is ready to take some profits. After the tariff announcements, we sold off hard through a bunch of levels and trendlines down to the bottom of the longer term uptrend.
Current situation. We have retraced back up to the first major supply area, where everyone who bought the dip back in march went long. They've been underwater and are ready to sell for scratch. This will drive the price back down. Maybe the end of a long term uptrend. Maybe just leg 2 of the tariff drop, back down to the trendline. I can't know that.
Delta. If you look at the volume footprint chart, there has been a huge negative delta this whole rally. Prices are going up but the larger players are selling into it. Essentially, the last 2 weeks have been driven up by main street, while wall street unloads. Once there are enough bagholders, the floor can fall out. Here's the weekly delta.
Trading Approach. This is a good point to initiate the start of a long term short position. Like, buying puts 1-2 years out with a $450 target, a gap that's never been filled. I think it's also a good swing entry but with closer targets. On the more pessimistic attitude, after the tariffs, the world started the process of dethroning America as leader of the free world. There's a lot of gravity pulling down to $250 and if the world fully turns on the US, that's where we're heading.

480 Was Our Low This YearTrading Fam,
In my last post, I speculated that there were (2) two great areas to start your DCA back into this market. The first was at SPY 505 and I postulated that if we dropped lower, we could hit SPY 460. Not quite. Looks like our downward trajectory reached it's bottom exactly at that ascending white support line. Now here's the interesting part. That trendline was actually started way back in March of 2020, the Covid-19 crisis, when Trump was also president. I should have seen this trend but I don't think I had it drawn in until more recently. This trendline has obviously proven extremely significant and I'd advise that you draw it into your charts as well. We now have something to watch closely. I suspect that if price breaks down from here, it won't be pretty. This year, I don't think that will happen. I believe we saw our low this year upon the touch of that trendline at 480. So, if you didn't get your money started back in at the 505 level, you were not given much of a chance afterwards.
Today we can see that our price is back above numerous levels of resistance which will now act as support. Firstly, that 505 level. Next, the VRVP point of control (yellow horizontal line). Third, that pink ascending trendline. That was huge and we have confirmed the move above it now on the daily. If we stay above it by market close on Friday, we're good. That will be enough to also provide us weekly confirmation.. Finally, we are sitting right on support at 563, that pink horizontal line. All of these bullish breaks show me that price should remain above our white ascending trendline started in March of 2020 for some time, and I am guessing the rest of the year.
I remain steadfast in my bias towards my SPY Target #3 at 670-700 before sometime next year. Two targets hit so far. One to go. I am fairly confident we will hit it. At which point, it will be time to make some serious decisions about what to do next.
✌️Stew

SPY - support & resistant areas for today May 5 2025These are Support and Resistance lines for today, May 5th, 2025, and will not be valid for the next day. Mark these in your chart by clicking grab this below.
Yellow Lines: Heavily S/R areas, price action will start when closing in on these.
White Lines: Are SL, TP or Mid Level Support and Resistance Areas, these are traded if consolidation take place on them.
Silver Lines: An Area where price action could happen and do work on a choppy day.

SPY Holding the Channel – Can It Bounce or Fade Today?Market Summary
SPY is currently trading around $563, showing early weakness after stalling below key resistance at 566–567 last week. Futures were flat overnight with mixed macro sentiment and low volatility. We're starting today near the lower trendline of the rising channel visible on the 15-minute chart.
Technical Structure
* Trend: Price is still holding the lower boundary of the upward channel from May 1–2.
* Support: ORL at 564.29 and lower trendline ~563.20–563.40.
* Resistance: ORH at 565.47, PMH at 565.95, and GEX resistance at 567.
* Indicators:
* MACD: Flattening with bearish cross on shorter timeframes.
* Stoch RSI: Reset to lower range, watching for potential curl up.
Options & Gamma Insight (GEX)
* Current Price: $563
* PUT Pressure Dominant: GEX sentiment is 🔴🔴🔴 Bearish, with:
* PUT$ flow = 115.6% (significantly overweighted)
* IVR 26.1, IVx avg 20.4 = Still room to expand in volatility.
* Key Gamma Levels:
* Resistance Walls:
* 567 → 2nd CALL Wall (major resistance)
* 568–570 → CALL resistance zone
* Support Zones:
* 562–561 → Heavy GEX support
* 560 → Highest negative net GEX = strong PUT wall
Potential Scenarios for Today
🟢 Bullish Case:
* Price reclaims ORH 565.47 and breaks above 566, triggering momentum to test 567.
* If momentum continues, squeeze toward 568 or even 570 is possible, but less likely unless volume spikes.
🔴 Bearish Case:
* Break below 562.68 Ask, triggering fast move to 561.70 and possibly flush into 560 PUT wall.
* Below 560 opens the door to 557 or even 554–555 if panic selling or negative macro.
Actionable Levels
* Long above: 565.50 with target 566.80–567 | Stop < 563.80
* Short below: 562.80 with target 561 → 560 zone | Stop > 564.50
* Scalp Range Zone: Between 563.50–565.50 = chop risk
Final Take
SPY is pinned between heavy PUT support at 560 and CALL resistance at 567. With PUTs outweighing CALLs, a flush toward 561–560 could be favored unless bulls reclaim 566+. Watch for sharp directional trigger around 10:00–10:30 AM ET.
📌 This preview is for educational purposes only. Always use proper risk management and confirm with your own system before trading.

SPY/QQQ Plan Your Trade For 5-5-25 : GAP Reversal PatternToday's pattern suggests the SPY will open with a GAP range from yesterday's candle Body and attempt to reverse the trend we saw last week.
I believe this move will resolve to the downside, as I've been warning of the May 2-5 Major Bottom for many weeks.
I believe the extended uptrend over the last few weeks was pure speculation related to Q1 US earnings. It is hard to argue that traders playing into the Q1 earnings boost didn't play the right side of the trend after watching the markets rally over the past 2+ weeks. But, I still believe the markets will consolidate and attempt to move downward over the next 10- 20+ days.
The one thing that we have to understand is Q1 was almost on auto-pilot from Biden's economy/spending until Trump threw a curveball at the global markets with tariffs.
I don't believe the US & global markets have truly priced in a global -25% to -45% economic contraction because of the ongoing tariff negotiations. It has been reported that shipping rates are down 60% in China. I believe we still need another 30-60+ days to work out the tariff issues and to allow the markets to settle into proper expectations for future economic output/growth.
Because of this, I continue to urge traders to stay cautious.
Sitting on CASH right now (only trading 20% of your total capital) is probably the smartest thing you can do at the moment.
I still expect the July and October 2025 lows to be the base/bottom of the markets, leading to a stronger upward price trend.
Right now, I've very cautious we've just seen a "dead-cat bounce" off recent lows because of Q1 earnings expectations.
Now that we've passed most of the Q1 data - we are staring at Q2 & Q3. What comes next.
I believe Gold/Silver will continue to price in extreme risk factors - resulting in a strong rally through May and into June.
I believe Bitcoin will stall and move back down to the lower consolidation range.
Let's see how things play out this week.
Get some.
#trading #research #investing #tradingalgos #tradingsignals #cycles #fibonacci #elliotwave #modelingsystems #stocks #bitcoin #btcusd #cryptos #spy #gold #nq #investing #trading #spytrading #spymarket #tradingmarket #stockmarket #silver

SPY EOW TARGETS!
SPY EOW TARGETS
585 bullish
551 bearish
530 oh no
Bullish Bias till 555 is broken
1. To maintain a healthy uptrend SPY will need a retracement to 558-560
2. While reddit is panicking I'll be looking at a short swing trade, stop below 555 and targeting 570-573
3. 570 will prob be a chop zone before another liquidity swoop lower, then after or leading up to FOMC we pump to 585
TL;DR Bullish Bias for now, look for long setups, catch a swing play once retracement to 560ish is complete

Weekly $SPY / $SPX Scenarios for May 5–9, 2025🔮 Weekly AMEX:SPY / SP:SPX Scenarios for May 5–9, 2025 🔮
🌍 Market-Moving News 🌍
🏦 Fed Holds Rates Amid Political Pressure
The Federal Reserve is expected to maintain its benchmark interest rate at 4.25%-4.5% during its meeting on May 6–7, despite political pressure to lower it. Investors will closely monitor Fed Chair Jerome Powell’s post-decision remarks for insights into future monetary policy directions.
📊 Key Economic Indicators on Tap
This week brings several important economic data releases, including the U.S. trade balance, initial jobless claims, consumer credit, and wholesale inventories. These indicators will provide insights into the health of the economy amid ongoing trade tensions and concerns over consumer confidence.
💼 Corporate Earnings in Focus
Major companies such as Palantir ( NASDAQ:PLTR ), Advanced Micro Devices ( NASDAQ:AMD ), Uber ( NYSE:UBER ), Walt Disney ( NYSE:DIS ), and Ford ( NYSE:F ) are scheduled to report earnings this week. Investors will be watching these reports for signs of how companies are navigating the current economic landscape.
🌐 Global Events and Leadership Changes
Europe is set for significant leadership changes, with Friedrich Merz expected to be confirmed as Germany’s new chancellor. Additionally, the Vatican’s conclave to elect a new pope convenes on Wednesday. These events, along with the 80th anniversary of VE Day, may have broader implications for global markets.
📊 Key Data Releases 📊
📅 Monday, May 5:
9:45 AM ET: S&P Global Composite PMI (April Final)
10:00 AM ET: ISM Non-Manufacturing Index (April)
📅 Tuesday, May 6:
8:30 AM ET: U.S. International Trade in Goods and Services (March)
📅 Wednesday, May 7:
2:00 PM ET: Federal Reserve Interest Rate Decision
2:30 PM ET: Fed Chair Jerome Powell Press Conference
📅 Thursday, May 8:
8:30 AM ET: Initial Jobless Claims
10:00 AM ET: Wholesale Inventories (March)
📅 Friday, May 9:
3:00 PM ET: Consumer Credit (March)
⚠️ Disclaimer:
This information is for educational and informational purposes only and should not be construed as financial advice. Always consult a licensed financial advisor before making investment decisions.
📌 #trading #stockmarket #economy #news #trendtao #charting #technicalanalysis

SPY: Where to next? These are just my thoughts and opinions, not advice.
I forgot to mention in the video, Monday has a bearish forecast. If you pay attention to the Weekly forecast I share in the video, this is more similar to the bullish path (selling into Monday). :-O.
Bit of a longer video because lots to talk about.
Safe trades everyone!

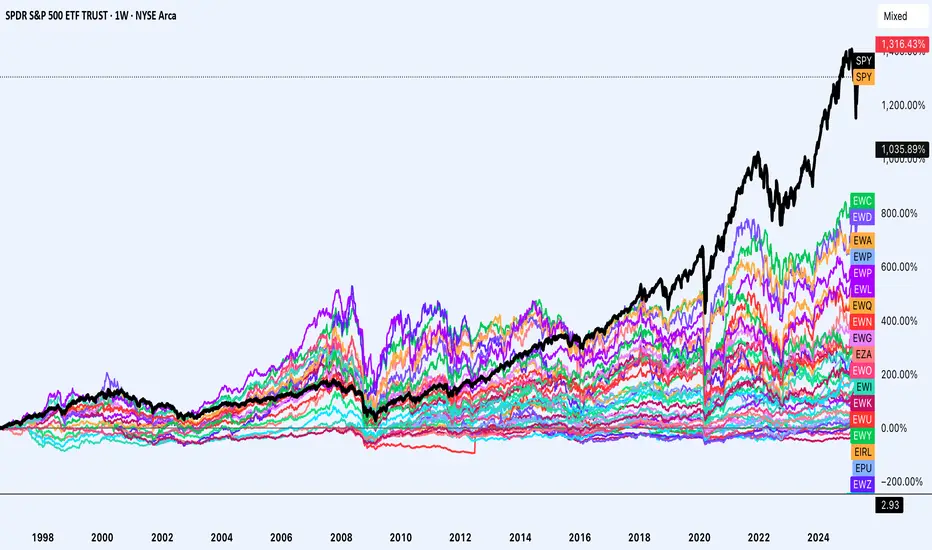
US Outperformance, when will it end?The US market has consistently outperformed global markets since the global financial crisis, it has also outperformed since the tech bubble. A portion of this can be attributed to a strong dollar (many markets outperformed in local currency). However this strong dollar performance may be coming to an end.
In addition there are structural reasons why the US has and may continue to outperform:
1. A larger weighting to higher growth sectors such as technology, communication services and a lower weight to lower growth sectors such as energy and materials.
2. Better rule of law, better focus on shareholder returns, less crowding from the government and state owned enterprises lowering the return of markets. (EM SOEs as an example)
3. US attracting global talent and fostering innovation. "The smartest person in any subject will likely go to the US'
So how can the US consistently underperform given these things?
1. Well for one the dollar may start to be a worse performing currency, it seems the current administration wants that. This not only lowers the performance of the US compared to global markets it also lowers the foreign inflows to US assets and also benefits EMs with dollar denominated debts.
2. The idea that the US attracts the best talent and fosters innovation may be declining with the current cultural attacks on immigration and the federal government spending cuts impacting research projects.
3. Global markets currently have a lower weighting to high growth sectors however this may not continue and instead we may start to see the marginal weight of sectors going to higher growth sectors instead of lower growth sectors.
4. The darling companies in most countries may list in their local markets instead of in the US. (Seeing the UK ease regulations of share classes, Chinese companies not welcomed in the US, European companies redomiciling back to Europe)
5. Valuations, Valuations, Valuations. Gun to your head: Next ten years would the multiple become a headwind or tailwind for the US market? What about for global markets? US trades at roughly 21x forward earnings whereas the UK trades at 12x, Eurozone at 14x, Japan at 13.5x, EM at 12x and China at 11x.
If after 10 years the US trades at an 18x multiple and the UK as an example trades at a 15x valuation that would be an annualized headwind of 1.5% for the US and an annualized tailwind of 2.3% for the UK. Add to that the effect of low starting valuations on yield (US net shareholder yield is close to 2% whereas the UK yields 4%).
Just rough numbers on performance for US vs UK next 10 years.
US: -1.5% multiple change, 2% yield, 10% earnings growth = 10.5%
UK: 2.3% multiple change, 4% yield, 6% earnings growth, 1% currency = 13.3%
Everyone is over allocated to the US and is under allocated outside the US. Currently the US represents around 20% of global GDP however it represents 70% of global market cap. 70 cents of every dollar in the equity market is in and goes to the US. Will this likely increase or decrease as a share? The next question becomes who will take that share if it falls?
Investing outside the US does not mean:
Investing in markets with bad shareholder friendliness
Investing in markets with a history of fraud
Investing in markets with notorious related party transactions
Investing in markets with high starting valuations.
Some markets such as China can have the first 3 issues applied to it, some markets such as India may frankly have all of these issues. Some markets in Europe may have the first and last aspect. And some markets likely have none of these issues. I propose Japan, UK and Northern Europe.
History is only a guide however the history of returns involved one of the single best economic performances of any country coming from the US which resulted in an amazing stock market with great returns, this is not guaranteed.
Historically stocks return nominally 10% and on a real basis 7% which can be decomposed to 3% yield and 7% earnings growth with virtually no multiple change (on long enough time horizons) when you start at a high valuation the yield component is lower and you need higher earnings growth to compensate. And on a much longer time horizon earnings growth is what really matters.
Earnings growth does not exist out of no where, it usually tracks nominal gdp growth + a margin increase from operations and or sector compositions.
Nothing is guaranteed, your next maximum drawdown is in the future, expect the unexpected and keep invested as the global debt bubble will likely be inflated away.
SPY: Short Trade with Entry/SL/TP
SPY
- Classic bearish setup
- Our team expects bearish continuation
SUGGESTED TRADE:
Swing Trade
Short SPY
Entry Point - 566.62
Stop Loss - 582.02
Take Profit - 540.07
Our Risk - 1%
Start protection of your profits from lower levels
Disclosure: I am part of Trade Nation's Influencer program and receive a monthly fee for using their TradingView charts in my analysis.
❤️ Please, support our work with like & comment! ❤️
