Trade with me! Walkthrough as I short SPY on a 1 min chartThis is a long video and unfortunately we got cut off at the 1 HR mark right before the ensuing dump toward our TP level (currently 5 minutes after the video up 30% on the position).
Recommend watching on 2x, 3x, 4x speed if you want but also a lot of insights as to what I'm looking out for through my typing. I would have liked to do this with a mic but I'm in a loud environment and wanted to get this out to you.
Hope you enjoy and aren't bored (which sometimes, trading is just boring!)
Happy Trading :)
SPY trade ideas

Understanding the Downside Market and who controls priceA downtrend starts with Dark Pool Buy Side Institutions slow rotation to lower inventory of a stock or ETF. The rotation bends the trend into a rounding pattern that is visible on the stock or ETF chart. The goal of the Dark Pool rotation is not to disturb the uptrend while they are slowly selling shares of stock over several months time. The bending of the price is a signal that the Dark Pools are in rotation. If a chart has Peaks and Valleys trendline pattern that is NOT Dark Pools. Controlled TWAP orders are automated and controlled by the events of that day.
At some point professional traders and the Sell Side Institutions will recognize the hidden rotation and start setting up sell short trades.
The upside requires more and more buyers to keep the trend moving upward. However, the downside does NOT require more and more sellers. All that is required is a void of buyers and the stock will start a downward correction on the short term or intermediate term trend.
A void of buyers also creates the opportunity for High Frequency Trading companies who are Maker/Takers to sell short. The sell short orders fill the queues of the market before it opens and then the computers of the stock exchanges gap the stock down to a first level of some buyers. HFTs, Hedge Funds and Big Money Center Banks Sell short and place their automated buy to cover order way below causing the stock price to plummet.
Then smaller funds VWAP orders trigger and the stock collapses.
What I am trying to teach is the sell side and the buy side are totally different.
They are NOT mirror images of each other.

can bulls hold the line? or nahwatch this spy 489-497 support zone, if support holds into the close we could see a major bounce to the 550 level where a sold my shares 1-2 weeks ago 🎯
if we cant hold then the downside continues, theres not much short term support below here.. boost and follow for more 🔥

$SPY Trading Range for April 8 2025AMEX:SPY Trading Range for April 8 2025
35EMA is in focus - can we hold it. We opened at the top of the implied move
I'm selling bear call spreads at these levels - but in SPX today.
$SPY Review of Black Monday
Alright - Yesterday - These trading ranges came out late but with plenty of time to take some great trades.
We hit the bottom of the implied move, the top of the implied move and we saw resistance at the 35EMA. Spreads on both ends paid. 10% intraday moves

SPY/QQQ Plan Your Trade For 4/8 : Bottom/Rally Start - CounterFirst off, today's pattern is in a COUNTER TREND mode. Think of that as the pattern being INVERTED to the current price trend.
Next, the Bottom/Rally Start pattern is usually a base/bottom type of pattern that prompts a fairly strong bullish/rally phase in price.
This time, because it is inverted (in Counter-trend mode) and is forming within the broad consolidation phase of the current EPP pattern, I believe this Bottom/Rally Start pattern will really be a Top/Selloff start type of pattern.
Where price will find resistance in early trading, form a rollover top, and start to move back downward towards the 500-505 level on the SPY.
I don't believe this downward price move will attempt to break below 480-485 today. I believe today's move will be a moderate pullback in the trend.
Although any BIG news could disrupt the current support near $480, so be aware that any big news event could crush the markets (again) and send the SPY trying to retest the $480 support level.
Gold and Silver appear to be basing - perfect. I'm watching for Metals to really start to reflect the FEAR in the markets and rally above $3200 (Gold)/$39 (Silver).
BTCUSD appears trapped in the breakdown stage of the current EPP Consolidation phase and the new CRADLE pattern. No matter how I try to identify if I'm wrong with BTCUSD, I keep seeing the breakdown as the more dominant trend.
Get some.
#trading #research #investing #tradingalgos #tradingsignals #cycles #fibonacci #elliotwave #modelingsystems #stocks #bitcoin #btcusd #cryptos #spy #gold #nq #investing #trading #spytrading #spymarket #tradingmarket #stockmarket #silver

$SPY short term top downside from $521 to $481AMEX:SPY is looking like it put in a short term top here. I originally only thought that we had the potential to fall to $545 or so, but now looking at the chart, I think we have the possibility of falling farther.
The two targets that I'm looking for on the downside are $524.35 and 481.18.
Let's see if they get hit over the coming weeks.
If they hit, it'll be the ultimate buying opp as I think from there, we're likely to see SPY over $700 in the coming year or two.

Tutorial on how I use stoch few other tricksVideo on how I use stoch 15 Min daily weekly
few other TA tricks hope u enjoy

buy the dippity dip of the dipTechnically, charts are near previous highs from 2021-22,
As the great investooore ser unlimited meals buffett said
"if you eat when others are hungry, you will get fat. but if you starve when others are eating you will get all the chix."
its just a correction, not a recession .
buy the dip fm

Nightly $SPY / $SPX Scenarios for April 8, 2025🔮 🔮
🌍 Market-Moving News 🌍:
🇺🇸📊 NFIB Small Business Optimism Index Release: The National Federation of Independent Business (NFIB) will release its Small Business Optimism Index for March at 6:00 AM ET. This index provides insights into the health and outlook of small businesses, which are vital to the U.S. economy.
🗣️ Federal Reserve Speeches:
San Francisco Fed President Mary Daly is scheduled to speak at 8:00 AM ET.
Chicago Fed President Austan Goolsbee will deliver remarks at 7:00 PM ET.
📊 Key Data Releases 📊
📅 Tuesday, April 8:
📈 NFIB Small Business Optimism Index (6:00 AM ET):
Forecast: 100.7
Previous: 102.8
Assesses the health and outlook of small businesses, which are vital to the economy.
⚠️ Disclaimer: This information is for educational and informational purposes only and should not be construed as financial advice. Always consult a licensed financial advisor before making investment decisions.
📌 #trading #stockmarket #economy #news #trendtao #charting #technicalanalysis


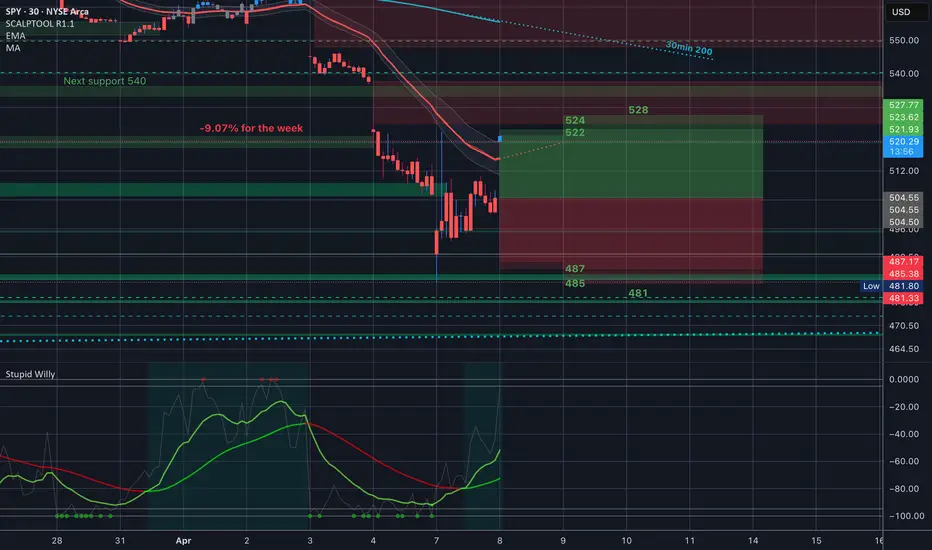
Blood in the streets, SPY looks to have bottomed, for now?I forgot how that old saying went, but I knew its time for a good deal. My first tip off that we might be at a bottom was fear and greed sitting at a 4 on Friday. Into the weekend I saw Cramer and friends calling 1987 crash and historic doom headed for the economy. I saw a stat saying that this was the biggest crash since 2008, covid not withstanding. And then I saw one of my favorite tells, I call it the comedy indicator. When things are so bullish that people can only laugh at how easy it is to get rich... its a good sign to get out. The same goes when joking about the depression and how doomed it is, it's probably a good time to get in. So SNL having multiple segments joking about the depression was a good tell to me that we were rounding a corner.
Next I check some fundamentals, the S5TW is pretty useful in spotting bottoms temporary or otherwise, right now its sitting around 2-3% or 97-98% of SNP stocks below their 20 day MA. This is the level it was during the Jun 2022 bottom (before the massive run-up into august for those that remember, 18% in under 2 months) The 2022 October bottom, and of course the march 2020 covid bottom.
Finally you got some basic chart indicators, accumulation/distribution showing that we are still at the 560 level. the McLellan which shows that the 2 day massive sell off was not actually as broad as it may have seemed. Then there is the classic Stupid Willy, who is tuned to -5 and -95 to avoid too many false signals, not only did it signal twice the last 2 trade days, today the smoothed line crossed the signal EMA which tells me buyers had some solid force at this level. The Bollinger Band also looks like it may start curling around and we finally managed to tap into the bottom of the band (briefly) but that tells me there is some good room to run and it may be that time.
Overall I think this bottom is at the very least temporary, we should go up from here, complacency, hope, whatever it is should return. 560 may be too high, but I see us filling Friday's Gap down and maybe getting into the 540s in the coming weeks.
Happy Trading & Good Luck

SPY Battle Zone: Bulls vs. Bears at 6M Low ($510.27)📈 SPY Trade Setup – Key Reclaim or Rejection at $510.27 🔥
Ticker: SPY
Timeframe: 1H
Setup Date: April 7, 2025
🧠 Idea Summary:
SPY has recently bounced from oversold conditions and is approaching a critical level at $510.27, which is the 6-month low. Price action at this level could dictate the next major move. Here's how I’m planning this setup:
🟢 Scenario 1: Long Setup
Trigger: SPY reclaims and holds above $510.27
Confirmation: Retest and bounce from $510.27 as new support
Target: Move toward the next key resistance at $537.75 (Y Mid)
Stop: Below $508 for risk management
🔴 Scenario 2: Short Setup
Trigger: SPY fails to reclaim $510.27 and faces rejection
Confirmation: Lower highs and rejection candles under resistance
Target: Drop toward $466.43 (Y Low)
Stop: Above $512 or structure high
📊 Indicators Watching:
Dynamic Support & Resistance
Neon Momentum Waves – signaling potential short-term reversal or bounce
📌 Notes:
$510.27 is the key inflection point.
Momentum and volume confirmation are crucial.
Be patient and let price confirm your bias.
🔔 Let me know in the comments how you’re playing this level – are you leaning long or short?
👍 Like & Follow for more setups!
Disclaimer: This content is for educational and informational purposes only and does not constitute financial advice. Always do your own research and consult with a licensed financial advisor before making any investment decisions. Trading involves risk, and you should only trade with capital you can afford to lose.
#SPY #SP500 #TradingSetup #TechnicalAnalysis #SwingTrade #MarketWatch #SupportResistance

S&P 500 ETF (SPY) Market Cycle Analysis – Correction coming ?This chart presents a macro view of SPDR S&P 500 ETF (SPY) on a bi-weekly timeframe, highlighting key market cycle corrections and potential upcoming trends.
Key Observations:
🔴 Trendline Support: The price action has consistently respected a long-term ascending trendline, with previous corrections bouncing off similar levels.
📉 Historical Market Corrections: Red vertical lines mark significant past corrections (Feb 2020, Dec 2021), aligning with dips in the lower indicator, suggesting cyclical downturns.
📊 Momentum Indicator (Lower Panel): Past dips in this momentum indicator (highlighted with red arrows) coincided with major corrections in the SPY chart. The recent downward trend raises concerns about another potential market pullback.
🔮 Future Projection (March 2025?): Based on previous cycles, the next major correction could occur around March 2025, aligning with potential trendline retests. If history repeats, we may see a pullback before resuming the uptrend.
Key Questions for Traders & Investors:
✅ Will SPY respect the trendline and recover, or are we heading for a deeper correction?
✅ Does the current market structure resemble past cycle downturns?
✅ How will macroeconomic conditions influence SPY’s next move?
Let me know your thoughts! Are you preparing for a correction, or do you see more upside potential? 🚀📉
⚠️ Disclaimer: This analysis is for educational and informational purposes only and should not be considered financial advice. Always conduct your own research and consult with a professional before making any investment decisions. Past performance does not guarantee future results. Trade responsibly!

SPY/QQQ Plan Your Trade EOD Review : POP PatternToday's pattern played out perfectly.
I'm really amazed that the SPY rallied up to my resistance level ($520-525) and stalled/bottomed exactly near my $480 support.
Absolutely PERFECT reflection of the data I presented this morning and from my research over the weekend.
Now, if my analysis is correct, we move into a sideways consolidation pattern for the next 3+ weeks where price will attempt to establish a range (moving slightly downward in trend) before we get to the late-June breakdown (setting up the July 2025 low), then another big breakdown in October 2025.
I can't tell you how pleased I am with the comments and messages I get every day. Some of you are KILLING IT and I'm so happy to be able to help.
Remember, we are all trying to find the best way to profit from these market trends. So remember to share your success with others and let them know how to find the best tools for trading (on TradingView).
Now, let's get busy trying to get ready for the next phase of this market trend (which will come in June).
I'll keep you updated.
Get some.
#trading #research #investing #tradingalgos #tradingsignals #cycles #fibonacci #elliotwave #modelingsystems #stocks #bitcoin #btcusd #cryptos #spy #gold #nq #investing #trading #spytrading #spymarket #tradingmarket #stockmarket #silver

Possible 450 Capitulation Coming If the sharp move we've seen today turns out to be a bull trap, then the logical thing to expect here would be an incredibly sharp move down to the 4.23 fib.
450 or so in SPY.
IV is sick on the options but spreads for around this spike make sense.

SPY at the Edge! Will Buyers Step Up or Is More Blood Ahead?🔥 🚨
Market Structure Insight
SPY is currently in a sharp descending channel, respecting both the upper and lower trendlines. After a clean Break of Structure (BOS) at 546.97 and a failed CHoCH attempt, the price accelerated downward and is now hovering just above a key psychological round level near $500.
The most recent BOS confirms a bearish continuation, but the current price is sitting at the bottom of the channel, where a short-term bounce may occur if momentum slows down. We're in the discount zone—a key area Smart Money often targets for reversals.
Smart Money & Technical Zones
* Resistance zone: $546.97 (last BOS area)
* Support zone: $502.19 (recent swing low)
* Channel bounds: Top near $550–560, Bottom near $500
MACD is starting to curve upward while Stoch RSI is lifting from the oversold zone — potential signs of a short-term relief rally. However, there’s no CHoCH yet to confirm a structural reversal.
GEX & Options Sentiment Breakdown
* IV Rank: 121.8 → Elevated implied volatility, prime for option premium selling.
* IVx avg: 53.1 → Still rising, shows fear entering the market.
* PUTS Dominate: 84.7% of options flow are puts.
* GEX Bias: Strong negative gamma exposure, indicating dealer selling accelerates downside moves.
* Key Support Walls:
* $520: Highest negative NETGEX / Put Support.
* $500: Second Put Wall with -76.41% pressure.
* Resistance Walls:
* $547: HVL and minor call resistance.
* $560: 3rd CALL Wall, minimal resistance at 1.26%.
Dealers are heavily short gamma, suggesting large directional swings and continued volatility.
Trade Setups
Scenario 1 – Dead Cat Bounce (Bullish Relief Rally)
* Entry: Above $510 with confirmation of strong volume or CHoCH.
* Target 1: $520 (first structural test).
* Target 2: $546–$551 HVL rejection zone.
* Stop Loss: Below $502
Scenario 2 – Bearish Continuation
* Entry: Rejection at $510–$520 zone or breakdown of $502
* Target 1: $495 psychological level
* Target 2: $485–$475 (overshoot flush level)
* Stop Loss: Above $522
Investor Strategy Insight
Long-term investors should remain cautious until SPY shows structural strength above $546. Until then, dollar-cost-averaging with tight capital allocation could be safer. This environment favors option sellers due to elevated IV, or high-conviction intraday scalping on well-defined levels.
Outlook & Mindset
This week is dominated by uncertainty—rising global tariffs, geopolitical risk, and credit tightening all weigh on risk-on sentiment. SPY may enter a volatile range-bound phase between $500–$550, until new macro data shifts sentiment.
If you’re trading SPY this week, don’t try to catch the knife. Wait for confirmation candles or volume shifts, and be nimble with risk.
Disclaimer
This analysis is for educational purposes only and does not constitute financial advice. Always do your own research and manage risk responsibly.

SPY dump at openim expecting SPY to drop to $480.30 in the first little bit of the morning session. from there bulls will have a chance to send us up higher. i will be playing with an open mind and letting bulls have at the bounce

$SPY Last WeekAMEX:SPY We broke many supports and are looking for Support
Stay Tuned - Today's Trading Range is coming out.
Don't rush into a trader just to trade - But also, if you see a great opportunity take it.

Nothing newSPY will touch the tendency line, if you see, was a needed pullback. We should have a new run by the end of april.
Previews pullbacks: 25% and 33% the covid one. As reference.

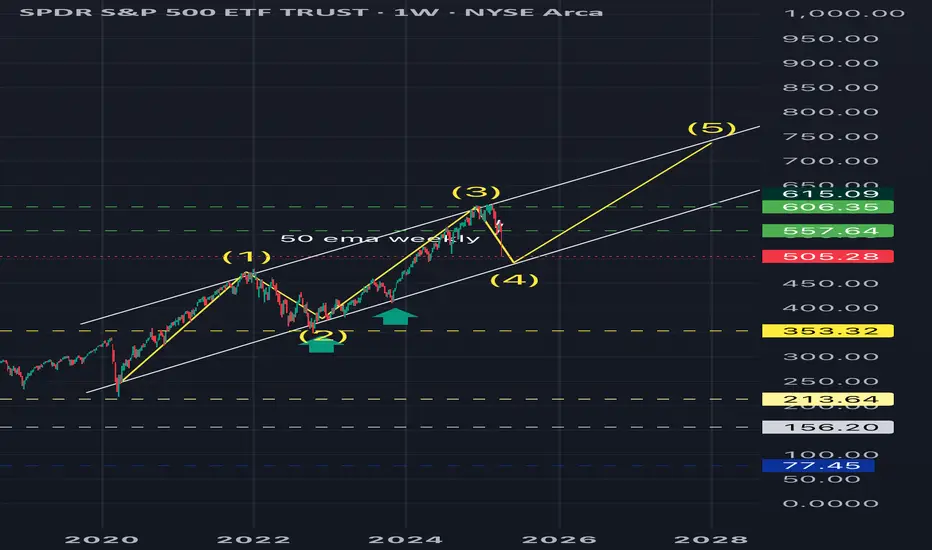
Wave 5We have completed the abc between wave 3-4
Wave 5 is usually equal to wave 2 in length and time so I see we get another 2 year bull run from here.
Spy 750 from here
Spy Bear Market Territory Spy need's To Hold $482 Or Its even lower as go as low as $474ish..... I would like to see us hold $482 to possibly take the long to $495, Theoretically speaking if we actually open up Monday in this range that's exactly what i would be looking for call etc..... But because the market is so volatile i most likely wait a whole hour to decide when and where to take my position, But other than that if we hold $482ish i would long short term day trades ext if lower than $482 I'm short.... AS always good luck and safe trades traders

SPY Long for the lower highWatching a potential Head & Shoulders forming here near the uptrend line going back to the covid crash lows. Thinking we get a bounce here in this 489-500 area for a move back to 550 for the right shoulder.
