SPY Analysis & Tariff TurmoilLast Friday, the market pressure was intense, and my bullish call option, targeting $537.64 on SPY, seemed overly ambitious as tariffs and political uncertainties peaked. I stated, " AMEX:SPY Trump went all in thinking he had the cards. We were getting sent back to the McKinley era," wondering when or if Trump would fold under international pressure and market realities.
Fast-forward to Wednesday, April 8—Trump didn't just blink; he folded utterly, reversing the harsh tariff policies he initially defended aggressively. Prompted by China's aggressively dumping of U.S. Treasuries and stark recession warnings from Goldman Sachs, BlackRock, and JPMorgan, Trump pivoted significantly:
• Base tariffs: 10%
• Tariffs on China: Increased to 125%
• Tariffs on U.S. goods entering China: Increased to 84% starting April 10
While temporarily bullish, these sudden, dramatic policy swings underline ongoing instability and volatility. However, with big bank earnings on deck this Friday, short-term momentum looks positive.
Technical Levels & Trade Ideas
Hourly Chart
The hourly chart reveals a critical zone—dubbed "Liberation Day Trapped Longs"—between $544.37 (H. Vol Sell Target 1b) and $560.54 (L. Vol ST 2b). Bulls trapped here from recent highs may now look to exit on a relief rally.
• Bullish Scenario:
• Entry: SPY reclaiming and holding above $544.37.
• Target 1: $560.54 (top of trapped longs)
• Target 2: $566.54 (next resistance area)
• Stop Loss: Below recent lows near $535 to limit downside.
• Bearish Scenario (if tariffs intensify again or earnings disappoint):
• Entry: Breakdown confirmation below $535.
• Target 1: $522.20 (Weeks Low Long)
• Target 2: $510.00, potential further support
• Stop Loss: Above $544.50 to manage risk effectively.
Daily Chart Perspective
The broader daily chart shows SPY stabilizing around key lower supports after significant volatility. Recent price action suggests cautious optimism for an upward bounce, but considerable headwinds remain if tariff escalations resume.
Final Thoughts
The rapid tariff reversals and heightened volatility are unsettling. The short-term bullish move offers potential quick upside trades into earnings, but caution remains paramount. You can continue managing risks prudently and watch closely for political or economic headlines that could quickly shift market sentiment again.
SPY trade ideas

Analyzing SPY's Current Technical SetupAfter a strong downward momentum observed on the daily timeframe, SPY has shown signs of a potential reversal on the lower timeframe (65-minute chart).
Here's the breakdown:
SPY has seen a significant bearish move recently, breaking through key support levels and establishing a new recent low around the critical Half 2 Short target at $486.41. This sharp bearish action indicates strong selling pressure, as evidenced by high volume spikes accompanying the down move. The Relative Strength Index (RSI) on the daily has reached oversold territory (around 20), suggesting potential for a short-term bounce or consolidation.
65-Minute Chart Analysis:
On the shorter timeframe, SPY is showing a recovery phase, with the price reclaiming the Half 1 Short level at $508.91. The upward price action is supported by rising RSI, now trending upward above the mid-level (50), signaling short-term bullish momentum. Volume is moderately strong, suggesting buyer participation.
Trade Idea and Levels:
- Bullish Scenario:
- Entry: I deally, an entry would be considered on a confirmed hold above $508.91.
- Profit Targets:
- First target: Weeks High Short at approximately $520.16.
- Second target: High Sell Target around $531.41 (more optimistic scenario if bullish momentum strengthens).
- Stop Loss: Clearly set a stop below the recent pivot low at approximately $497.50 for risk management.
- Bearish Scenario:
- If price fails to sustain above $508.91 and reverses downwards:
- Entry: Consider short entry upon confirmed rejection below $508.91.
- Profit Targets:
- First target: Recent pivot low at $497.50.
- Second target: Half 2 Short at $486.41.
- Stop Loss: S et stop above $513, allowing for minor volatility without compromising risk control.
Final Thoughts:
Given the current oversold conditions on the daily timeframe and emerging bullish signs on the shorter timeframe, cautious bullish entries with tight stops could present favorable risk-to-reward setups. However, remain flexible to shift to a bearish stance if the price action fails to sustain the critical $508.91 level. Always manage risk accordingly and adjust positions based on ongoing market confirmation.

SPY/QQQ Plan Your Trade For 4-9 : Top/Resistance UpdateToday's big rally, prompted by Trump's Tariff comments, presents a real learning opportunity for traders and followers of my videos.
Everyone wants to know what's going to happen next.
This video will tell you what I believe is NEXT for the markets and why.
It should also reinforce the construct that price is the ultimate indicator and the use of the EPP/Cradle patterns as a mechanism for using price structure to attempt to identify where opportunities may exist.
As much as this video is an analysis of price action and a prediction of what may come next, it is also a tutorial showing you how to use price patterns, structure and context to attempt to plan for your next opportunities.
Ideally, the next phase of the market is to establish a consolidation range.
If the 480-525 lower consolidation range does not hold - then it will likely become a precursor of the July breakdown (support) level. Remember, we still have the July/Oct lows to deal with.
I fully expect the 550-575 consolidation range to become the new dominant consolidation phase for the current EPP pattern.
It makes sense to me that, absent any crazy tariff war, the most likely outcome will be for the markets to recover back to the 550-575 level and to consolidate further.
The last component we have to consider is the recent lows near 480 could have been a very quick breakdown to an Ultimate Low. If that is the case, then we'll most into a mode of seeking the next higher resistance level and I believe the 550 or 575 level would be the obvious next resistance level.
So, at this point, I believe the continuation of the Excess Phase Peak pattern is likely, but the price is actively seeking the consolidation range between the lower consolidation level and the upper consolidation level.
Price MUST establish the consolidation range, or INVALIDATE this pattern, in order to move onto the next pattern/phase.
Get Some..
#trading #research #investing #tradingalgos #tradingsignals #cycles #fibonacci #elliotwave #modelingsystems #stocks #bitcoin #btcusd #cryptos #spy #gold #nq #investing #trading #spytrading #spymarket #tradingmarket #stockmarket #silver

Spy ... Reload?The question over the next 2 days will be is this move up real or not.
First, let's look at the position things are in now.
1.Seasonality is very bullish around this time
2. Technicals are oversold and market bounced off some solid supports.
3. Earnings season is about to begin, and in my experience you usually don't see that market crashing in the middle of earning season..
So those are the 3 reasons to want to be long.
Now
look at Spy weekly chart, Zoom out to 2016 and then add your weekly 50ma; what you'll notice is that in every serious correction the Spy has suffered since 2016 the bear market only ends when Spy can close the week back above the Weekly 50ma
The weekly 50ma is currently at
565 , throw in the gap close at 565 and the price action resistance and you got a power line of resistance
I would exit any longs near this area here. We may not knife back down extreme but we could shop and trade between 540-565 and in a extreme bear scenario the short back to 400.00 after rounding off a right shoulder with a couple of weeks of consolidation
But that's an extreme bear scenario and the only reason I'm entertaining it is because what I see on the TVC:DJI and TVC:NYA
Here's TVC:NYA weekly chart
This is probably the biggest rising wedge you'll ever see. Dating back 15yrs , if this was to fall out this would mark the end of the bull run from 2009.
Zoomed in
And you'll see that the weekly 50ma and the prior Wyckoff neck are at the same spot which makes this a power line resistance! I don't expect this to make it back across and I'd be looking at a major short entry here that should coincide with spy tagging its weekly 50ma
TVC:DJI
Exact same chart as NYA
Zoomed in , same scenario as NYA
AMEX:XLK
The biggest sector on AMEX:SPY and a leading indicator on Tech is showing same thing
Weekly chart (Log scale)
So the bad news is in the coming weeks, I think we will be tested and this rally may be a bull trap that stalls out at the weekly 50ma. The good news for bulls is we may have another 3-4% pump before we have to bail 😂..
But first Spy needs to break over 553 or 20sma..
Over 553 and it's a 80% chance 565 comes next. Until then 552-537 is chop so ignore any pullback unless we break back below 525
Personally I think we have enough juice to tag 567 by end of next week.
Remember 537-550 is chop and don't look too much into it
If spy closes any week back above 565 then it's a 75% chance we are headed back to 600...
Let's see what happens

spy had a meaningful run today with strong institutional activiySPY Pre-Market Breakdown – April 9, 2025
Phase 1: 4:00 AM – 5:30 AM – Early Accumulation
The pre-market session began with SPY trading around the 490 level, showing cautious price action in a consolidation pattern. During these early hours, price maintained a relatively tight range between 489 and 491, with minimal directional commitment. Volume remained light during this period, typical of early pre-market hours, but began building steadily as we approached 5:00 AM.
Around 5:00 AM, we observed the first meaningful price movement as SPY began testing higher levels with several green candles pushing toward 494. This early strength coincided with increasing volume, suggesting genuine buying interest rather than just thin market conditions. The price action formed a series of higher lows, establishing a short-term uptrend channel.
What's particularly noteworthy in this phase was the balanced options exposure, with call and put exposure roughly similar , indicating no strong directional bias from options traders yet. This balance suggested market participants were still positioning themselves, waiting for clearer signals before committing to a direction.
Phase 2: 5:30 AM – 7:00 AM – Positioning Builds
The second phase showed increased momentum and clearer directional bias. SPY continued its upward trajectory, breaking through the 494 level and eventually challenging the psychologically important 495 level. Volume began increasing significantly during this period, adding credibility to the price advance.
Around 6:00 AM, we noticed the first significant divergence between call and put activity. Call exposure began increasing relative to put exposure, signaling growing bullish sentiment. The chart is indicating aggressive call buying or put unwinding. This shift in options flow provided an early signal that institutional traders were positioning for higher prices.
Price consolidation occurred between 495-496 with increased volume, suggesting accumulation rather than distribution at these higher levels. The market was digesting gains but showed no signs of significant profit-taking or reversal. The price action formed a pattern of shallow pullbacks followed by renewed buying interest, a behavior often seen when institutions are accumulating positions.
Phase 3: 7:00 AM – 8:45 AM – Execution
The final phase demonstrated the culmination of the positioning seen earlier. Around 7:00 AM, price momentum accelerated with SPY pushing decisively through the 496 level and challenging 497. This breakout was accompanied by a significant increase in volume, confirming the validity of the move.
Options flow data showed an explosion in call activity during this period, with call exposure reaching over 9 million contracts while put exposure remained relatively stable.
Between 7:30 AM and 8:30 AM, we witnessed classic breakout behavior with price establishing itself firmly above previous resistance levels. Any shallow pullbacks were quickly bought, demonstrating strong conviction from buyers. The market is showing some put unwinding alongside continued call buying, suggesting traders were removing downside protection while adding to bullish positions.
The Level II quotes showed a notable imbalance developing with buyers willing to pay up and fewer willing sellers. This order book imbalance further confirmed institutional interest in higher prices.
Final Bias: Bullish
The pre-market session demonstrated a clear bullish bias supported by multiple factors:
Price Structure: A series of higher lows and higher highs throughout the session, breaking through multiple resistance levels with conviction.
Volume Confirmation: Increasing volume on advances and lighter volume on pullbacks, suggesting genuine buying interest and minimal profit-taking.
Options Flow: Progressive increase in call exposure relative to puts, with the final phase showing overwhelming call dominance, indicating institutional positioning for upside.
Order Flow: Aggressive buying on breakouts with minimal selling pressure on pullbacks, suggesting strong hands accumulating positions.
Late Session Stabilization: Price holding gains near session highs with continued buying interest, rather than fading into the regular market open.
Institutions appeared to be positioning for a higher open and potentially continued upside during the regular session. The methodical building of positions throughout the pre-market, rather than a single aggressive spike, suggests this was not merely a reaction to overnight news but rather deliberate positioning ahead of anticipated strength.
Trade Setups with Entry, Stop, Target
Trade 1: Breakout Continuation (High-Conviction)
Entry Zone: 496.50-497.00 on first pullback after market open
Stop-Loss: Below 495.75 (below pre-market consolidation)
Profit Target: 499.50-500.00 (psychological level and round number)
Rationale: Strong pre-market accumulation with increasing call flow suggests continued momentum into regular hours trading.
Trade 2: Dip-Buying Opportunity (Medium-Conviction)
Entry Zone: 494.80-495.20 if market pulls back to test breakout level
Stop-Loss: Below 494.00 (previous resistance becomes support)
Profit Target: 498.00-498.50
Rationale: Pre-market volume and options flow indicate institutions positioned for strength, likely to defend key levels on pullbacks.

Markets bottom on fearA short term relief is due in the coming days.
I will buy QQQ at the opening of the market, for a few days.
Only the fundamentals (and Trump) will decide if it will be the bottom of a correction or the first bottom of a huge market crash.
I am using here:
- The RSI(14), weekly (below 40).
- The ROC(2), daily (below 10%).
- One other personal indicator
- My personal quant strategy

SPY LongSPY Long and Neutral
Down 9% in 2 days, near demand Zone,
Long entry 513
no Stop ,
Target 530
Risk management is much more important than a good entry point.
I am not a PRO trader.
In my trading plan, the Max Risk of each short term trade should be less than 1% of an account.
Sell SPY 250417 P500, Limit 11.31,
Delt= -0.37, expire in 13 days.
No stop, willing to buy SPY at 500 after 15% down from the top, for long term investment

The C wave RallyI figured on a rally, but not this fast and this large. It very well can be a C wave. That means that the possibilities of going lower are actually higher than continuation of this rally. Under 526 on SPY and the market will tank to 450 and possibly lower.

Is SPY Positioned for a Rebound or Continued Decline?Data Speaks About SPY:
1️⃣ Trading above key support zone (480/495): The stock is holding above critical levels, which suggests a potential for stability or a rebound if these levels hold.
2️⃣ Below 10-day MA: Currently trading below the 10-day moving average, indicating short-term bearish sentiment and lack of upward momentum.
3️⃣ Failed attempt to re-enter downward channel after sharp decline: Despite a brief attempt to recover, the price failed to re-enter the downward channel, signaling persistent selling pressure.
🔽 Outlook: While the stock shows oversold conditions, the bearish momentum is still intact. However, as long as it stays above the 480/495 support zone, there’s potential for a rebound.

Trump's Tariff Wars : Why It Is Critical To Address Global TradeThis video, a continuation of the Trump's Tariff Wars video I created last week, tries to show you why it is critically important that we, as a nation, address the gross imbalances related to US trade to global markets that are resulting in a $1.5-$1.8 TRILLION deficit every fiscal year.
There has been almost NOTHING done about this since Trump's last term as President.
Our politicians are happy to spend - spend - spend - but none of them are worries about the long-term fiscal health of the US. (Well, some of them are worried about it - but the others seem to be completely ignorant of the risks related to the US).
Trump is raising this issue very early into his second term as president to protect ALL AMERICANS. He is trying to bring the issue into the news to highlight the imbalances related to US trade throughout the world.
When some other nation is taking $300B a year from the us with an unfair tariff rate - guess what, we need to make that known to the American consumer because we are the ones that continue to pay that nation the EXTRA every year.
Do you want to keep paying these other nations a grossly inefficient amount for cheap trinkets, or do you want our politicians and leaders to take steps to balance the trade deficits more efficiently so we don't pass on incredible debt levels to our children and grandchildren?
So many people simply don't understand what is at risk.
Short-term - the pain may seem excessive, but it may only last 30, 60, 90 days.
Long-term - if we don't address this issue and resolve it by negotiating better trade rates, this issue will destroy the strength of the US economy, US Dollar, and your children's future.
Simply put, we can't keep going into debt without a plan to attempt to grow our GDP.
The solution to this imbalance is to grow our economy and to raise taxes on the uber-wealthy.
We have to grow our revenues and rebalance our global trade in an effort to support the growth of the US economy.
And, our politicians (till now) have been more than happy to ignore this issue and hide it from the American people. They simply didn't care to discuss it or deal with it.
Trump brought this to the table because it is important.
I hope you now see HOW important it really is.
Get some.
#trading #research #investing #tradingalgos #tradingsignals #cycles #fibonacci #elliotwave #modelingsystems #stocks #bitcoin #btcusd #cryptos #spy #gold #nq #investing #trading #spytrading #spymarket #tradingmarket #stockmarket #silver

SPY/QQQ Plan Your Trade For 4-9 : Top/Resistance PatternToday's pattern suggests the SPY/QQQ will attempt to move a bit higher in early trading - trying to identify a resistance area. Then, roll over into a downward price trend.
Be cautious of the overnight price range, potentially already setting the upper boundary of the TOP pattern for today. It can happen that overnight trading sets a PEAK/TOP, and we move into sideways/downward trading related to the current TOP/Resistance pattern.
I believe the US markets will attempt to move upward, toward the $490-500+ level before topping out today. I believe this move will be related to the strong support near the $480 level and will attempt to further establish the downward price channel established by the big breakdown in trend over the past 9+ days.
Ultimately, I believe price is struggling for direction, but I also believe this process (with tariffs) is working out as expected.
This is obviously a very volatile market - so stay cautious as we move into a more consolidated price trend over the next few weeks.
I don't expect the markets to try to make any really big moves over the next 2+ week (unless news hits). At this point, I believe the markets will try to UNWIND the volatility over the next 2+ weeks.
BTCUSD is trading near the lower range of the consolidation phase. This could be the start of the breakdown to the Ultimate Low.
GOLD and Silver are moving higher after forming the base (just as I expected). Metals will likely rally strongly as global fear elevates.
Thank you for all the great comments. I'll try to publish a few new videos today and tomorrow to help everyone out.
Remember, price gives us new information every minute/bar. It is a matter of unraveling the puzzle with price - one bar at a time.
If you like what I do, follow along.
Get some.
#trading #research #investing #tradingalgos #tradingsignals #cycles #fibonacci #elliotwave #modelingsystems #stocks #bitcoin #btcusd #cryptos #spy #gold #nq #investing #trading #spytrading #spymarket #tradingmarket #stockmarket #silver

Trumpenomics - Market Volitility - How low will it go?What we know:
When Trump entered office he said the stock market was too high and he was not investing in the markets.
The Tariffs have caused volatility and a decline in the markets.
Market drops in the past have been between 30% and 60%.
How far do you think the market will drop this time?

Yesterday's SPY shorts - Analysis on entries and algorithmsThis is more of a review of how I utilized the algorithms and HTF intention targets to place strategic option trades yesterday on the SPY LTF (and middle time frame as I left some runners overnight.)
Happy Trading :)

Spy what I see with my little eyeTraders,
Fear, trade wars, WW3, Tariffs and a bunch of I told you soo's..... "You voted for this!" just a bunch of chirping. Because this man got to being a billionaire being a silly goose yeah? What happens when them 401k's start 3x'n, what happens when we see one of the biggest bull markets we have experienced in our lifetime?
I don't know much but I know this..... the bull market may not be over. Just taking a break!
Enjoy the hopium!
Stay Profitable!
Savvy

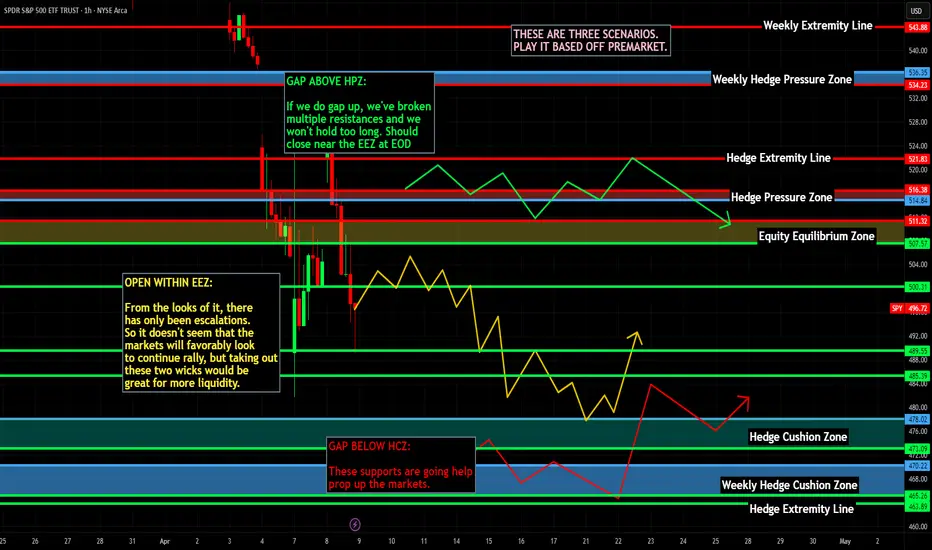
The "Bearish" Short-term Outlook on the marketI apologize - this video was made mid-market yesterday and took a while to download for some reason. So we did subsequently close below the gap and continue downward wherein we closed the multi-day cup at the former low.
I am shorting this overnight and allowing for the subsequent liquidity build to happen (if necessary) before shorting again. There is plenty of more room to the downside if our strong selling was proven (which it seems it was with the incoming gap down).
Happy Trading :)

$SPY $482 needs to hold or we hit $450SPY - SPY has weekly trendline support at $482. Key level where it bounced from this week. If fails to hold that level we have support at $460 and $438. Spy is losing strength on the indicator. High watch

Nightly $SPY / $SPX Scenarios for April 9, 2025🔮 🔮
🌍 Market-Moving News 🌍:
🇺🇸📈 Implementation of New U.S. Tariffs: As of April 9, the U.S. has imposed a 104% tariff on Chinese goods, escalating trade tensions and raising concerns about a potential global economic slowdown.
🛢️📉 Oil Prices Decline Sharply: In response to escalating trade tensions, oil prices have fallen nearly 4%, reaching their lowest levels since early 2021. Brent crude dropped to $60.69 per barrel, while West Texas Intermediate (WTI) declined to $57.22.
📊 Key Data Releases 📊
📅 Wednesday, April 9:
📦 Wholesale Inventories (10:00 AM ET):
Forecast: 0.3%
Previous: 0.8%
Indicates the change in the total value of goods held in inventory by wholesalers, reflecting supply chain dynamics.
🗣️ Richmond Fed President Tom Barkin Speaks (11:00 AM ET):
Remarks may shed light on economic conditions and policy perspectives.
📝 FOMC Meeting Minutes Release (2:00 PM ET):
Provides detailed insights into the Federal Reserve's monetary policy deliberations from the March meeting.
⚠️ Disclaimer: This information is for educational and informational purposes only and should not be construed as financial advice. Always consult a licensed financial advisor before making investment decisions.
📌 #trading #stockmarket #economy #news #trendtao #charting #technicalanalysis
Warning Relief Rally Maybe DelayedLooking how closed tonight on that support
does not bond well for me
So if we break that low I am out long and will short SPY
Add IWM MAGS short they make new lows
Add TZA new high. Guys it breaks we will just drop few days 450 lower
We hold that good also banks Friday earnings can be a NASTY day tomorrow rest week

SPY | Things Could Get Ugly | ShortSPDR S&P 500 ETF Trust seeks to provide investment results that, before expenses, correspond generally to the price and yield performance of the S&P 500 Index. The Trust seeks to achieve its investment objective by holding a portfolio of the common stocks that are included in the index (the "Portfolio"), with the weight of each stock in the Portfolio substantially corresponding to the weight of such stock in the index.
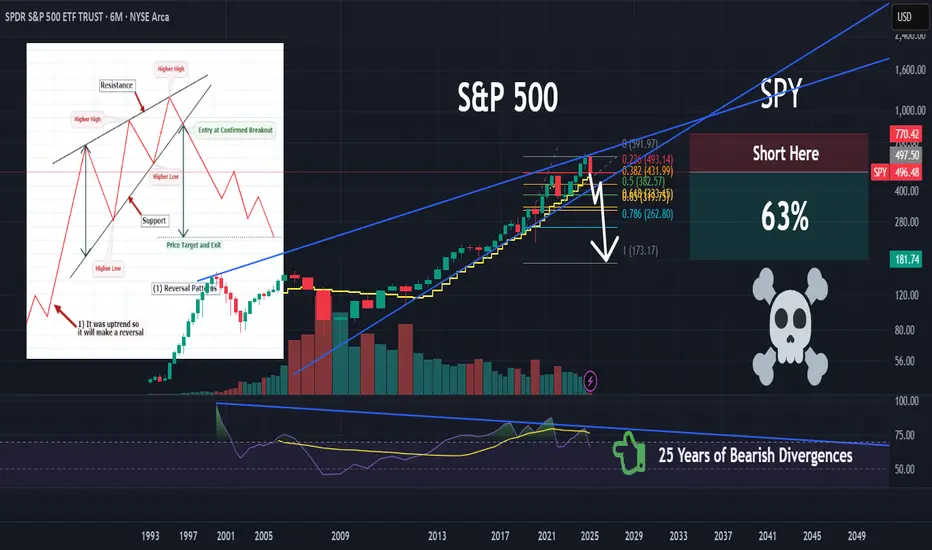
SPY Technical Breakdown & Macro Context1. Big-Picture Narrative
There’s increasing talk of a “104% China Tariff,” bringing back memories of Donald J. Trump’s 1988 loss in a piano auction to a Japanese buyer—an event some speculate influenced his later calls for high import taxes. Fast-forward to today, and concerns about renewed tariff escalation add extra pressure on the markets. The user’s view: unless there’s a political shift—where Republicans become more concerned about broader voter sentiment than aligning with Trump—this could drive the S&P 500 down to 3000. While that is quite a distance from current levels, it underscores how aggressive policy moves (tariffs, trade wars) can weigh heavily on equities.
2. Hourly & Daily Chart Overview
Short-Term (Hourly)
Price has trended steadily downward, with each bounce finding new sellers at lower highs.
Key Levels on the chart include:
510.84 (L. Vol ST 1a) – A noteworthy pivot-turned-resistance.
498.01 (L. Vol ST 2a) – Important resistance-turned-support level that recently broke.
485.18 (H. Vol Sell Target 1a) – Currently acting as near-term support.
472.35 (Weeks High Short) – Further support below 485.
Longer-Term (Daily)
The broader trend remains bearish, with high-volume selling in the last few sessions.
RSI on the daily is dipping into the 30s, indicating oversold conditions—but remember that oversold can persist in a strong downtrend.
Elevated ATR (14) around 16 suggests volatility remains high; large intraday swings can occur.
3. Possible Trade Setups
A) Bearish Continuation (Primary)
Entry Trigger:
A failure to reclaim 498 (L. Vol ST 2a) or a decisive break below 485.18 on strong volume.
Profit Targets:
First Target: 472.35 (Weeks High Short)
Second Target: 459.52 (Half 1 Short) for a larger downside move
Extreme Target: If policy missteps intensify and no political moderation occurs, the user foresees a slide to S&P 3000—an extreme scenario but a reminder of how macro risks can extend a downtrend.
Stop Loss:
Just above 500–502 if you’re entering on a breakdown, to protect against whipsaw should SPY manage a strong recovery above key resistance.
B) Oversold Bounce (Alternative)
Entry Trigger:
A strong reclaim of 498–500 and at least one hourly close above it, indicating buyers have stepped in.
Profit Targets:
First Target: 510.84 (L. Vol ST 1a)
Second Target: 523.67 (Best Price Short level) if bullish momentum accelerates
Stop Loss:
Below 485 to limit risk in case the rally fails and downtrend resumes.
4. Macro & Political Watch
Tariffs & Trade Policy: New or increased tariffs can rapidly shift market sentiment. Keep an eye on headlines for abrupt policy changes or legislative updates.
Political Dynamics: If Republicans shift their stance or emphasize broader voter concerns over aligning with Trump’s trade approach, it might calm markets. Conversely, unwavering support for tariff policies could amplify market downside.
Economic Indicators: In addition to politics, watch earnings releases and consumer data. If the economy shows unexpected weakness amid tariff concerns, selling pressure could intensify.
5. Final Thoughts
Volatility is Elevated: Intraday whipsaws are common; stay disciplined with stop-loss placements.
Bearish Bias Persists: The trend is clearly down unless bulls can reclaim key resistance levels with conviction.
Manage Risk: Always size positions appropriately given the current volatility, and remain prepared for sudden news-driven moves.
In summary, tariffs and politics remain a focal point, with historical anecdotes highlighting how personal experiences can shape trade policy. Whether SPY crashes all the way to 300 (S&P 3000) depends on how severe and prolonged these headwinds become. Keep a close eye on technical levels, watch for policy announcements, and maintain a vigilant approach to risk management.

SPY: TA-Market Chaos Calls for Smart Eyes, Not Just Smart ChartsThe market isn't playing fair lately. Classic TA setups are getting invalidated. Support zones crumble in seconds. Even golden cross setups fizzle out.
But this isn’t the time to quit—it’s the time to get tactical.
When technicals break, the silent signals from the options market become louder. That’s where Gamma Exposure (GEX) step in. This week, we saw aggressive institutional repositioning, unexpected volatility, and coordinated rotations into both risk and safety assets.
Let’s talk about SPY, our macro compass. Then we’ll dive into stock-specific GEX sentiment and options setups that still offer alpha.
🔎 SPY – Institutional Tug-of-War
Trend: SPY is forming a falling wedge, which could break either way. Price is sitting just above $500, after tagging the Highest Negative GEX / PUT Wall around $505–$502, which held on Friday.
GEX & Options Flow:
* PUTs at 84.7% dominate the board.
* IVR is 121.8, showing high implied volatility demand.
* Strong support from PUT walls at $502, while CALL resistance at $547–$551 could suppress any upside.
Outlook:
* If $502 breaks, momentum could drag us toward $490 or even $475.
* Bulls need to reclaim $520, flipping the key Gamma Wall.
Strategy Suggestion:
For options, consider SPY put spreads if below $505, or long SPY calls above $520 for quick squeezes—preferably with tight expiry (0DTE or 2DTE) to ride the gamma wave.

$SPY the final leg down? Bottom between $400 - $441It's looking like we're going to break the low I originally had at $481 from the top at $612.
The next most likely target is $441, and if we break that $414.
Both of those levels are good long term buys, the move should happen this week (and likely tomorrow) and that should mark the bottom for the market.

SPY/QQQ Plan Your Trade Update For 4-8 : Absolute PerfectionThank you. Thank you to all of you who follow my videos and believe in my research.
The last few days/weeks have been absolutely incredible.
My SPY Cycle Patterns, on average, are about 70-80% accurate over a 12-month span of time. There are things, like news and big events (elections, outside forces, big news) that can disrupt any market trend and completely invalidate my SPY Cycle Patterns.
But, when the markets are generally left to their own accord, the SPY Cycle Patterns play out almost perfectly.
Yes, traders need to learn to adopt a PLAN A vs. PLAN B mentality with my SPY Cycle Patterns.
If Brad is right - this will happen. And if Brad is wrong, the opposite will likely happen.
But, the comments I've been receiving over the past 20+ days have been incredible.
Thank you.
Knowing that I'm reaching a larger group of people now (than when I started doing these videos about a year ago) and knowing that some of you are really seeing some BIG GAINS following my research is simply incredible.
I started doing these videos to prove my research and tools were incredible solutions for traders. But, at the same time, I started doing this to combat some of the scammers that are out there.
In my world, watching people (or hearing from them) after they've been scammed a couple of times is heartbreaking.
Most people put a lot of time and effort into trying to become skilled traders. I get it.
That's why I'm doing this - to show you the right path and to show you that price is the ultimate indicator.
Again, thank you from the bottom of my heart. Keep sending me those success stories and...
GET SOME.
#trading #research #investing #tradingalgos #tradingsignals #cycles #fibonacci #elliotwave #modelingsystems #stocks #bitcoin #btcusd #cryptos #spy #gold #nq #investing #trading #spytrading #spymarket #tradingmarket #stockmarket #silver
