Multi Market Update 7-9-2025SPY likely put in a C wave this morning, I expect a further move down for the rest of the week. Gold starting to look bullish again. Natural Gas likely keeps dropping towards 2.5. BTC at the top of it's range. USOIL is at resistance. The stock I'm trading - aapl - is showing a bear flag on small time frames
SPY trade ideas

Nightly $SPY / $SPX Scenarios for July 9, 2025🔮 Nightly AMEX:SPY / SP:SPX Scenarios for July 9, 2025 🔮
🌍 Market-Moving News 🌍
📦 Tariff Pause Extended to August 1
President Trump delayed the July 9 tariff deadline, pushing negotiations into early August. Markets reacted with muted volatility, suggesting growing comfort that deals will be struck—yet widespread uncertainty remains
💵 Junk Bonds Rally Amid Tariff Tangling
Despite ongoing tariff risks, investors are doubling down on U.S. high-yield (junk) bonds. They anticipate the Fed may refrain from tightening further—favoring spread-tightening to around 7–8% yields—reflecting confidence in credit quality
🏦 Fed Faces Tough Call on Rate Path
New business surveys show conflicting signals: mixed revenue outlooks, cautious spending, and ongoing tariff pressures. The Fed must weigh slower growth against inflationary risks—keeping the door open to rate cuts in the autumn but unlikely before September
📊 Equities Firm Amid Tariff Uncertainty
Stocks showed resilience—S&P 500 and futures held position—after Monday’s tariff-triggered dip. Dip-buying and expectations of extended trade talks kept markets steady despite policy noise
📊 Key Data Releases & Events 📊
📅 Wednesday, July 9:
All Day – Ongoing U.S.–tariff negotiations; markets focused on any progress toward formal deal-making or extension terms.
Midday – Watch for headlines on tariff letters to 14 countries and any movement in trade discussions.
⚠️ Disclaimer:
This information is for educational and informational purposes only and should not be construed as financial advice. Always consult a licensed financial advisor before making investment decisions.
📌 #trading #stockmarket #economy #tariffs #Fed #fixedincome #credit #technicalanalysis

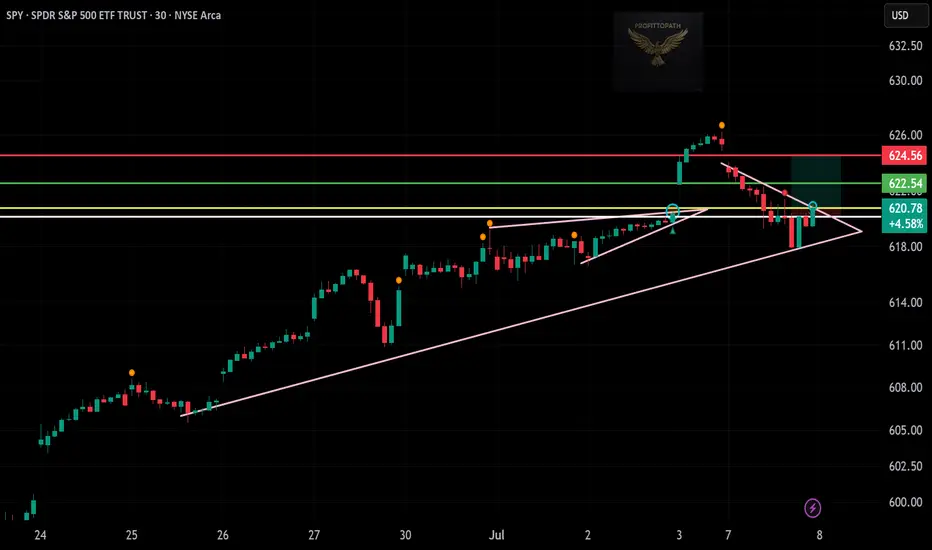
SPY Breakout Setup – Bullish Pattern Watch! 📈 🟢
SPY has formed a clear ascending triangle with strong support at $616. After a pullback, it’s now breaking out above $620.78 with a bounce from trendline support and rejection of lower prices.
📌 Trade Details:
🔹 Entry: $620.78
🔹 Stop Loss: $616.00
🔹 Target: $624.56
🔹 Pattern: Ascending Triangle Breakout
This setup aligns with market momentum and breakout structure. Great risk-reward for bulls watching major index movement.
—
📊 Posted by: ProfittoPath
#SPY #SP500 #ETFTrading #BreakoutSetup #MarketUpdate #ProfittoPath #TechnicalAnalysis #StockTrader #ChartAnalysis
Nightly $SPY / $SPX Scenarios for July 8, 2025🔮 Nightly AMEX:SPY / SP:SPX Scenarios for July 8, 2025 🔮
🌍 Market-Moving News 🌍
📉 U.S. Stocks Slip on New Tariff Threats
President Trump announced plans to impose 25% tariffs on imports from Japan, South Korea, Malaysia, Kazakhstan, South Africa, Laos, and Myanmar starting August 1, reigniting trade jitters. The Dow fell ~0.9%, the S&P 500 dropped ~0.8%, and the Nasdaq slid ~0.9% on the news, while bond futures rallied and the dollar strengthened
⚖️ Tariff Pause Deadline Looms
Markets are focused on the July 9 deadline for the current tariff pause, which now hinges on imminent trade negotiations. Investors are balancing the risk of reimposition against progress with agreements involving the U.K., Vietnam, and Canada
💵 Consumer Credit Moderates
June’s consumer credit increase slowed to $10.60 billion vs. April’s $17.87 billion—still strong, but a cooling sign in household borrowing patterns. This tempered the dollar’s rise amid mixed signals on consumer resilience.
🛢️ Oil Drops on Rising OPEC+ Supply
Oil prices fell, with Brent dipping to ~$68.00/barrel and WTI to ~$65.30, after confirmation of OPEC+’s August supply hike—adding to bearish cues for energy stocks .
📊 Key Data Releases & Events 📊
📅 Tuesday, July 8:
3:00 PM ET – Consumer Credit (June)
Moderation in borrowing signals possible easing in consumer-driven growth.
4:30 PM ET – API Weekly Crude Inventories
A key indicator for energy markets; lower inventories lift oil prices, while builds push them down.
Throughout the Day – Tariff Pause Deadline
Market stability hinges on whether trade agreements materialize before the break expires.
⚠️ Disclaimer:
This information is for educational and informational purposes only and should not be construed as financial advice. Always consult a licensed financial advisor before making investment decisions.
📌 #trading #stockmarket #economy #tariffs #consumercredit #oil #technicalanalysis

Weekly $SPY / $SPX Scenarios for July 7–11, 2025🔮 Weekly AMEX:SPY / SP:SPX Scenarios for July 7–11, 2025 🔮
🌍 Market‑Moving News 🌍
📈 From Panic to "Goldilocks" Rally
The S&P 500 and Nasdaq hit fresh record highs, surging ~20% from April lows. Markets rallied on a combination of easing Middle East tensions, the 90‑day tariff pause, a new fiscal bill in Washington, and strong June jobs data. Still, strategists caution that optimism may be ahead of fundamentals, especially if trade volatility returns
💱 Dollar Weakness & Bond Market Watch
The U.S. dollar remains near 3.5‑year lows amid rate‑cut speculation and trade progress. Treasury yields are volatile this week, impacted by concerns over escalating debt issuance, upcoming tariff deadlines (July 9), and the Federal Reserve’s stance .
🏢 Tech Leadership Shifts
With the “Magnificent Seven” tech stocks near heights, growth is spreading: cyclical sectors, small‑caps, and industrials are gaining momentum. AI remains the primary engine, but resilience across a broader stock base is signaling a potentially sustainable rally
⚠️ Tariff Truce Deadline Looms (July 9)
The April tariff pause expires mid‑week. U.S. plans to extend exemptions via trade talks with partners like UK, Vietnam, and Canada—yet any delay or failure may shock markets. Watch for headlines that may trigger spillover effects .
📊 Key Data Releases & Events 📊
📅 Monday, July 7:
Independence Day markets resume. Light trading expected ahead of data and tariff deadline.
📅 Tuesday, July 8:
10:00 AM ET – Consumer Credit (June)
Gauges borrowing trends—an indicator of household health in a low‑rate environment.
📅 Wednesday, July 9:
EIA Crude Oil Inventories & MBA Mortgage Apps & Wholesale Inventories
Key mid‑week data points; oil builds may pressure energy stocks.
Tariff Pause Deadline – Expect market volatility on news of extension or reimposition.
📅 Thursday, July 10:
8:30 AM ET – Initial & Continuing Jobless Claims
10:00 AM ET – Natural Gas Inventories
Markets focus on labor health and energy trends.
📅 Friday, July 11:
10:00 AM ET – Treasury Budget Statement
Details on government borrowing and fiscal outlook—markets sensitive to deficit risks.
⚠️ Disclaimer:
These insights are for educational purposes only—not financial advice. Consult a licensed advisor before making investing decisions.
📌 #trading #stockmarket #economy #news #tariffs #Fed #AI #technicalanalysis
SPY: Bearish Continuation & Short Trade
SPY
- Classic bearish pattern
- Our team expects retracement
SUGGESTED TRADE:
Swing Trade
Sell SPY
Entry - 625.36
Stop - 633.00
Take - 611.27
Our Risk - 1%
Start protection of your profits from lower levels
Disclosure: I am part of Trade Nation's Influencer program and receive a monthly fee for using their TradingView charts in my analysis.
❤️ Please, support our work with like & comment! ❤️

Update on the Markets 7/3/25SPY got the pop up I was looking for - now the question is - does it hold and continue? Not sure yet. Gold could be bullish if it gets over 3370. Usoil had a pop but nothing screaming reversal yet. NG is in a wedge. BTC is at the top of it's range

Opening (IRA): SPY July 18th 495 Short Put... for a 5.13 credit.
Comments: Targeting the <16 delta strike paying around 1% of the strike price in credit.
Max Profit: 5.13
ROC at Max as a Function of Strike Price: 1.04%
Will generally look to roll up if the short put is in profit at 45 DTE or greater, add at intervals if I can get in at strikes better than what I currently have on at the June 513's and July 495's, and/or consider a "window dressing" roll (i.e., a roll down to a strike that is paying about the same in credit) to milk the last drops out of the position.

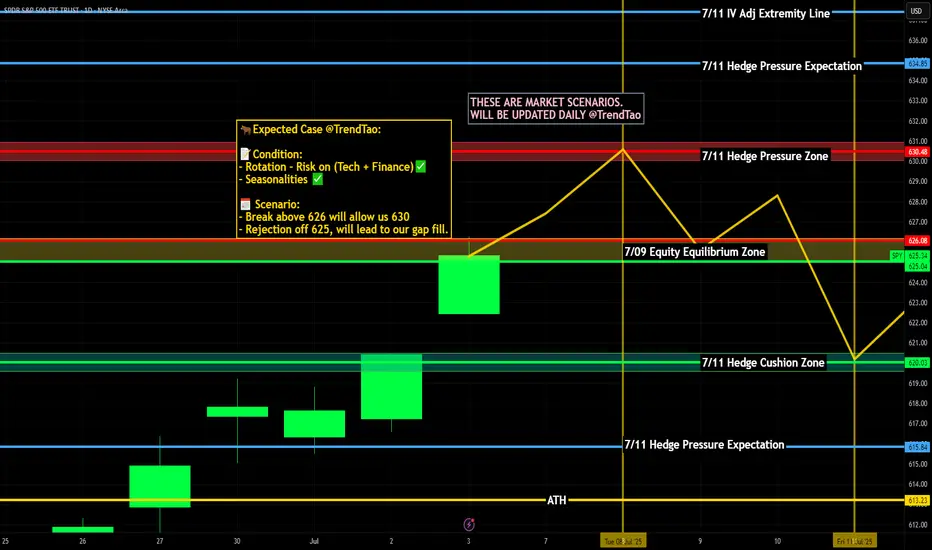
SPY 4HSResistance: 630 – Strong supply zone, potential profit-taking area.
Support Zone: Around 617 – Recently tested, holding as short-term support.
Gap: 615.03 → If SPY loses 617, watch for a retracement to fill the gap toward 615.
Major 4H Support: 610.17 – Institutional block. Losing this level would break the short-term bullish structure.

Long Trade Idea: SPY (S&P 500 ETF)!🧠
📅 Timeframe: 30-Minute
📈 Type: Long Position
📐 Setup: Tight consolidation breakout + bullish wedge pattern
📍 Trade Details:
Entry: $620.39 (breakout from rising wedge)
Stop Loss: ~$618.80 (below wedge support)
Target 1: $622.34 (minor resistance)
Target 2: $624.56 (major resistance zone)
🔎 Technical Breakdown:
Price formed a tight rising wedge, squeezing under resistance
Bullish breakout confirmed above consolidation
Strong uptrend continuation — higher highs + higher lows
SPY remains strong despite market hesitation
🎯 Risk/Reward Outlook:
Risk: ~$1.59
Reward: Up to ~$4.17
RR > 2.5:1 — ideal structure for breakout traders
💬 Caption (for Social/Chart Post):
“SPY breaks higher! 💥📈
Wedge breakout signals bullish momentum 🟢
Clean setup toward $624+ zone 🔓
Watch for continuation above $622.34!”
#SPY #LongTrade #BreakoutSetup #S&P500 #ProfittoPath #ETFTrading

SPY - TargetsWatching this wedge, Trump making headwinds with trade talks, striking a vietnam deal. Buyers still in control but hesitant, the "Big Beautiful Bill' being hashed out in the next couple of weeks. Could easily see a small pull back into the EMA's, Betting we see prices higher to the bullish target $700 if we can break above T/L with nice volume.

update on the markets 7/2/2025SPY continues to move up and I think a bit higher is likely still, although the bearish divergences are warning that another high may not hold. Gold may be bullish if it can push a bit higher. NG still looks bearish overall. USOIL also looks bearish. BTC is trying to breakout, but might not be able to just yet.

FED SPY INFLATION UNEMPThe variables attached have an important roll in economics stability.
Pay attention!

Nightly $SPY / $SPX Scenarios for July 2, 2025🔮 Nightly AMEX:SPY / SP:SPX Scenarios for July 2, 2025 🔮
🌍 Market-Moving News 🌍
🏭 U.S. Manufacturing Remains Under Pressure
The ISM Manufacturing PMI for June rose slightly to 49.0 from 48.5 in May—still in contraction territory. Tariff-induced uncertainty and rising input costs continue to weigh on factory activity, with new orders still weak and employment contracting
📈 Global Factory Rebound Led by India & Europe
While U.S. factories struggle, India hit a 14-month high in its manufacturing PMI at 58.4, and euro‑zone factory orders stabilized at 49.5—the first sign of recovery in over three years. Asia-Europe divergence may shift global capital flows .
🏦 Powell Says Tariffs Are Delaying Rate Cuts
Fed Chair Powell warned at the ECB forum in Sintra that elevated inflation—driven in part by Trump-era tariffs—has postponed the timeline for U.S. rate cuts. The Fed’s dot-plot now indicates only two cuts for 2025, with markets adjusting accordingly
💵 Dollar Nears 3½-Year Lows
The U.S. dollar weakened further, trading near a three-and-a-half-year low amid soft PMI data, a dovish Fed tilt, and renewed optimism over U.S.–Canada trade talks
📊 Key Data Releases & Events 📊
📅 Wednesday, July 2:
(No major scheduled U.S. economic data)
Market focus shifts to upcoming Nonfarm Payrolls on July 3, Powell's remarks, and trade-talk headlines.
⚠️ Disclaimer:
This information is for educational and informational purposes only and should not be construed as financial advice. Always consult a licensed financial advisor before making investment decisions.
📌 #trading #stockmarket #economy #manufacturing #Fed #inflation #charting #technicalanalysis

Update on the markets 7-1-2025SPX still floating but IWM and DJT are both having strong rallies, which usually means SPX will go higher today or tomorrow. Gold is at resistance. NG is a support. OIl still looks like a bear flag. BTC is pulling back from 107k - again.

$SPY Review of 6.30.25Yesterday’s price action was flat near previous ATH’s for the first part of the day and then the second part of the day we had some nice volatility that tapped the top of the implied move at 619 and then pulled back.

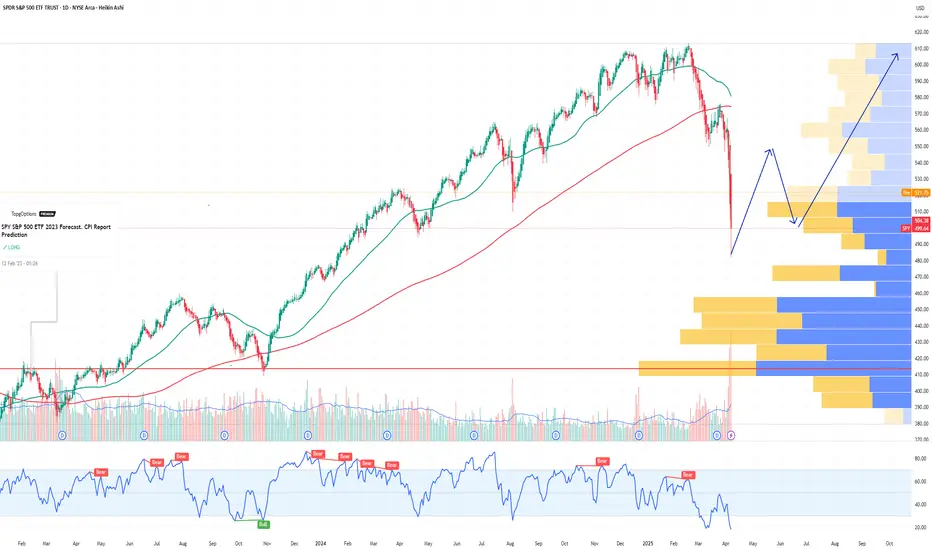
SPY S&P 500 ETF Potential W-Shaped Recovery Forming We may be witnessing the formation of a W-shaped recovery on the SPY (S&P 500 ETF) – a classic double-bottom structure that often signals a strong reversal after a period of correction or volatility. Let’s dive into the technicals and what this could mean in the sessions ahead.
🔍 The Technical Setup:
SPY recently tested key support around the $485-$500 zone, bouncing off that area twice in the past few weeks. This gives us the left leg of the W and the first bottom. After a modest relief rally to ~$520, we saw another pullback – but this second dip failed to break below the first bottom, a hallmark of the W-pattern.
As of today, SPY is starting to reclaim ground toward the $517-$520 resistance zone. If bulls can push through this neckline area, especially with volume confirmation, we could see a breakout that targets the $530-$535 area in the short term.
🔑 Key Levels to Watch:
Support: $490-$500 (double-bottom support zone)
Neckline/Resistance: $530
Breakout Target: $550 (previous highs)
Invalidation: A break below $490 with volume could invalidate the W-recovery idea and shift bias bearish.
📊 Momentum & Volume:
RSI is climbing back above the 50 level – bullish momentum building.
MACD shows a potential crossover forming, hinting at a shift in trend.
Watch for increasing buy volume as SPY approaches the neckline – that’s where the bulls will need to step up.
🧠 Macro & Earnings Angle:
Don’t forget – we’re entering a heavy earnings season and rate cut expectations are still a wildcard. A dovish tone from the Fed and strong corporate results could be the fuel that sends SPY higher to complete this W-shaped recovery.
🧭 Final Thoughts:
This is a high-probability setup if neckline resistance is broken cleanly. Wait for confirmation before going heavy – fakeouts are common in double-bottom scenarios. If we do get the breakout, we may be looking at a broader market rebound going into summer.
🔔 Set alerts near $525. A confirmed breakout could mean the bulls are back in charge.
Nightly $SPY / $SPX Scenarios for July 1, 2025 🔮 Nightly AMEX:SPY / SP:SPX Scenarios for July 1, 2025 🔮
🌍 Market-Moving News 🌍
📊 Core Inflation Edges Higher
May’s core inflation rose unexpectedly to 2.7% year-over-year, up from 2.6%, casting uncertainty over the Fed’s timeline for rate cuts. While headline CPI sits at 2.3%, the resilience in underlying prices complicates policymakers’ projections for later this year
💵 Weak Dollar, Rising Rate-Cut Bets
Markets are reacting to “summertime data”—like the core CPI uptick—with renewed optimism. Traders now see up to 75 bps in Fed rate cuts later this year, while the dollar remains near 3½-year lows on concerns about Powell’s independence and trade developments
🇨🇦 U.S.–Canada Trade Talks Resume
Trade talks between the U.S. and Canada restarted today, following Ottawa’s suspension of its digital-services tax. Progress toward a broader agreement could reduce tariff risk and offer further relief to risk assets
📊 Key Data Releases & Events 📊
📅 Tuesday, July 1:
All Day – U.S.–Canada Trade Talks
Markets will watch for updates on tariff resolution and broader trade deals. Any breakthrough could notably boost equities and improve trade sentiment.
10:00 AM ET – ISM Manufacturing PMI (June)
A below-50 reading again would reinforce the narrative of industrial weakness. A rebound could support equities and temper recession concerns
10:00 AM ET – JOLTS Job Openings (May)
Still at elevated levels (~7.39 million in April), this metric assesses labor-market resilience. A decline could shift rate-cut expectations.
⚠️ Disclaimer:
This is for educational and informational purposes only. It does not constitute financial advice. Consult a licensed financial advisor before investing.
📌 #trading #stockmarket #economy #news #trendtao #charting #technicalanalysis

SPY/QQQ Plan Your Trade For 6-30-25 : Gap Potential PatternToday's pattern suggests the SPY will attempt to create a GAP at the open. It looks like the markets may attempt to move higher as the SPY is already nearly 0.35% higher as I type.
Last week was very exciting as we watched the QQQ and the SPY break into new All-Time Highs.
I suspect the markets will continue a bit of a rally into the early Q2 earnings season where retail traders attempt to prepare for the strong technology/innovation/AI earnings data (like last quarter).
I do believe this rally is due for a pullback. I've highlighted this many times in the past. Typically, price does not go straight up or straight down. There are usually multiple pullbacks in a trend.
So, at this point, the markets are BULLISH, but I still want to warn you to stay somewhat cautious of a pullback in the near future (maybe something news-related).
Gold and Silver should start to move higher over the next 5-10+ days, with gold trying to rally back above $3450. I see Gold in a solid FLAGGING formation that is moving closer to the APEX pattern.
Bitcoin is nearing a make-or-break volatility point. I see BTCUSD breaking downward, but it could break into a very volatile phase where it attempts to rally (with the QQQ through earnings), then collapse later in July. We'll see how things play out.
Remember, tomorrow morning I have a doctor's appointment. So I may or may not get a morning video done. FYI.
Get some today.

Market BreadthMarkets are still in 'Bull' mode going into the 4th. Keeping a eye on the 9-EMA which I use as a trailing stop on my long positions. Not likely to pick up any new positions for now.

SPY Rejected at Gamma Wall–Watch $610 Breakdown or $615 Reclaim🧠 GEX-Based Options Sentiment:
SPY closed Friday with a rejection off the Highest Positive Net GEX / Gamma Wall at $615, with sellers defending the upper structure near the 2nd Call Wall at $620.
Support now lies in the $608–$604 range, with $605.54 and $604.45 aligning with GEX magnets and prior structure. Below that, there’s a gap to the HVL zone near $599, and the gamma floor starts deep around $591, which is also defended by the 2nd and 3rd PUT Walls.
Implied Volatility Rank is 12.2, with IVX below average. This implies premium selling could be dominant unless we break key levels. Meanwhile, PUT flow dominates at 31.9%, showing a clear defensive posture by institutions.
🔧 Options Trade Setup (for Monday–Wednesday):
Bearish Setup:
If SPY confirms under $610, especially during the first hour Monday, it could trigger a fade toward $605 or even $599 HVL.
Consider a PUT debit spread like 610p/600p (Jul 3).
Stop out if price reclaims $613.50–$615 cleanly.
Bullish Setup:
If SPY holds $610 and reclaims $615 with force, it can squeeze into the GEX void toward $620–$622.
Consider a CALL debit spread like 615c/620c (Jul 3).
Stop if price breaks back under $610 with volume.
📉 Intraday Technical Breakdown (1H Chart):
We now have back-to-back CHoCHs printed below rising wedge structure, followed by a failed retest at the top. This is a textbook sign of exhaustion. The final BOS and CHoCH from Friday confirmed that buyers lost short-term control.
The current structure is rolling over with lower highs, and SPY is now trading inside a descending micro-channel after rejection at $615.
Volume picked up on the Thursday/Friday rejection, which adds weight to the downside scenario unless we open strong Monday.
📌 Key Levels to Watch:
$617.00 – Upper Gamma ceiling
$615.00 – Gamma Wall & recent supply zone
$613.50 – Mid-level rejection pivot
$610.00 – Structure support now under threat
$608.48 – Intraday gamma magnet
$605.54 / $604.45 – Strong confluence support zone
$599.49 – HVL target zone
$591.90 – Gamma floor if broader selloff triggers
✅ Thoughts and Monday Game Plan:
SPY looks vulnerable under $610 — this is the most important level to watch. If that breaks and holds below in the first 30–60 minutes, we likely fade to $605 or lower.
The ideal trade setup would be to short the retest of $610 from below, or buy PUTs on confirmed weakness into the gamma air pocket. Alternatively, wait for a high-volume reclaim of $615 to trade with the bulls, but until then, the path of least resistance is down.
Macro catalysts are light, but pre-holiday positioning could bring volatility — stay nimble.
Disclaimer:
This analysis is for educational purposes only and not financial advice. Always use proper risk management and trade with a plan.

Weekly $SPY / $SPX Scenarios for June 30 – July 3, 2025🔮 Weekly AMEX:SPY / SP:SPX Scenarios for June 30 – July 3, 2025 🔮
🌍 Market-Moving News 🌍
📈 US Stocks Rally to Record Highs
Following a volatile first half, U.S. equities surged into record territory in late June on a combination of easing Middle East tensions, cooling inflation data, and the 90-day tariff pause
💵 Dollar Weakens on Fed and Trade Uncertainty
The U.S. dollar fell to a 3½-year low, pressured by persistent speculations over President Trump replacing Fed Chair Powell and extending rate-cut expectations, as well as progress in U.S.-Canada trade talks
🇨🇦 U.S.–Canada Trade Talks Lift Sentiment
Canada temporarily repealed its digital services tax to facilitate talks seeking a broader trade agreement by July 21, boosting U.S. equity futures
🛢️ Oil Prices Stabilize
After spiking on geopolitical fears, oil traders settled between $65–78/bbl amid supply relief following ceasefire developments and easing Middle East risks
⚠️ July Risks Loom
The coming week will spotlight:
July 4 deadline for Trump’s tax bill
Expiry of the tariff pause on July 9
U.S. Nonfarm Payrolls on July 3
Each poses potential for increased volatility if outcomes disappoint
📊 Key Data Releases & Events 📊
📅 Monday, June 30
9:45 AM ET – Chicago PMI (June): Gauge of Midwestern factory activity
📅 Tuesday, July 1
U.S. markets open, watch trade developments
📅 Wednesday, July 2
Global PMI readings released
📅 Thursday, July 3 (Early close ahead of Independence Day)
8:30 AM ET – Nonfarm Payrolls (June)
8:30 AM ET – Unemployment Rate (June)
8:30 AM ET – Average Hourly Earnings (June)
These labor metrics will be critical for Fed rate outlooking
⚠️ Disclaimer:
This information is for educational and informational purposes only and should not be construed as financial advice. Always consult a licensed financial advisor before making investment decisions.
📌 #trading #stockmarket #economy #jobs #Fed #oil #trade #technicalanalysis

~ June 19th 2025 - S&P 500 SPY ...new all time high ...S&P 500 SPY broke recent resistance 604.45 & closed above Feb 19th/ 25 all time high of 613.23 on Friday. Will be watching the open on Monday .... specifically Friday's all time high closing number 614.91
