SPY trade ideas
SPY Market Analysis - 14/3/2025
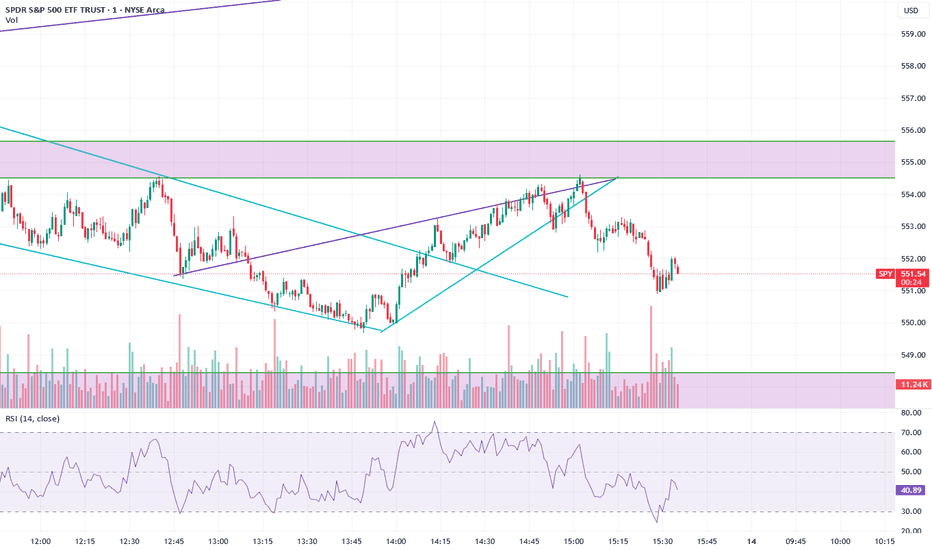
The bears got a tight bear channel down which means persistent selling.
The current leg down is in the form of a 9-bar bear microchannel. There could be sellers above the first pullback.
The selling pressure has been stronger (big bear bars, consecutive bear bars) as compared with the weaker buying pressure (bull bars with no follow-through buying).
The bears want a measured move to around 5400 in the SPX which is just 100 points away fro yesterday's low.
If the market trades higher, the bears expect at least a small second leg sideways to down to retest the current leg low (Mar 13).
The bulls see the move down as climactic.
They hope to get a reversal from a parabolic wedge.
The problem with the bull's case is that the bull bars have no sustained follow-through buying.
They need to create consecutive bull bars trading near their high to convince traders that they are back on control.
The move down has been strong. The market remain Always In Short.
If there is a pullback, odds favor a second leg sideways to down to retest the current leg extreme low (Mar 13).
There could be sellers above the first pullback from the 9-bar bear microchannel.
For now, traders will see if the weekly candlestick will close with a long tail below (like the last 2 weeks).
Or will the market retest yesterday's low and close the week near its low instead?
SPY - support & resistant areas for today March 14, 2025The key support and resistance levels for SPY today are above.
Follow me to get this notified when I publish in the morning.
Understanding key levels in trading can provide valuable insights into potential market movements. These levels often indicate where prices might reverse or consolidate, serving as important signals for traders considering long (buy) or short (sell) positions.
Calculated using complex mathematical models, these levels are tailored for today's trading session and may evolve as market conditions change.
If you find this information beneficial and would like to receive these insights every morning at 9:30 AM, I invite you to support me by boosting this post and following me @OnePunchMan91. Your engagement is greatly valued! However, please note that if this post doesn’t receive more than 10 boosts, I will have to reconsider providing these daily updates. Thank you for your support!
Need any other charts daily, comment on this.
SPY/QQQ Plan Your Trade For 3-14-25: Temp BottomToday's Cycle Pattern is a Temporary Bottom pattern. I suspect the markets may attempt to move a bit lower in early trading before attempting to find a new base/support level.
Yesterday's low may prove to be very important depending on what the markets do today. Initially, I thought yesterday's low was the Temporary Bottom pattern (one day early). But, I do believe the markets will continue to be volatile in early trading today and may move downward to retest lows before trying to move higher - setting up the Temporary Bottom pattern.
Gold and Silver will likely continue to melt upward unless there is some big news that disrupts the US Dollar's downward slide. I see Gold trying to rally above $3200 very quickly over the next 15+ days.
Bitcoin is still consolidating and is currently in a short upward price phase (much like the SPY/QQQ). In fact, the SPY/QQQ and Bitcoin are all in an EPP consolidation phase.
So, that means even though we may see a volatile type of price move over the next 15-30+ days, price is ultimately trapped in a consolidated price range and will/should attempt to break downward into the Ultimate Low.
Therefore, if we get a moderate pullback/rally phase over the next 5+ trading days, be aware that the rally upward will end near March 21-24 and turn downward very sharply before the end of March (based on my research).
You have lots of opportunity if this base sets up for a moderate rally in the SPY/QQQ, but play it cautiously as I don't believe we'll see new ATHs anytime soon.
Get some.
#trading #research #investing #tradingalgos #tradingsignals #cycles #fibonacci #elliotwave #modelingsystems #stocks #bitcoin #btcusd #cryptos #spy #gold #nq #investing #trading #spytrading #spymarket #tradingmarket #stockmarket #silver
3/14/2025 SPY reversal or just a lil' bit more before a bounce? Key Observations:
1. Significant Downtrend:
• The recent price action shows a notable decline from its highs, suggesting strong selling pressure.
• The price has fallen to a major support zone around $551.42, close to a longer-term uptrend line (green line).
2. Support & Resistance Levels:
• $563.91 – A previous support level turned resistance after the recent decline.
• $551.42 – Currently being tested as a support level.
• $539.44, $518.36, and $510.27 – Potential next support levels if price continues downward.
3. Trendline Test:
• The long-term uptrend line is being tested right now. If it holds, SPY could see a bounce.
• If it breaks below, it might lead to a deeper correction towards $539.44 or lower.
4. Indicators:
• Stochastic RSI (middle panel):
• Currently in oversold territory, suggesting that selling momentum is strong, but a potential bounce could occur.
• MACD (bottom panel):
• The histogram is deeply negative, showing strong downward momentum.
• The MACD lines are still bearish but may start flattening, which could indicate slowing bearish momentum soon.
Prediction for Tomorrow & Near-Term:
• Bullish Scenario:
• If $551.42 and the trendline hold, SPY may attempt a bounce toward $563.91 resistance.
• Confirmation would require bullish momentum on lower timeframes and increased volume.
• Bearish Scenario:
• If SPY breaks below $551.42 and the trendline, expect further downside to $539.44 and possibly $518.36 in the coming days.
• A continued negative MACD and weak Stoch RSI would reinforce this bearish outlook.
Conclusion:
• Critical level to watch: $551.42.
• If SPY closes above it, we could see a short-term rebound.
• If it breaks below, expect more downside pressure toward $539.44 and $518.36.
Nightly $SPY / $SPX Scenarios for March 14, 2025🔮 🔮
🌍 Market-Moving News 🌍:
🇺🇸⚠️ Potential U.S. Government Shutdown ⚠️: The United States faces a potential government shutdown on March 14 if lawmakers fail to agree on the 2025 budget. This impasse could lead to the closure of government agencies and furloughs of federal employees, impacting various sectors and potentially affecting market sentiment.
📊 Key Data Releases 📊:
📅 Friday, March 14:
🛒 University of Michigan Consumer Sentiment Index (10:00 AM ET) 🛒:This index measures consumer confidence regarding personal finances, business conditions, and purchasing power, providing insights into consumer sentiment.
Forecast: 64.0
Previous: 64.7
🛢️ Baker Hughes Rig Count (1:00 PM ET) 🛢️:This report provides the number of active drilling rigs in the U.S., offering insights into the oil and gas industry's health.
Previous: 592
⚠️ Disclaimer: This information is for educational and informational purposes only and should not be construed as financial advice. Always consult with a professional financial advisor before making investment decisions.⚠️
📌 #trading #stockmarket #economy #news #trendtao #charting #technicalanalysis
Mind blowing 507 and 337 Price Targets Signal Trouble AheadI’m not here to throw out wild price targets—I’m just following the technicals, and they’re telling me one thing: this market looks weak. Whether we hit 507 first or head straight to 337, my stance remains the same—I’m bearish until proven otherwise. In this video, I’ll break down the charts, key levels, and the risks I see playing out. No predictions—just pure technical analysis. Feel free to tell me your opinions.
SPY/S&P500 price retracement targets based on fractals 478-482
The chart above looks at stock market retracements since the 2008 bottom. Retracements are simple Fibonacci ratios. In my observation, except for COVID-19 19 which was an outlier, every time the stock market crashed, it found bottom around .236 Fib ratio. This means that if this crash continues, the market will most likely find bottom around SPY 482 - 478.
SPY/QQQ Plan Your Trade EOD Update for 3-13-25What a crazy day. The markets certainly decided to burn the longs almost all day.
I got a few messages from traders who continued trying to pick bottoms in this downtrend. FYI, that can be very dangerous.
If you are a short-term trader and are trying to pick a base/bottom all day today - you have to have a limit in terms of how much you are willing to risk within a single day.
I've seen dozens of traders blow up their accounts in a big, trending market.
Please learn from your actions. Develop a STOP POINT related to your trading decisions.
There is no reason to continue to try to execute "bounce" trades when the markets are trending as strongly as they are today.
This video should help you understand what I see as the potential over the next 5+ days.
We are still trying to hold above critical support near the 50% retracement level on the SPY.
Everything depends on what happens in DC and how the markets perceive risks.
Gold/Silver rallied very strong today. This is FEAR related to risks.
If the US government enters a shutdown, Gold and Silver could skyrocket much higher.
Get some.
#trading #research #investing #tradingalgos #tradingsignals #cycles #fibonacci #elliotwave #modelingsystems #stocks #bitcoin #btcusd #cryptos #spy #gold #nq #investing #trading #spytrading #spymarket #tradingmarket #stockmarket #silver
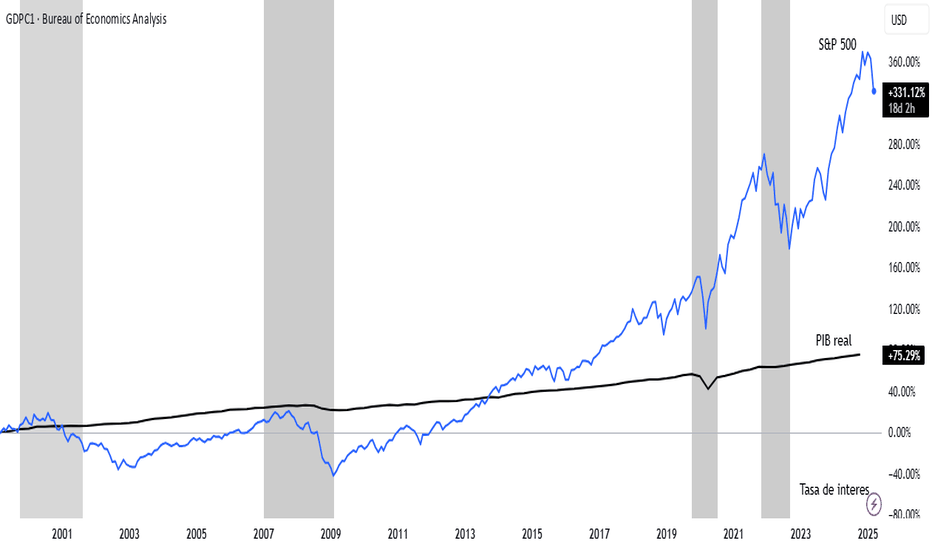
Real GDP vs SP500Real GDP and the S&P 500 are interconnected indicators of economic health, though they measure different aspects of the economy. Real GDP reflects the total value of goods and services produced, adjusted for inflation, and serves as a broad measure of economic growth. The S&P 500, on the other hand, represents the performance of 500 large-cap U.S. companies and is often seen as a barometer of corporate profitability and investor sentiment. Generally, when Real GDP grows, it signals a healthy economy, which can boost corporate earnings and drive stock prices higher, positively impacting the S&P 500. Conversely, a decline in Real GDP, such as during a recession, can weigh on corporate profits and lead to declines in the S&P 500. However, the relationship isn't always direct or immediate. For example, the S&P 500 is forward-looking and often reacts to expectations of future GDP growth rather than current data. Additionally, factors like monetary policy, interest rates, and global market conditions can influence the S&P 500 independently of Real GDP trends. In periods of economic uncertainty, the S&P 500 might rally on hopes of stimulus or recovery, even if Real GDP data remains weak. Thus, while Real GDP and the S&P 500 often move in tandem over the long term, their relationship can diverge in the short term due to market sentiment and external influences.
SP500 vs fedfundsrateThe interest rate and the S&P 500 share a complex yet significant relationship in financial markets. When interest rates rise, the cost of borrowing typically increases for companies, which can reduce their profits and, in turn, put downward pressure on S&P 500 stock prices. Additionally, higher rates make bonds and other fixed-income assets more attractive compared to stocks, potentially leading to a shift of capital away from the equity market. Conversely, when interest rates are low, companies can borrow more cheaply, which tends to boost earnings and, consequently, the performance of the S&P 500. However, other factors such as economic growth, inflation, and market expectations also play a role in this dynamic, making the relationship neither linear nor entirely predictable.
A Huge Technical Re-Test of This Important TL Has Just Occurred!Trading Family,
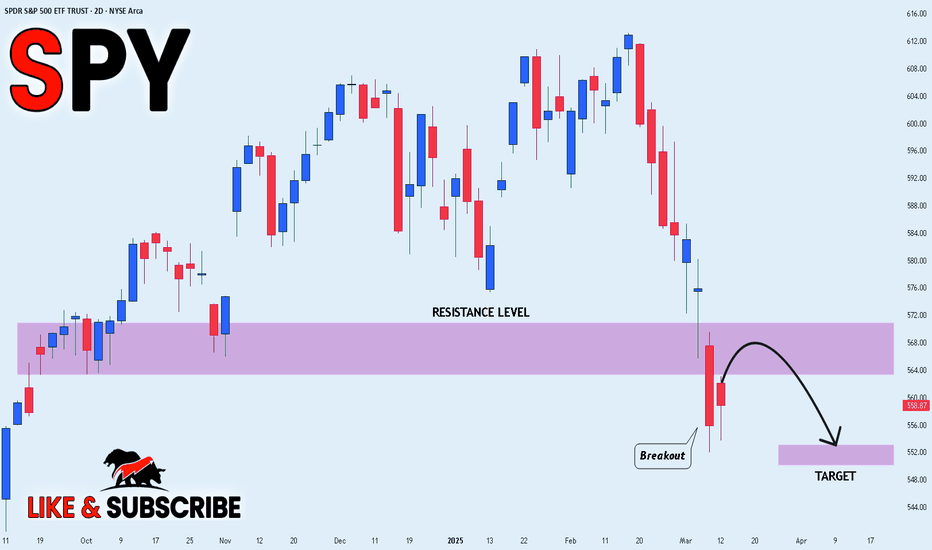
Tariff FUD is recking traders rn. After breaking important support which started in Nov. '24, I knew the SPY was in trouble. My first target down was 563. We hit that and broke it. My second target down was 550. We are there right now! Will it hold? I don't know. TBH, I don't think any analyst that is honest knows. Investors have never seen Tariffs levied like they have been recently by the Trump admin. Noone really knows how this is going to impact the current economy, which is now global (big diff from the last U.S. tariff econ in the late 1800's).
But I can say that this is a big support which is the neckline of our large long-term Cup and Handle pattern started all the way back in Jan. of 2022! We did have one retest already. Usually, this is all that is needed. But apparently, the market wants another. Though the support is strong, remember, every time it is tagged, it weakens. Thus, if it can't hold this current downturn, I suspect it will drop hard from here should it break, possibly dropping all the way to 460. Be prepared for this and watch your trendline closely!
On the other hand, if it holds, I see a huge bounce incoming! We'll probably then go all the way back up to test the underside of that support (red with two with lines) that we broke. Hold on to your hats! We are living in unprecedented times with unprecedented market volatility.
The last item to note is that, once again, this all seems to be occurring at the same time that U.S. congress and senate are voting on a continuing resolution. Correlation does not necessarily equal causation however, in this case, I would suggest that should a U.S. gov't shutdown occur, our support will break and down we'll go. Should a CR pass, big bounce incoming. Stay tuned and watch the news closely for this. It seems to be a news driven event.
✌️ Stew
SPY/QQQ Plan Your Trade Update For 3-13-25 - Fear Settling InWith the US government only about 39 hours away from a complete SHUT DOWN, I want to warn everyone that metals are doing exactly what they are supposed to do - hedge risks. While the SPY/QQQ are continuing to melt downard.
I created this video to show you the Fibonacci Trigger levels on the 60 min SPY chart, which I believe are very important. Pause the video when I show you the proprietary Fibonacci price modeling system and pay attention to the fact that any upward price trend must rally above 563.85 in order to qualify as a new Bullish price trend.
That means we need to see a very solid price reversal from recent lows or an intermediate pullback (to the upside) which will set a new lower Bullish Fibonacci trigger level.
Overall, the SPY/QQQ are in a MELT DOWN mode and I expect this to last into early next week unless the US government reaches some agreement to extend funding.
This is not the time to try to load up on Longs/Calls.
The US and global markets are very likely to MELT DOWNWARD over the next 2 to 5+ days if the US government does SHUT DOWN.
FYI.
Gold and Silver may EXPLODE HIGHER.
Get some.
#trading #research #investing #tradingalgos #tradingsignals #cycles #fibonacci #elliotwave #modelingsystems #stocks #bitcoin #btcusd #cryptos #spy #gold #nq #investing #trading #spytrading #spymarket #tradingmarket #stockmarket #silver
SPY/QQQ Plan Your Trade For 3-13-25: Carryover PatternToday's pattern suggests the markets may attempt to continue to find support and move into a sideways pullback (upward) price channel.
I believe the markets have reached an exhaustion point that will move the SPY/QQQ slightly upward over the next 5 to 10+ days - reaching a peak near the 3-21 to 3-24 Bottoming pattern.
This bottoming pattern near March 21-24 suggests the markets will move aggressively downward near that time to identify deeper support.
I believe metals will continue to move higher as risks and fear drive assets into safe havens.
Bitcoin should continue to slide a bit higher while moving through the consolidation phase.
Watch today's video to learn more about what I do and how I help traders find the best opportunities.
Get some.
#trading #research #investing #tradingalgos #tradingsignals #cycles #fibonacci #elliotwave #modelingsystems #stocks #bitcoin #btcusd #cryptos #spy #gold #nq #investing #trading #spytrading #spymarket #tradingmarket #stockmarket #silver


