Is this the tariff top?CME_MINI:ES1! NYSE:ES and AMEX:SPY are completing a rectangle top with a close in the SPY below 572.85. Price target is 552.01 in AMEX:SPY
SPY trade ideas

SPY Possible Move in MarchA clear band is forming, SP and NQ may bounce back to upper band with VIX drop following by a deeper pullback.

SPY: Start of Wave 2 The market has experienced consolidation at the 575 level and with RSI in the basement I am expecting a powerful reversal to the upside by Friday that will last several weeks. Wave 2 targets are at 597 (0.618) and 604 (0.786) before a larger selloff begins in April.

SPY - support & resistant areas for today March 6, 2025The key support and resistance levels for QQQ today are above.
Understanding key levels in trading can provide valuable insights into potential market movements. These levels often indicate where prices might reverse or consolidate, serving as important signals for traders considering long (buy) or short (sell) positions.
Calculated using complex mathematical models, these levels are tailored for today's trading session and may evolve as market conditions change.
If you find this information beneficial and would like to receive these insights every morning at 9:30 AM, I invite you to support me by boosting this post and following me @OnePunchMan91. Your engagement is greatly valued! However, please note that if this post doesn’t receive more than 10 boosts, I will have to reconsider providing these daily updates. Thank you for your support!

Catch a bounce or die off into 565 territory???Trend is still rejecting that 573 level, looking for a bounce back to secure 591 range eventually or next leg down see ya there, trade safe! Trade smart!

SPY/QQQ Plan Your Trade for 3-6-25: Breakaway PatternToday's Breakaway pattern suggests the SPY/QQQ will attempt to move away from yesterday's open/close price range.
Given the fairly strong downward pre-market trending in the SPY/QQQ, I'm cautiously optimistic we will see a fairly strong MELT-UP in price related to the recent support/rejection levels near 575.
I'm urging my followers to be cautious of the first 30-60 minutes of market activity today. Jobs data (or other data) could disrupt price after the open and I believe price will be very volatile in the first 30-60 minutes of trading today.
In other words, price may try to SHAKE-OUT early positions with wild volatility before settling into a MELT-UP or MELT-DOWN trend.
As I shared in my video, today's BreakAway pattern could break upward or downward. I believe the upward trend potential has about a 60-70% chance of happening IF the 575 level holds as support. If not, then we will probably break downward.
The fact that BTCUSD is holding up quite well suggests the SPY/QQQ may actually MELT-UPWARD. Again, we need to see how things play out in early trading today.
Gold & Silver are consolidating into a range which may continue over the next 3-4 days. The current bias for Gold and Silver is an uptrend. So, I do believe metals will continue to appreciate throughout this 3-4 day consolidation phase.
The only reason I urge traders to stay cautious for the first 30-60 minutes is because of the Jobs data and how the markets may react to news items. You can't kick the markets to go in a certain direction.
So, often, it is better to let the morning SHAKE-OUT happen, then wait for more clear trending to setup.
Get some.
#trading #research #investing #tradingalgos #tradingsignals #cycles #fibonacci #elliotwave #modelingsystems #stocks #bitcoin #btcusd #cryptos #spy #es #nq #gold

$SPY Analysis, Key Levels & Targets for March 6th 2025
Alright. Well. Right now where futures are at we are underneath this trading range - but this is our range.
If we do gap down at open then the 200Day moving average and the 35EMA on the Weekly and of course the 30min 35EMA the focus. Support is at 575 and that’s where we are in premarket.
Looking a bit droopy from here but let’s see how we open. GL today, y’all.

$SPY March 6, 2025AMEX:SPY March 6, 2025
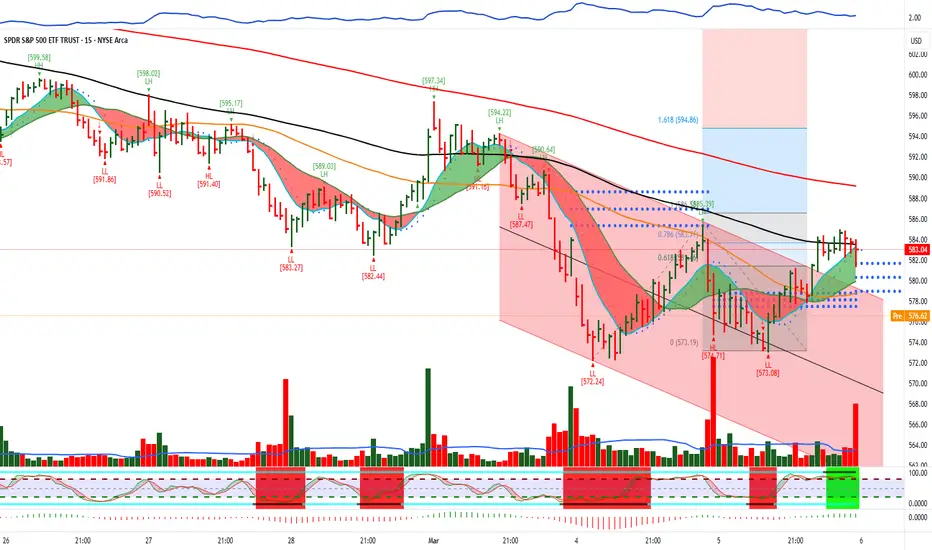
15 Minutes.
As expected, we had SPY around 575. Taking support and trying to form a base.
Important because 570 is 200 averages in daily.
Once 570 is broken we are in trouble.
Now for the rise 572.74 to 586.58 to 573.08 we can expect 588- 594 as target provided 573 is held.
We rea having oscillator divergence in 15 and 30 minutes but not in 60 minutes.
So, i expect some volatility today/tomorrow for these 575 levels.
Not the time to longs. At the moment.
$SPY Analysis, Key Levels & Targets for March 5th 2025
What is running through the trading range today?
The 200DMA on the downside, the 1W 35EMA in the middle and the 35EMA on the 30min near the top. Should be a fun day here.
Expected move 568 to 586 (+/- 1.38%)

$H|ts n Giggles SPY PostPredictive but Lets see if it plays out.
FYI I charted the long zone, support and resistance last week. Found the BAT yesterday seeing if a bear flag was forming and was it legit.

Nightly $SPY / $SPX Scenarios for March 6, 2025🔮 🔮
🌍 Market-Moving News 🌍:
🇪🇺💶 ECB Interest Rate Decision 💶: The European Central Bank is expected to announce a 25 basis point reduction in its deposit rate, bringing it to 2.5%. This move aims to stimulate economic growth amid ongoing uncertainties, including trade tensions and fiscal policy shifts.
📊 Key Data Releases 📊:
📅 Thursday, March 6:
📉 Initial Jobless Claims (8:30 AM ET) 📉:This weekly report indicates the number of individuals filing for unemployment benefits for the first time, providing insight into the labor market's health.
Forecast: 220K
Previous: 215K
📦 Factory Orders (10:00 AM ET) 📦:This report details the dollar level of new orders for both durable and non-durable goods, offering insight into manufacturing demand.
Forecast: -0.5%
Previous: +1.2%
⚠️ Disclaimer: This information is for educational and informational purposes only and should not be construed as financial advice. Always consult with a professional financial advisor before making investment decisions.⚠️
📌 #trading #stockmarket #economy #news #trendtao #charting #technicalanalysis

Good on here Assuming we stay above $578.5 im proud to claim that this is a good point to start buying the dip. We saw signs Feb was better than Jan and in the best of times we may say, by July we won't even be talking about inflation - remember 2021? Inflation didn't become a thing again until Jan 2022 when rates begun getting raised. We don't know how things will play out into summer but the stock market is all relative and tomorrow looks better than today, today.

Recession IncomingVery clear confirmation signals here across many sectors in the market that we are in a recession. Fundamentals were breaking down last summer in fact, but now everything is rising to the surface and markets are turning. Buckle up.
Oil is breaking down today.
Bond yields continue to signal de-risking.
USD continues to break down.
USD/JPY is heading lower back toward July panic levels.
VIX is sustaining above 20.
I'm not 100% clear on the structure of this count, so please feel free to share your charts and insight here, but I don't think we are looking at a buy the dip and shoot back to new highs situation anytime soon here.. Unless Trump's entire policy stance changes, he drops Tariffs, and starts increasing the deficit and handing out money, the tightening and de-risking will continue. That said, I believe this is a great thing long-term and is what needs to happen, so I am all for a recession at this point. But this medicine is going to tasty very bad.
All of those white boxes below the price chart are unfilled gaps. I'm not entirely sure if there is an amount of time that passes that makes unfilled gaps less reliable, but still they are there.

SPY/QQQ Plan Your Trade For 3-5-25: Flat-Down PatternToday's pattern suggests the SPY will move into a sideways type of stalling pattern. Based on yesterday's rejection off the lows, I suspect we may see some continued upward reversion trending, then we'll likely see the SPY move into a stalling pattern near 579.
Ultimately, the Flat-Down pattern does not suggest big trending will take place today.
Yesterday's price rejection off the lows adds a bit to the overall picture that the SPY may attempt to move away from that lower support level - thus, we may see some upward "melt-up" type of trend today.
But, overall, I'm not confident we'll see any big price trends today. I expect the SPY to stay somewhat flat/muted today. Same thing with the QQQ.
If we do see any big price move today, it will likely be news-related.
Gold and Silver are both sitting near 618 pause levels and continuing to try to push higher. I believe both gold and silver will make an expansion move over the next 5 to 7+ trading days and begin a very solid rally phase. Where gold will attempt to break above $3000 and Silver will attempt to rally above $35.
Bitcoin is still struggling in the Consolidation phase. This wide-range consolidation should continue until sometime near March 19-24.
Don't expect Bitcoin to do much except consolidate into the flagging sideways price trend for the next week or two.
Go get some today.
#trading #research #investing #tradingalgos #tradingsignals #cycles #fibonacci #elliotwave #modelingsystems #stocks #bitcoin #btcusd #cryptos #spy #es #nq #gold

SPY Trade Idea – March 2025📌 Trade Type: Bullish Rebound Play (Short-Term Swing)
🎯 Thesis:
SPY has experienced a sharp pullback, bouncing off key support near 572-576 with high volume. Indicators suggest oversold conditions, hinting at a short-term relief rally.
📊 Trade Plan
🟢 Long Entry (Buy Call Options or Shares)
Entry Zone: $575 - $578 (Wait for confirmation of support holding)
Stop Loss: $568 (Below strong support; exit if broken)
Take Profit Targets:
TP1: $590 (Short-term resistance)
TP2: $600-$603 (Major resistance & profit zone)
🔴 Bearish Alternative (Hedge or Short)
If SPY breaks below $568, enter PUT options or short with:
Target: $560-$556
Stop Loss: $575

SPX SPY Trading Range or BO? Daily Chart Analysis - 5 Mar 2025
• The market traded lower earlier in the day. The market then reversed higher for most of the day around noon time. The SPX then pulled back off its high in the final 30 minutes of the day.
• The bulls see the market trading in a broad bull channel and want the move to continue for months. They want an endless pullback bull trend.
• They want a retest of the all-time high (Dec 6) followed by a breakout and trend resumption. They see the current move as a bull leg within the trading range.
• They want a reversal from a double bottom bull flag (Jan 13 and Mar 4) and a wedge (Feb 25, Feb 28, and Mar 4).
• They hope the bottom of the 22-week trading range will act as support. They want a failed breakout below the January 13 low.
• At the least, they want a retest of the middle of the trading range (around the 20-day EMA).
• If the market trades lower, they want the November 4 or October 3 low to act as support.
• The bears got a reversal from a higher high major trend reversal, a wedge top (Dec 6, Jan 24, and Feb 19), and a smaller double top (Jan 24 and Feb 19).
• They see the market as being in a 22-week trading range.
• They hope to get a bear leg to retest the January 13 low followed by a breakout below. They got it yesterday (Mar 4).
• Next, the bears want a breakout below the January 13 low, followed by a measured move based on the height of the 22-week trading range.
• If the market trades higher, they want the bear trend line or the 20-day EMA to act as resistance.
• They want at least a small second leg sideways to down to retest the March 4 low.
• So far, the market is trading in a 22-week trading range.
• The SPX broke below the January 13 low yesterday (Mar 4) and traders want to see if there are any follow-through selling.
• Or will the market form a pullback, followed by a second leg sideways to down to retest the March 4 low after that?
• Traders may BLSH (Buy Low, Sell High) within the trading range until there is a breakout from either direction with follow-through buying/selling.
• The bears must create a strong breakout below the January 13 low with follow-through selling to convince traders a breakout could be underway.

Nightly $SPY / $SPX Scenarios for March 5, 2025🔮 🔮
🌍 Market-Moving News 🌍:
🇨🇳📉 China's Manufacturing Activity Contracts 📉: China's official Manufacturing Purchasing Managers' Index (PMI) fell to 49.9 in February, down from 50.1 in January, indicating a contraction in manufacturing activity for the second consecutive month. This downturn raises concerns about global economic growth and could impact markets worldwide.
📊 Key Data Releases 📊:
📅 Wednesday, March 5:
📄 ADP National Employment Report (8:15 AM ET) 📄:
Forecast: +160K jobs
Previous: +183K jobs
This report provides a monthly snapshot of private-sector employment, offering insights into labor market trends ahead of the official government employment data.
🏢 ISM Services PMI (10:00 AM ET) 🏢:
Forecast: 53.0
Previous: 52.8
This index assesses the performance of the U.S. services sector. A reading above 50 indicates expansion, while below 50 signifies contraction.
🏭 Factory Orders (10:00 AM ET) 🏭:
Forecast: -0.5%
Previous: +1.2%
This report details the dollar level of new orders for both durable and non-durable goods, providing insight into manufacturing demand.
⚠️ Disclaimer: This information is for educational and informational purposes only and should not be construed as financial advice. Always consult with a professional financial advisor before making investment decisions.⚠️
📌 #trading #stockmarket #economy #news #trendtao #charting #technicalanalysis


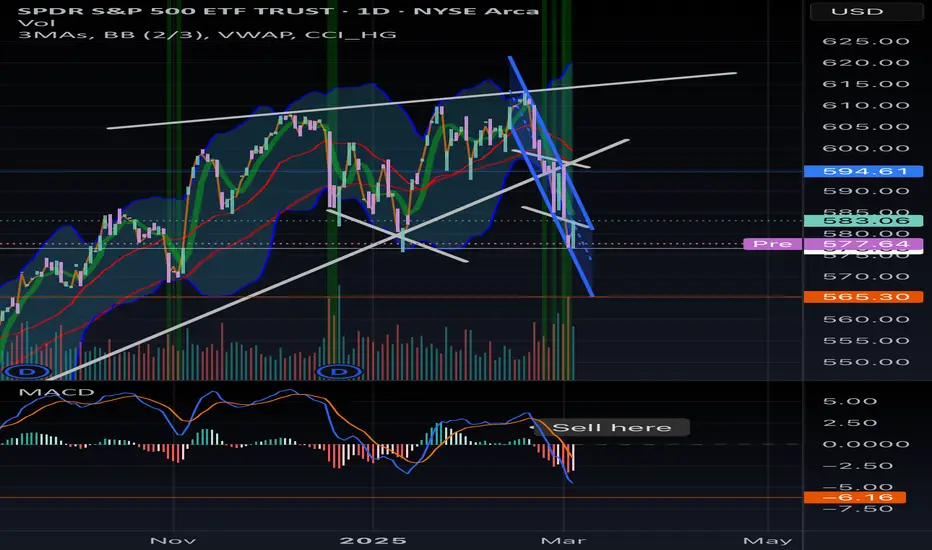
S&P500: Reasons of DeclineThe S&P 500 has been experiencing a clear downtrend, characterized by a progression of lower highs and lower lows meaning that each attempt at a rebound is met with increased selling, preventing the market from establishing a meaningful recovery.
The current formation suggests that bearish sentiment is still dominant, with investors possibly looking for further downside support levels before a potential reversal. Until we see a shift in this downtrend structure, such as series a higher lows followed by a higher highs, the market is likely to remain under pressure. Another confirmation would be a breakout from line that connects ATH and 2 lower highs.
Main factors in play:
Geopolitical instability affecting investor confidence.
Tariffs and trade wars increasing costs for businesses and consumers.
Weakened global alliances leading to market uncertainty.
Rising economic risks impacting corporate earnings and economic growth expectations.
Protectionist policies can backfire
U.S. tariffs negatively impact the economy by increasing costs for businesses and consumers, disrupting trade relationships, and fueling economic uncertainty. Recent tariffs on imports from trading partners like Mexico and Canada raise prices on goods such as automobiles, energy, raw materials, and food, leading to inflationary pressures that hurt both companies and consumers. Businesses reliant on imported components face higher production costs, forcing them to either absorb the costs, reducing profitability, or pass them on to consumers, decreasing demand. Retaliatory tariffs from affected countries further compound the issue by making U.S. exports less competitive abroad, harming industries like agriculture, manufacturing, and technology. The threat of supply chain disruptions and escalating trade conflicts creates market volatility creating discouraging investment climate and prompting sell-offs in equities. Additionally, fears of a broader economic slowdown due to weakened global trade relations further erode investor confidence, contributing to stock market declines.
Impact of recent geopolitical shift
The S&P 500 likely fell in response to the geopolitical instability and uncertainty stemming from recent events. Investors tend to react negatively to signs of weakening U.S. leadership on the global stage, especially when it leads to disruptions in alliances and strategic partnerships that have historically provided economic and military stability. Seeing the U.S. aligning with autocracies while European and NATO allies are preparing for a future without American leadership introduces concerns about global security and long-term economic consequences. Furthermore, the perception that adversaries of free world may become more aggressive, potentially escalating conflicts, obviously adds to market anxieties. Investors fear that heightened geopolitical tensions could lead to disruptions in trade, energy markets, and global supply chains, all of which can negatively impact corporate earnings and economic growth. As a result, market participants likely sold off equities in favor of safer assets, leading to a decline in the S&P 500.
This demonstrates how political decisions can have far-reaching effects on financial markets and beyond.

[03/03] SPY GEX Analysis (Until Friday Expiration)Overall Sentiment:
Currently, there’s a positive GEX sentiment, suggesting an optimistic start to the week following Friday’s bounce. However, the key Call resistance appears at 600, and it may not break on the first attempt. If optimism remains strong, there’s a chance SPY 0.09%↑ could still push above that zone after some initial back-and-forth.
🟢Upside Levels:
600–605 Zone: This is a major resistance area. Should SPY move decisively through 600/605, the next potential target could be 610.
610: This is currently the largest positive GEX zone for the week. Current option pricing suggests only about a 9% chance of closing at or above 610 by Friday, so it might require a particularly strong move to break through.
🔵 Transition Zone: Roughly 592–599. The gamma flip level is near 592, and staying above that keeps the market in a positive gamma range for now.
🔴 Downside Risk:
If 592 Fails (or HVL climbing up during the week, and after that HVL fails…): A drop could accelerate toward 585, which may act as the first take-profit zone for bears. Below that, 580 could be in play if selling intensifies.
Lower Support: 575 is the last strong support mentioned, but current option probabilities suggest about an 88% chance of finishing above that level, making a move below 575 less likely—though still possible given the higher put skew.
🟣Volatility & Skew:
IVR (Implied Volatility Rank) is quite high on SPY, with a notable put pricing skew (around 173.1%).
This heightened put skew indicates the market is pricing in faster, more volatile downward moves compared to upside.

S&P500 $SPY | SPY’s All-Time High - Where to Next? | Feb23'25S&P500 AMEX:SPY | SPY’s All-Time High - Where to Next? | Feb23'25
AMEX:SPY BUY/LONG ZONE (GREEN): $597.50 - $613.23
AMEX:SPY DO NOT TRADE/DNT ZONE (WHITE): $584.88 - $597.50
AMEX:SPY SELL/SHORT ZONE (RED): $574.00 - $584.88
AMEX:SPY Trends:
AMEX:SPY Weekly Trend: Bullish
AMEX:SPY Daily Trend: Bullish
AMEX:SPY 4H Trend: Bullish
AMEX:SPY 1H Trend: Bearish
AMEX:SPY just reached a new all-time high! How did price get there?
AMEX:SPY experienced a small range between 602.45 – 604.00, followed by bearish momentum, leading to a 3% drop in price. However, bullish momentum quickly stepped in, pushing the price up before continuing downward again. This bearish trend was short-lived and appears to have formed a developing range rather than a sustained downtrend.
Shortly after, price broke back above 597.50, signaling the start of a new bullish trend. SPY then established a ranging pattern between 597.50 - 608.00 before ultimately breaking out to a new all-time high of 613.23. Despite the breakout, price action has now dropped back into the range between 597.50 - 608.00.
Where to next? Will SPY hold its new highs, or is this the start of a reversal?
This is what I would personally look at before entering trades, everything is subject to change on a daily basis and as I analyze different timeframes and ideas.
ENTERTAINMENT PURPOSES ONLY, NOT FINANCIAL ADVICE!
trendanalysis, trendtrading, priceaction, priceactiontrading, technicalindicators, supportandresistance, rangebreakout, rangebreakdown, rangetrading, chartpatterntrading, chartpatterns, spy, sp500, s&p, fed, federalreserve, fedrate, AMEX:SPY , snp, snp500, usmarket, usmarkets, stockmarket, overallmarket, spyath, spyalltimehigh, all-time high, price action, bullish trend, bearish momentum, trading range, breakout, support and resistance, choppy market, untradable zone, stock market, technical analysis, market trends, price breakout, volatility, trend reversal, stock trading, SPY analysis, market momentum, trading strategy, sparros, sparrosexchange,

